by Calculated Risk on 10/15/2019 11:32:00 AM
Tuesday, October 15, 2019
Housing and Recessions
Now that new home sales have reached a new cycle high (in June), I'd like to update a couple of graphs in a previous post (most of this from an earlier post).
For the economy, what we should be focused on are single family starts and new home sales. As I noted in Investment and Recessions "New Home Sales appears to be an excellent leading indicator, and currently new home sales (and housing starts) are up solidly year-over-year, and this suggests there is no recession in sight."
For the bottoms and troughs for key housing activity, here is a graph of Single family housing starts, New Home Sales, and Residential Investment (RI) as a percent of GDP.

The arrows point to some of the earlier peaks and troughs for these three measures.
The purpose of this graph is to show that these three indicators generally reach peaks and troughs together. Note that Residential Investment is quarterly and single-family starts and new home sales are monthly.
RI as a percent of GDP has been sluggish recently.
Also, look at the relatively low level of RI as a percent of GDP, new home sales and single family starts compared to previous peaks. To have a significant downturn from these levels would be surprising.

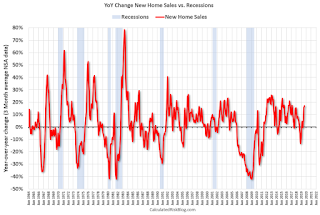
Note: the New Home Sales data is smoothed using a three month centered average before calculating the YoY change. The Census Bureau data starts in 1963.
Some observations:
1) When the YoY change in New Home Sales falls about 20%, usually a recession will follow. The one exception for this data series was the mid '60s when the Vietnam buildup kept the economy out of recession. Note that the sharp decline in 2010 was related to the housing tax credit policy in 2009 - and was just a continuation of the housing bust.
2) It is also interesting to look at the '86/'87 and the mid '90s periods. New Home sales fell in both of these periods, although not quite 20%. As I noted in earlier posts, the mid '80s saw a surge in defense spending and MEW that more than offset the decline in New Home sales. In the mid '90s, nonresidential investment remained strong.
Although new home sales were down towards the end of 2018, the decline wasn't that large historically. As I noted last Fall, I wasn't even on recession watch. Now new home sales are up solidly year-over-year. No worries.
NY Fed: Manufacturing "Business activity grew slightly in New York State"
by Calculated Risk on 10/15/2019 08:36:00 AM
From the NY Fed: Empire State Manufacturing Survey
Business activity grew slightly in New York State, according to firms responding to the October 2019 Empire State Manufacturing Survey. The headline general business conditions index edged up two points to 4.0. There was only a small increase in new orders, but shipments picked up. Delivery times decreased slightly, while inventories were little changed. Employment levels and hours worked both increased modestly.This was higher than the consensus forecast.
...
The index for number of employees came in at 7.6, pointing to ongoing modest employment gains, and the average workweek index rose seven points to 8.3, indicating that hours worked also increased.
…
Indexes assessing the six-month outlook suggested that optimism about future conditions improved somewhat but remained subdued. The index for future business conditions edged up three points to 17.1 but remained well below the levels seen for much of the past few years.
emphasis added
Monday, October 14, 2019
Tuesday: NY Fed Mfg
by Calculated Risk on 10/14/2019 09:16:00 PM
Tuesday:
• At 8:30 AM ET, The New York Fed Empire State manufacturing survey for October. The consensus is for a reading of 0.8, down from 2.0.
Update: Real Estate Agent Boom and Bust
by Calculated Risk on 10/14/2019 11:44:00 AM
Way back in 2005, I posted a graph of the Real Estate Agent Boom. Here is another update to the graph.
The graph shows the number of real estate licensees in California.
The number of agents peaked at the end of 2007 (housing activity peaked in 2005, and prices in 2006).
The number of salesperson's licenses is off 26% from the peak, and is increasing again (up 11% from low). The number of salesperson's licenses has increased to November 2004 levels.
Brokers' licenses are off 14.2% from the peak and have fallen to December 2005 levels, and may be bottoming..

We are seeing a pickup in Real Estate licensees in California, although the number of Brokers is mostly flat.
Oil Prices
by Calculated Risk on 10/14/2019 09:24:00 AM
From Reuters: Oil falls due to caution over first phase of U.S.-China trade deal
Oil prices fell more than 2% on Monday as scant details about the first phase of a trade deal between the United States and China undercut optimism over a U.S.-Sino thaw that had helped lift crude markets by 2% at the end of last week.
 Click on graph for larger image
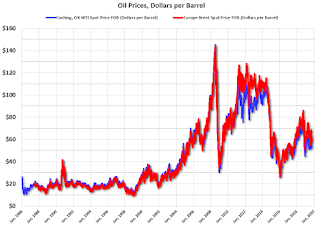
The first graph shows WTI and Brent spot oil prices from the EIA. (Prices today added).
According to Bloomberg, WTI is at $53.44 per barrel today, and Brent is at $59.13.
Prices collapsed in 2008 due to the financial crisis, and then increased as the economy recovered. Oil prices collapsed again in 2014 and 2015, mostly due to oversupply.
 The second graph shows the year-over-year change in WTI based on data from the EIA.
Six times since 1987, oil prices have increased 100% or more YoY. And several times prices have almost fallen in half YoY.
Currently WTI is down 28% year-over-year.
Just a reminder that oil prices are volatile!
Sunday, October 13, 2019
Sunday Night Futures
by Calculated Risk on 10/13/2019 08:04:00 PM
Weekend:
• Schedule for Week of October 13, 2019
Monday:
• Columbus Day Holiday: Banks will be closed in observance of Columbus Day. The stock market will be open. No economic releases are scheduled.
From CNBC: Pre-Market Data and Bloomberg futures: S&P 500 are up 10 and DOW futures are up 107 (fair value).
Oil prices were up over the last week with WTI futures at $54.79 per barrel and Brent at $60.58 barrel. A year ago, WTI was at $72, and Brent was at $81 - so oil prices are down about 25% year-over-year.
Here is a graph from Gasbuddy.com for nationwide gasoline prices. Nationally prices are at $2.63 per gallon. A year ago prices were at $2.89 per gallon, so gasoline prices are down 26 cents year-over-year.
U.S. Heavy Truck Sales down 5% Year-over-year in September
by Calculated Risk on 10/13/2019 10:32:00 AM
The following graph shows heavy truck sales since 1967 using data from the BEA. The dashed line is the September 2019 seasonally adjusted annual sales rate (SAAR).
Heavy truck sales really collapsed during the great recession, falling to a low of 180 thousand in May 2009, on a seasonally adjusted annual rate basis (SAAR). Then sales increased more than 2 1/2 times, and hit 479 thousand SAAR in June 2015.
Heavy truck sales declined again - mostly due to the weakness in the oil sector - and bottomed at 366 thousand SAAR in October 2016.
Click on graph for larger image.
Following the low in 2016, heavy truck sales increased to a new all time high in July 2019, but have declined over the last couple months.
Heavy truck sales were at 501 thousand SAAR in September, down from 538 thousand SAAR in August, and down from 526 thousand SAAR in September 2018.
Saturday, October 12, 2019
Schedule for Week of October 13, 2019
by Calculated Risk on 10/12/2019 08:11:00 AM
The key economic reports this week are September Housing Starts and Retail Sales.
For manufacturing, September Industrial Production, and the October New York and Philly Fed surveys, will be released this week.
Columbus Day Holiday: Banks will be closed in observance of Columbus Day. The stock market will be open. No economic releases are scheduled.
8:30 AM ET: The New York Fed Empire State manufacturing survey for October. The consensus is for a reading of 0.8, down from 2.0.
7:00 AM ET: The Mortgage Bankers Association (MBA) will release the results for the mortgage purchase applications index.
 8:30 AM ET: Retail sales for September will be released. The consensus is for a 0.3% increase in retail sales.
This graph shows the year-over-year change in retail sales and food service (ex-gasoline) since 1993. Retail and Food service sales, ex-gasoline, increased by 4.5% on a YoY basis in August.
10:00 AM: The October NAHB homebuilder survey. The consensus is for a reading of 68, unchanged from 68 in September. Any number above 50 indicates that more builders view sales conditions as good than poor.
 8:30 AM: Housing Starts for September.
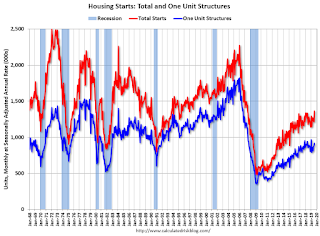
 This graph shows single and total housing starts since 1968.
The consensus is for 1.300 million SAAR, down from 1.364 million SAAR.
8:30 AM: The initial weekly unemployment claims report will be released. The consensus is for 215,000 initial claims, up from 210,000 last week.
8:30 AM: the Philly Fed manufacturing survey for October. The consensus is for a reading of 7.1, down from 12.0.
 9:15 AM: The Fed will release Industrial Production and Capacity Utilization for September.
This graph shows industrial production since 1967.
The consensus is for a 0.2% decrease in Industrial Production, and for Capacity Utilization to decline to 77.8%.
10:00 AM: State Employment and Unemployment (Monthly) for September 2019
Friday, October 11, 2019
Sacramento Housing in September: Sales Up 5.7% YoY, Active Inventory DOWN 24% YoY
by Calculated Risk on 10/11/2019 07:47:00 PM
From SacRealtor.org: Sales volume declines for September, median sale price flat
September closed with 1,393 sales, an 11.1% decrease from August’s 1,567 sales. Compared to September 2018 (1,318), the current figure is up 5.7%.1) Overall sales increased to 1,393 in September, up from 1,318 in September 2018. Sales were down 11.1% from August 2019 (previous month), and up 5.7% from September 2018.
...
The Active Listing Inventory decreased slightly from 2,460 to 2,457 units. The Months of Inventory increased from 1.6 to 1.8 Months. This figure represents the amount of time (in months) it would take for the current rate of sales to deplete the total active listing inventory. [Note: Compared to September 2018, inventory is down 24.1%] .
...
The Median DOM (days on market) remained at 12 and the Average DOM remained at 25. “Days on market” represents the days between the initial listing of the home as “active” and the day it goes “pending.” Of the 1,393 sales this month, 74.2% (1,034) were on the market for 30 days or less and 90.1% (1,246) were on the market for 60 days or less.
emphasis added
2) Active inventory was at 2,457, down from 3,236 in September 2018. That is down 24.1% year-over-year. This is the fifth consecutive YoY decline following 20 months of YoY increases in inventory.
This is another market that picked up in September.
Q3 GDP Forecast: Just Under 2%
by Calculated Risk on 10/11/2019 01:23:00 PM
From Merrill Lynch:
Misses in construction spending and trade coupled with negative revisions to capex data sliced 0.3pp from 3Q GDP tracking this week, leaving us at 1.6% qoq saar. [Oct 11 estimate]From the NY Fed Nowcasting Report
emphasis added
The New York Fed Staff Nowcast stands at 2.0% for 2019:Q3 and 1.3% for 2019:Q4. [Oct 11 estimate].And from the Altanta Fed: GDPNow
The GDPNow model estimate for real GDP growth (seasonally adjusted annual rate) in the third quarter of 2019 is 1.7 percent on October 9, down from 1.8 percent on October 4. [Oct 9 estimate]CR Note: These estimates suggest real GDP growth will be just under 2.0% annualized in Q3.


