by Calculated Risk on 10/25/2019 10:33:00 AM
Friday, October 25, 2019
Hotels: Occupancy Rate Decreased Year-over-year
From HotelNewsNow.com: STR: US hotel results for week ending 19 October
The U.S. hotel industry reported mostly negative year-over-year results in the three key performance metrics during the week of 13-19 October 2019, according to data from STR.The following graph shows the seasonal pattern for the hotel occupancy rate using the four week average.
In comparison with the week of 14-20 October 2018, the industry recorded the following:
• Occupancy: -0.9% to 72.4%
• Average daily rate (ADR): +0.2% to US$135.99
• RRevenue per available room (RevPAR): -0.7% to US$98.51
emphasis added
 Click on graph for larger image.
The red line is for 2019, dash light blue is 2018 (record year), blue is the median, and black is for 2009 (the worst year probably since the Great Depression for hotels).
Occupancy has been solid in 2019, and close to-date compared to the previous 4 years.
However occupancy will be lower this year than in 2018 (the record year).
Seasonally, the 4-week average of the occupancy rate will now move mostly sideways during the Fall business travel season - and then decline in the winter.
Data Source: STR, Courtesy of HotelNewsNow.com
Thursday, October 24, 2019
Freddie Mac: Mortgage Serious Delinquency Rate unchanged in September
by Calculated Risk on 10/24/2019 05:06:00 PM
Freddie Mac reported that the Single-Family serious delinquency rate in September was 0.61%, unchanged from 0.61% in August. Freddie's rate is down from 0.73% in September 2018.
Freddie's serious delinquency rate peaked in February 2010 at 4.20%.
This matches the last two months as the lowest serious delinquency rate for Freddie Mac since November 2007.
These are mortgage loans that are "three monthly payments or more past due or in foreclosure".

I expect the delinquency rate to decline to a cycle bottom in the 0.4% to 0.6% range - so this is close to a bottom.
Note: Fannie Mae will report for September soon.
Black Knight's First Look: National Mortgage Delinquency Rate Increased Seasonally in September, Foreclosure Inventory Lowest Since 2005
by Calculated Risk on 10/24/2019 02:31:00 PM
From Black Knight: Black Knight’s First Look: Despite Slight Seasonal Uptick, Mortgage Delinquencies Fall 11% From Last Year; Prepays More Than Double as Refi Wave Continues
• The national delinquency rate edged up seasonally in September to 3.53%, but fell 11.2% from one year prior for the largest year-over-year decline in eight monthsAccording to Black Knight's First Look report for September, the percent of loans delinquent increased in September compared to August, and decreased 11.2% year-over-year.
• Both serious delinquencies and active foreclosure inventory fell in the month as well, with the latter falling to its lowest level since late 2005
• Western states – Colorado, Oregon, Washington, Idaho, and California – continue to hold the nation’s lowest non-current rates (all delinquencies plus active foreclosures)
• Prepayment activity (SMM) rose by 3% from August despite facing headwinds from the typical seasonal decline in home sale-related prepayments
• Prepays are now up 121% from the same time last year as falling rates continue to spur refinance activity
The percent of loans in the foreclosure process decreased 0.4% in September and were down 7.7% over the last year.
Black Knight reported the U.S. mortgage delinquency rate (loans 30 or more days past due, but not in foreclosure) was 3.53% in September up from 3.45% in August.
The percent of loans in the foreclosure process decreased in September to 0.48% from 0.48% in August.
| Black Knight: Percent Loans Delinquent and in Foreclosure Process | ||||
|---|---|---|---|---|
| Sep 2019 | Aug 2019 | Sep 2018 | Sep 2017 | |
| Delinquent | 3.53% | 3.45% | 3.97% | 4.40% |
| In Foreclosure | 0.48% | 0.48% | 0.52% | 0.70% |
| Number of properties: | ||||
| Number of properties that are delinquent, but not in foreclosure: | 1,854,000 | 1,813,000 | 2,049,000 | 2,245,000 |
| Number of properties in foreclosure pre-sale inventory: | 252,000 | 253,000 | 268,000 | 358,000 |
| Total Properties Delinquent or in foreclosure | 2,106,000 | 2,066,000 | 2,317,000 | 2,603,000 |
A few Comments on September New Home Sales
by Calculated Risk on 10/24/2019 11:34:00 AM
New home sales for September were reported at 701,000 on a seasonally adjusted annual rate basis (SAAR). Sales for the previous three months were revised down slightly, combined.
Sales were above 700 thousand SAAR in three of the last four months - the best four month stretch since 2007.
Annual sales in 2019 should be the best year for new home sales since 2007.
Earlier: New Home Sales decreased to 701,000 Annual Rate in September.

This graph shows new home sales for 2018 and 2019 by month (Seasonally Adjusted Annual Rate).
Sales in September were up 15.5% year-over-year compared to September 2018.
Year-to-date (through September), sales are up 7.2% compared to the same period in 2018.
The comparisons for the next three months are easy, so sales should be solidly higher in 2019 than in 2018.
And here is another update to the "distressing gap" graph that I first started posting a number of years ago to show the emerging gap caused by distressed sales.

Following the housing bubble and bust, the "distressing gap" appeared mostly because of distressed sales.
Even though distressed sales are down significantly, following the bust, new home builders focused on more expensive homes - so the gap has only closed slowly.
I still expect this gap to close. However, this assumes that the builders will offer some smaller, less expensive homes.

This ratio was fairly stable from 1994 through 2006, and then the flood of distressed sales kept the number of existing home sales elevated and depressed new home sales. (Note: This ratio was fairly stable back to the early '70s, but I only have annual data for the earlier years).
In general the ratio has been trending down since the housing bust, and this ratio will probably continue to trend down a little more.
Note: Existing home sales are counted when transactions are closed, and new home sales are counted when contracts are signed. So the timing of sales is different.
Kansas City Fed: "Tenth District Manufacturing Eased Slightly in October"
by Calculated Risk on 10/24/2019 11:00:00 AM
From the Kansas City Fed: Tenth District Manufacturing Eased Slightly in October
The Federal Reserve Bank of Kansas City released the October Manufacturing Survey today. According to Chad Wilkerson, vice president and economist at the Federal Reserve Bank of Kansas City, the survey revealed that Tenth District manufacturing activity eased slightly in October, and expectations for future activity inched lower but remained slightly positive.Many of the comments are downbeat: "Trade war with China is really hurting our export business …", “Less sales to China means less manufacturing.”, “Backlog dropping like a rock in past several months."
“Overall regional factory activity declined again in October,” said Wilkerson. “This was driven by further deterioration in durable goods production, as nondurable manufacturing expanded slightly for the second straight month.”
...
The month-over-month composite index was -3 in October, down slightly from -2 in September, but above -6 in August. The composite index is an average of the production, new orders, employment, supplier delivery time, and raw materials inventory indexes.
emphasis added
Another weak regional manufacturing report.
New Home Sales decreased to 701,000 Annual Rate in September
by Calculated Risk on 10/24/2019 10:13:00 AM
The Census Bureau reports New Home Sales in September were at a seasonally adjusted annual rate (SAAR) of 701 thousand.
The previous three months were revised down slightly, combined.
"Sales of new single‐family houses in September 2019 were at a seasonally adjusted annual rate of 701,000, according to estimates released jointly today by the U.S. Census Bureau and the Department of Housing and Urban Development. This is 0.7 percent below the revised August rate of 706,000, but is 15.5 percent above the September 2018 estimate of 607,000."
emphasis added
 Click on graph for larger image.
The first graph shows New Home Sales vs. recessions since 1963. The dashed line is the current sales rate.
Even with the increase in sales over the last several years, new home sales are still somewhat low historically.
The second graph shows New Home Months of Supply.
 The months of supply was unchanged in September at 5.5 months from 5.5 months in August.
 The all time record was 12.1 months of supply in January 2009.
This is in the normal range (less than 6 months supply is normal).
"The seasonally‐adjusted estimate of new houses for sale at the end of September was 321,000. This represents a supply of 5.5 months at the current sales rate."
 On inventory, according to the Census Bureau:
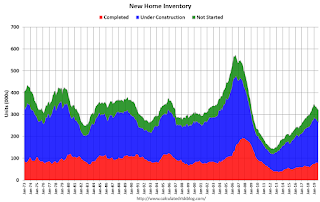
 "A house is considered for sale when a permit to build has been issued in permit-issuing places or work has begun on the footings or foundation in nonpermit areas and a sales contract has not been signed nor a deposit accepted."Starting in 1973 the Census Bureau broke this down into three categories: Not Started, Under Construction, and Completed.
The third graph shows the three categories of inventory starting in 1973.
The inventory of completed homes for sale is still somewhat low, and the combined total of completed and under construction is close to normal.
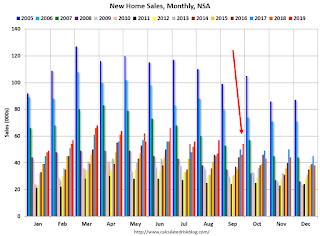
 The last graph shows sales NSA (monthly sales, not seasonally adjusted annual rate).
In September 2019 (red column), 54 thousand new homes were sold (NSA). Last year, 46 thousand homes were sold in September.
The all time high for September was 99 thousand in 2005, and the all time low for September was 24 thousand in 2011.
This was slightly above expectations of 699 thousand sales SAAR, however sales in the three previous months were revised down slightly, combined. I'll have more later today.
Weekly Initial Unemployment Claims decreased to 212,000
by Calculated Risk on 10/24/2019 08:38:00 AM
The DOL reported:
In the week ending October 19, the advance figure for seasonally adjusted initial claims was 212,000, a decrease of 6,000 from the previous week's revised level. The previous week's level was revised up by 4,000 from 214,000 to 218,000. The 4-week moving average was 215,000, a decrease of 750 from the previous week's revised average. The previous week's average was revised up by 1,000 from 214,750 to 215,750.The previous week was revised up.
emphasis added
The following graph shows the 4-week moving average of weekly claims since 1971.
 Click on graph for larger image.
The dashed line on the graph is the current 4-week average. The four-week average of weekly unemployment claims decreased to 215,000.
This was close to the consensus forecast.
Wednesday, October 23, 2019
Thursday: New Home Sales, Unemployment Claims
by Calculated Risk on 10/23/2019 09:07:00 PM
Thursday:
• At 8:30 AM, The initial weekly unemployment claims report will be released. The consensus is for 214,000 initial claims, unchanged from 214,000 last week.
• Also at 8:30 AM, Durable Goods Orders for September from the Census Bureau. The consensus is for a 0.7% decrease in durable goods orders.
• At 10:00 AM, New Home Sales for September from the Census Bureau. The consensus is for 699 thousand SAAR, down from 713 thousand in August.
• At 11:00 AM, the Kansas City Fed manufacturing survey for October.
Philly Fed: State Coincident Indexes increased in 39 states in September
by Calculated Risk on 10/23/2019 01:13:00 PM
From the Philly Fed:
The Federal Reserve Bank of Philadelphia has released the coincident indexes for the 50 states for September 2019. Over the past three months, the indexes increased in 42 states, decreased in six states, and remained stable in two, for a three month diffusion index of 72. In the past month, the indexes increased in 39 states, decreased in eight states, and remained stable in three, for a one-month diffusion index of 62.Note: These are coincident indexes constructed from state employment data. An explanation from the Philly Fed:
emphasis added
The coincident indexes combine four state-level indicators to summarize current economic conditions in a single statistic. The four state-level variables in each coincident index are nonfarm payroll employment, average hours worked in manufacturing by production workers, the unemployment rate, and wage and salary disbursements deflated by the consumer price index (U.S. city average). The trend for each state’s index is set to the trend of its gross domestic product (GDP), so long-term growth in the state’s index matches long-term growth in its GDP.
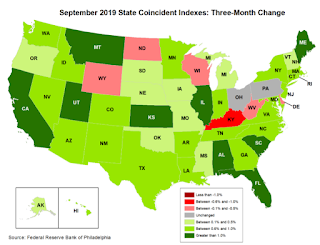
 Click on map for larger image.
Here is a map of the three month change in the Philly Fed state coincident indicators. This map was all red during the worst of the recession, and all or mostly green during most of the recent expansion.
The map is mostly green on a three month basis, but there are some red and gray states.
Source: Philly Fed.
Note: For complaints about red / green issues, please contact the Philly Fed.
 And here is a graph is of the number of states with one month increasing activity according to the Philly Fed. This graph includes states with minor increases (the Philly Fed lists as unchanged).
In September, 42 states had increasing activity (graph includes minor increases).
AIA: "Architecture Billings Index downturn moderates as challenging conditions continue"
by Calculated Risk on 10/23/2019 11:27:00 AM
Note: This index is a leading indicator primarily for new Commercial Real Estate (CRE) investment.
From the AIA: Architecture Billings Index downturn moderates as challenging conditions continue
While architecture billings moderated in September, design activity shows signs of remaining sluggish at U.S. architecture firms, according to a new report released today from the American Institute of Architects (AIA).
The Architecture Billings Index (ABI) score in September is 49.7, which improved from the August score of 47.2. However, any score below 50 indicates a decrease in billings. During September, both the new project inquiries and design contracts scores were positive, posting scores of 59.0 and 54.4 respectively.
“Though still in negative territory, the moderating billings score along with the rebound in design contracts and inquiries serve as a continued note of caution for the industry,” said AIA Chief Economist Kermit Baker, PhD, Hon. AIA. “Continued weakness in the larger economy still doesn’t bode well for future design services, which will likely see continued volatility in the months ahead.”
...
• Regional averages: South (52.3); West (51.3); Northeast (46.3); Midwest (45.3)
• Sector index breakdown: multi-family residential (53.2); mixed practice (53.0); institutional (48.5); commercial/industrial (45.3)
emphasis added
 Click on graph for larger image.
This graph shows the Architecture Billings Index since 1996. The index was at 49.7 in September, up from 47.2 in August. Anything below 50 indicates contraction in demand for architects' services.
Note: This includes commercial and industrial facilities like hotels and office buildings, multi-family residential, as well as schools, hospitals and other institutions.
According to the AIA, there is an "approximate nine to twelve month lag time between architecture billings and construction spending" on non-residential construction. This index has been positive for 8 of the previous 12 months, suggesting some further increase in CRE investment in 2019 - but all four negative reading have been in the last 7 months, and might suggest some decline in CRE investment in 2020.


