by Calculated Risk on 11/05/2019 08:57:00 AM
Tuesday, November 05, 2019
CoreLogic: House Prices up 3.5% Year-over-year in September
Notes: This CoreLogic House Price Index report is for September. The recent Case-Shiller index release was for August. The CoreLogic HPI is a three month weighted average and is not seasonally adjusted (NSA).
From CoreLogic: CoreLogic Reports September Home Prices Increased by 3.5% Year Over Year
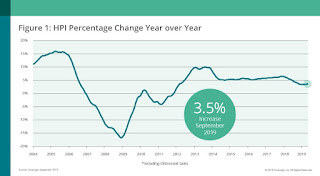
CoreLogic® ... today released the CoreLogic Home Price Index (HPI™) and HPI Forecast™ for September 2019, which shows home prices rose both year over year and month over month. Home prices increased nationally by 3.5% from September 2018. On a month-over-month basis, prices increased by 0.4% in September 2019.
Home prices continue to increase on an annual basis with the CoreLogic HPI Forecast indicating annual price growth will increase 5.6% by September 2020. On a month-over-month basis, the forecast calls for home prices to increase by 0.3% from September 2019 to October 2019. The CoreLogic HPI Forecast is a projection of home prices calculated using the CoreLogic HPI and other economic variables. Values are derived from state-level forecasts by weighting indices according to the number of owner-occupied households for each state.
“Mortgage rates were a full percentage point lower this September compared to a year ago, boosting affordability for first-time buyers and supporting a rise in homeownership,” said Dr. Frank Nothaft, chief economist at CoreLogic. “In addition to lower interest rates, personal income grew faster than home prices during the past year. This provided an additional lift for first-time buyer affordability and helped to boost the homeownership rate to the highest level in more than five years.”
emphasis added
 This graph is from CoreLogic and shows the YoY change in their index.
CR Note: The YoY change in the CoreLogic index decreased over the last year, but is now moving sideways.
Trade Deficit decreased to $52.5 Billion in September
by Calculated Risk on 11/05/2019 08:48:00 AM
From the Department of Commerce reported:
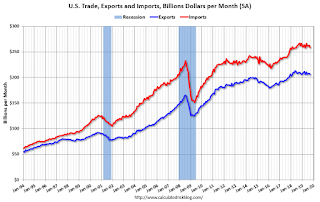
The U.S. Census Bureau and the U.S. Bureau of Economic Analysis announced today that the goods and services deficit was $52.5 billion in September, down $2.6 billion from $55.0 billion in August, revised.
September exports were $206.0 billion, $1.8 billion less than August exports. September imports were $258.4 billion, $4.4 billion less than August imports.
 Click on graph for larger image.
Both exports and imports decreased in September.
Exports are 25% above the pre-recession peak and down 2% to September 2018; imports are 11% above the pre-recession peak, and down 3% compared to September 2018.
In general, trade both imports and exports have moved more sideways or down recently.
The second graph shows the U.S. trade deficit, with and without petroleum.
 The blue line is the total deficit, and the black line is the petroleum deficit, and the red line is the trade deficit ex-petroleum products.
Note that the U.S. exported a slight net positive petroleum products in September.
Oil imports averaged $53.12 per barrel in September, down from $54.13 in August, and down from $61.40 in September 2018.
The trade deficit with China decreased to $31.6 billion in September, from $40.3 billion in September 2018.
Monday, November 04, 2019
Tuesday: Trade Deficit, Job Openings, ISM Non-Mfg
by Calculated Risk on 11/04/2019 08:55:00 PM
From Matthew Graham at Mortgage News Daily: Mortgage Rates Holding Gain, But Volatility Could Increase
Mortgage rates were flat to slightly higher today after dropping at fairly quick pace last week. In fact, if we're only examining one-day changes in rates, Thursday's drop was the quickest drop in months! That may sound slightly more impressive than it is, however. In terms of hard numbers, we're talking about roughly $22/month on a $300k loan.Tuesday:
Most of those savings are still intact today, but the risk of volatility remains. [Most Prevalent Rates 30YR FIXED 3.625-3.75%]
emphasis added
• At 8:30 AM ET, Trade Balance report for September from the Census Bureau. The consensus is for the deficit to be $52.5 billion in September, from $54.9 billion in August.
• At 10:00 AM, the ISM non-Manufacturing Index for October. The consensus is for an increase to 53.5 from 52.6.
• Also at 10:00 AM, Job Openings and Labor Turnover Survey for September from the BLS.
BEA: October Vehicles Sales decreased to 16.6 Million SAAR
by Calculated Risk on 11/04/2019 04:37:00 PM
The BEA released their estimate of October vehicle sales this morning. The BEA estimated sales of 16.55 million SAAR in October 2019 (Seasonally Adjusted Annual Rate), down 3.4% from the September sales rate, and down 5.3% from October 2019.
Sales in 2019 are averaging 16.91 million (average of seasonally adjusted rate), down 1.6% compared to the same period in 2018.

This graph shows light vehicle sales since 2006 from the BEA (blue) and an estimate for October (red).
The GM strike might have impacted sales in October.
A small decline in sales to date this year isn't a concern - I think sales will move mostly sideways at near record levels.
This means the economic boost from increasing auto sales is over (from the bottom in 2009, auto sales boosted growth every year through 2016).

Note: dashed line is current estimated sales rate of 16.55 million SAAR.
Zillow Case-Shiller Forecast: Similar YoY Price Gains in September compared to August
by Calculated Risk on 11/04/2019 02:03:00 PM
The Case-Shiller house price indexes for August were released last week. Zillow forecasts Case-Shiller a month early, and I like to check the Zillow forecasts since they have been pretty close.
From Matthew Speakman at Zillow: August Case-Shiller Results and September Forecast: Stabilizing, not Swooning
The S&P CoreLogic Case-Shiller U.S. National Home Price Index® rose 3.2% year-over-year in August (non-seasonally adjusted), up from 3.1% in July. Annual growth in the smaller 10-city index was slightly slower than July, and was unchanged in the 20-city index.
…
September data as reported by Case-Shiller are expected to show continued modest deceleration in annual growth in the 10-city and U.S. National indices, while growth in the 20-city index is expected to remain the same. S&P Dow Jones Indices is expected to release data for the September S&P CoreLogic Case-Shiller Indices on Tuesday, Nov. 26.
 The Zillow forecast is for the year-over-year change for the Case-Shiller National index to be at 3.1% in September, down from 3.2% in August.
 The Zillow forecast is for the 20-City index to be unchanged at 2.0% YoY in September from 2.0% in August, and for the 10-City index to decline to 1.4% YoY compared to 1.5% YoY in August.
Update: Framing Lumber Prices Up Year-over-year
by Calculated Risk on 11/04/2019 12:06:00 PM
Here is another monthly update on framing lumber prices. Lumber prices declined from the record highs in early 2018, and are now mostly unchnaged year-over-year.
This graph shows two measures of lumber prices: 1) Framing Lumber from Random Lengths through Nov 4, 2019 (via NAHB), and 2) CME framing futures.

Right now Random Lengths prices are up 5% from a year ago, and CME futures are up 30% year-over-year.
There is a seasonal pattern for lumber prices, and usually prices will increase in the Spring, and peak around May, and then bottom around October or November - although there is quite a bit of seasonal variability.
The trade war is a factor with reports that lumber exports to China have declined by 40% since last September.
Black Knight Mortgage Monitor for September: "Early-Stage Delinquencies Continue to Rise Among Purchase Loans"
by Calculated Risk on 11/04/2019 09:27:00 AM
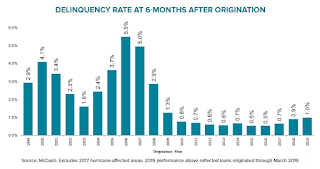
CR Note: Early-stage delinquencies are still historically very low, but have been increasing (see second graph).
Black Knight released their Mortgage Monitor report for September today. According to Black Knight, 3.53% of mortgages were delinquent in September, down from 3.97% in September 2018. Black Knight also reported that 0.48% of mortgages were in the foreclosure process, down from 0.52% a year ago.
This gives a total of 4.05% delinquent or in foreclosure.
Press Release: Black Knight’s September 2019 Mortgage Monitor: First-Time Homebuyers Under Pressure as Early-Stage Delinquencies Continue to Rise Among Purchase Loans
Today, the Data & Analytics division of Black Knight, Inc. released its latest Mortgage Monitor Report, based upon the company’s industry-leading mortgage performance, housing and public records datasets. This month, Black Knight looked at the current trend of rising early-stage delinquencies, particularly among purchase loans. As Black Knight Data & Analytics President Ben Graboske explained, the number of loans that were delinquent six months following origination has been increasing over the past 24 months, with first-time homebuyers being impacted most heavily.
“We’ve seen early-stage delinquencies rise over the last several years, with the increase being driven primarily by purchase loans,” said Graboske. “About 1% of loans originated in Q1 2019 were delinquent six months after origination. While that’s less than one-third of the 2000-2005 average of 2.95%, it represents a more than 60% increase over the last two years and is the highest it’s been since late 2010. Early-stage GSE delinquencies currently stand at 0.6%, up two tenths of a percentage point over the past 24 months, but still 40% below the market average and 60% below their own 2000-2005 average of 1.3%. Though there has been some softening in GSE purchase loan performance, it hasn’t been to the extent seen among entry-level buyers. All in all, first-time homebuyer originations combined between the GSEs and GNMA increased by nearly 50% between 2014 and 2018. However, whereas first-time homebuyers represent just over 40% of GSE purchase loans, they make up 70% of the GNMA purchase market.
“That concentration is contributing to a more significant increase in early-stage delinquencies among GNMA loans, which saw 3.3% of loans delinquent six months after origination. That’s up 1.2 percentage points from two years ago, and though still roughly half the 2000-2005 pre-crisis average, it represents the sharpest increase we’ve seen in the market in recent years. However, performance among repeat purchasers with GNMA-securitized loans has remained relatively steady overall, with the rise more pronounced among first-time homebuyers. Rising debt-to-income ratios due to tight affordability and declining first-time homebuyer credit scores stand out as likely drivers here. With a growing population of first-time homebuyers poised to enter the market, this is a trend Black Knight will continue to monitor.”
emphasis added
 Click on graph for larger image.
Here is a graph from the Mortgage Monitor that shows the Foreclosure Sales over time.
From Black Knight:
• Foreclosure sales (completions) are down 14% year-over-year, and have now set new record lows in each of the past five quartersThe second graph shows early stage delinquencies:
• The 35.7K foreclosure sales in Q3 are nearly 50% below the pre-recession (2000-2005) average
• Florida, New York and Illinois led all states with 3.2K, 2.5K and 2.4K foreclosure completions respectively in Q3
• Despite having the largest number of foreclosure sales, Florida's sale activity declined by 19% from the year prior, while in New York, sales actually edged slightly upward year-over-year (+4% Y/Y)

• Early-stage delinquencies among recent originations continue to trend upwardThere is much more in the mortgage monitor.
• Nearly 1% of Q1 2019 originations were delinquent six months post-origination; though less than a third of 2000-2005 average of 2.93%, that’s up more than 60% over the past 24 months and the highest since 2010
• This increase has primarily been driven by a rise in early-stage delinquencies among purchase loans, and to a lesser degree by cash-out refinances
• While performance of rate/term refinances has remained relatively flat, early-stage delinquencies among cash-out refis – though lower than the market as a whole – have also moved upward in recent years
• Should the rise in delinquencies among more recent originations continue, we may ultimately see an increase in overall delinquency rates
Sunday, November 03, 2019
Sunday Night Futures
by Calculated Risk on 11/03/2019 07:40:00 PM
Weekend:
• Schedule for Week of November 3, 2019
Monday:
• All day, Light vehicle sales for October.
From CNBC: Pre-Market Data and Bloomberg futures: S&P 500 are up 3 and DOW futures are up 25 (fair value).
Oil prices were down over the last week with WTI futures at $56.11 per barrel and Brent at $61.59 barrel. A year ago, WTI was at $63, and Brent was at $73 - so oil prices are down about 15% year-over-year.
Here is a graph from Gasbuddy.com for nationwide gasoline prices. Nationally prices are at $2.59 per gallon. A year ago prices were at $2.73 per gallon, so gasoline prices are down 14 cents year-over-year.
Hotels: Occupancy Rate Decreased Year-over-year, RevPAR upcycle Near End
by Calculated Risk on 11/03/2019 10:37:00 AM
From Jan Freitag at HotelNewsNow.com: US hotels post RevPAR losses for second month in 2019
The RevPAR upcycle is now in its 115th month, and 112 of those months had positive RevPAR change. So, I wonder if it’s time to retire the term “upcycle” if RevPAR is declining, as it did in September. The long-run monthly RevPAR growth chart now looks like this, but the header needs a qualifier (“three small interruptions”) and so it may be time to come up with a better descriptor.From HotelNewsNow.com: STR: US hotel results for week ending 26 October
The U.S. hotel industry reported overall flat year-over-year results in the three key performance metrics during the week of 20-26 October 2019, according to data from STR.The following graph shows the seasonal pattern for the hotel occupancy rate using the four week average.
In comparison with the week of 21-27 October 2018, the industry recorded the following:
• Occupancy: -0.2% to 70.5%
• Average daily rate (ADR): +0.2% to US$135.00
• Revenue per available room (RevPAR): flat at US$95.15
emphasis added
 Click on graph for larger image.
The red line is for 2019, dash light blue is 2018 (record year), blue is the median, and black is for 2009 (the worst year probably since the Great Depression for hotels).
Occupancy has been solid in 2019, and close to-date compared to the previous 4 years.
However occupancy will be lower this year than in 2018 (the record year).
Seasonally, the 4-week average of the occupancy rate will now start to decline into the winter.
Data Source: STR, Courtesy of HotelNewsNow.com
Saturday, November 02, 2019
Schedule for Week of November 3, 2019
by Calculated Risk on 11/02/2019 08:11:00 AM
The key reports this week are October vehicle sales, and the September trade deficit.
 All day: Light vehicle sales for October.
The consensus is for sales of 17.0 million SAAR, down from 17.2 million SAAR in September (Seasonally Adjusted Annual Rate).
This graph shows light vehicle sales since the BEA started keeping data in 1967. The dashed line is the current sales rate.
 8:30 AM: Trade Balance report for September from the Census Bureau. The consensus is for the deficit to be $52.5 billion in September, from $54.9 billion in August.
This graph shows the U.S. trade deficit, with and without petroleum, through the most recent report. The blue line is the total deficit, and the black line is the petroleum deficit, and the red line is the trade deficit ex-petroleum products.
10:00 AM: the ISM non-Manufacturing Index for October. The consensus is for an increase to 53.5 from 52.6.
 10:00 AM ET: Job Openings and Labor Turnover Survey for September from the BLS.
 This graph shows job openings (yellow line), hires (purple), Layoff, Discharges and other (red column), and Quits (light blue column) from the JOLTS.
Jobs openings decreased in August to 7.051 million from 7.174 million in July.
7:00 AM ET: The Mortgage Bankers Association (MBA) will release the results for the mortgage purchase applications index.
8:30 AM: The initial weekly unemployment claims report will be released. The consensus is for 215,000 initial claims, down from 218,000 last week.
10:00 AM: University of Michigan's Consumer sentiment index (Preliminary for November).


