by Calculated Risk on 11/20/2019 07:00:00 AM
Wednesday, November 20, 2019
MBA: Mortgage Applications Decreased in Latest Weekly Survey
From the MBA: Mortgage Applications Decrease in Latest MBA Weekly Survey
Mortgage applications decreased 2.2 percent from one week earlier, according to data from the Mortgage Bankers Association’s (MBA) Weekly Mortgage Applications Survey for the week ending November 15, 2019. This week’s results include an adjustment for the Veterans Day holiday.
... The Refinance Index decreased 8 percent from the previous week and was 152 percent higher than the same week one year ago. The seasonally adjusted Purchase Index increased 7 percent from one week earlier. The unadjusted Purchase Index decreased 8 percent compared with the previous week and was 7 percent higher than the same week one year ago.
...
“U.S. and China trade anxieties and protests in Hong Kong pulled U.S. Treasuries lower last week, and the 30-year fixed mortgage rate followed the same path, dipping below 4 percent,” said Joel Kan, MBA’s Associate Vice President of Economic and Industry Forecasting. “Despite lower rates, mortgage applications decreased 2.2 percent, driven by an 8 percent slide in refinance activity. Rates have stayed in the same narrow range of around 4 percent since July, so we may be starting to see the expected slowdown in refinancing as the pool of eligible homeowners shrinks.”
Added Kan, “Purchase applications were 7 percent higher than a year ago, which adds another solid data point to the recent increases in new home sales and housing starts. There may be signs that housing inventory is starting to meaningfully rise, which will help with affordability and provide more choices for potential homebuyers.”
...
The average contract interest rate for 30-year fixed-rate mortgages with conforming loan balances ($484,350 or less) decreased to 3.99 percent from 4.03 percent, with points increasing to 0.33 from 0.31 (including the origination fee) for 80 percent loan-to-value ratio (LTV) loans.
emphasis added
 Click on graph for larger image.
The first graph shows the refinance index since 1990.
With lower rates, we saw a sharp increase in refinance activity, but mortgage rates would have to decline further to see a huge refinance boom.
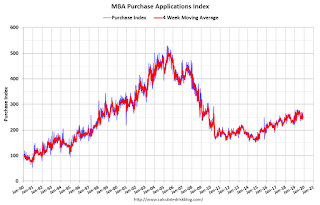
 The second graph shows the MBA mortgage purchase index
According to the MBA, purchase activity is up 7% year-over-year.
Tuesday, November 19, 2019
Wednesday: FOMC Minutes
by Calculated Risk on 11/19/2019 06:46:00 PM
Wednesday:
• At 7:00 AM ET, The Mortgage Bankers Association (MBA) will release the results for the mortgage purchase applications index.
• During the day, The AIA's Architecture Billings Index for October (a leading indicator for commercial real estate).
• At 2:00 PM, FOMC Minutes, Meeting of October 29-30, 2019
Phoenix Real Estate in October: Sales up 9.3% YoY, Active Inventory Down 20.7% YoY
by Calculated Risk on 11/19/2019 04:49:00 PM
This is a key housing market to follow since Phoenix saw a large bubble / bust followed by strong investor buying.
The Arizona Regional Multiple Listing Service (ARMLS) reports ("Stats Report"):
1) Overall sales were at 7,848 in October, from 7,850 in September, and up from 7,182 in October 2018. Sales were essentially unchanged from September 2019 (last month), and up 9.3% from October 2018.
2) Active inventory was at 14,427, down from 18,193 in October 2018. That is down 20.7% year-over-year.
3) Months of supply increased to 2.35 months in October from 2.27 months in September. This is low.
This is another market with increasing sales and falling inventory.
Sacramento Housing in October: Sales Up 7.1% YoY, Active Inventory DOWN 25% YoY
by Calculated Risk on 11/19/2019 02:03:00 PM
From SacRealtor.org: Sales volume jumps for October, prices remain flat
October saw a 10.6% increase in sales volume, jumping from 1,393 in September to 1,540 units this month. Compared to one year ago (1,438), the current figure is up 7.1%.1) Overall sales increased to 1,540 in October, up from 1,438 in October 2018. Sales were up 10.6% from September 2019 (previous month), and up 7.1% from October 2018.
...
The Active Listing Inventory decreased from 2,457 to 2,301 units. The Months of Inventory decreased from 1.8 to 1.5 Months. This figure represents the amount of time (in months) it would take for the current rate of sales to deplete the total active listing inventory. [Note: Compared to October 2018, inventory is down 24.1%] .
...
The Median DOM (days on market) increased from at 12 to 14 and the Average DOM increased from 25 to 28. “Days on market” represents the days between the initial listing of the home as “active” and the day it goes “pending.” Of the 1,540 sales this month, 71% (1,094) were on the market for 30 days or less and 86.6% (1,335) were on the market for 60 days or less.
emphasis added
2) Active inventory was at 2,301, down from 3,060 in October 2018. That is down 24.8% year-over-year. This is the sixth consecutive YoY decline following 20 months of YoY increases in inventory.
BLS: October Unemployment rates at New Series Lows in Alabama, California, Maine and South Carolina
by Calculated Risk on 11/19/2019 12:18:00 PM
From the BLS: Regional and State Employment and Unemployment Summary
Unemployment rates were lower in October in 4 states, higher in 2 states, and stable in 44 states and the District of Columbia, the U.S. Bureau of Labor Statistics reported today. Eight states had jobless rate decreases from a year earlier, 3 states had increases, and 39 states and the District had little or no change. The national unemployment rate, 3.6 percent, was little changed over the month and from October 2018.
...
Vermont had the lowest unemployment rate in October, 2.2 percent. The rates in Alabama (2.8 percent), California (3.9 percent), Maine (2.8 percent), and South Carolina (2.6 percent) set new series lows. (All state series begin in 1976.) Alaska had the highest jobless rate, 6.2 percent.
emphasis added
 Click on graph for larger image.
This graph shows the number of states (and D.C.) with unemployment rates at or above certain levels since January 1976.
At the worst of the great recession, there were 11 states with an unemployment rate at or above 11% (red).
Currently only one state, Alaska, has an unemployment rate at or above 6% (dark blue). Note that Alaska is at a series low (since 1976). Two states and the D.C. have unemployment rates above 5%; Alaska and Mississippi.
A total of nine states are at a series low: Alabama, Alaska, California, Colorado, Georgia, Illinois, Maine, South Carolina, and Texas.
Comments on October Housing Starts
by Calculated Risk on 11/19/2019 09:45:00 AM
Earlier: Housing Starts increased to 1.314 Million Annual Rate in October
Total housing starts in October were at expectations and revisions to prior months were minor.
The housing starts report showed starts were up 3.8% in October compared to September, and starts were up 8.5% year-over-year compared to October 2018.
Single family starts were up 8.2% year-over-year, and multi-family starts were up 10.7% YoY.
This first graph shows the month to month comparison for total starts between 2018 (blue) and 2019 (red).

Starts were up 3.8% in October compared to October 2018.
Year-to-date, starts are down 0.6% compared to the same period in 2018.
Last year, in 2018, starts were strong early in the year, and then fell off in the 2nd half - so the comparisons in November and December will be easy.
My guess was starts would be down slightly year-over-year in 2019 compared to 2018, but nothing like the YoY declines we saw in February and March. Now it seems likely starts will be up in 2019 compared to 2018.
Below is an update to the graph comparing multi-family starts and completions. Since it usually takes over a year on average to complete a multi-family project, there is a lag between multi-family starts and completions. Completions are important because that is new supply added to the market, and starts are important because that is future new supply (units under construction is also important for employment).
These graphs use a 12 month rolling total for NSA starts and completions.

The rolling 12 month total for starts (blue line) increased steadily for several years following the great recession - but turned down, and has moved sideways recently. Completions (red line) had lagged behind - then completions caught up with starts.
As I've been noting for several years, the significant growth in multi-family starts is behind us - multi-family starts peaked in June 2015 (at 510 thousand SAAR).

Note the relatively low level of single family starts and completions. The "wide bottom" was what I was forecasting following the recession, and now I expect some further increases in single family starts and completions.
Housing Starts increased to 1.314 Million Annual Rate in October
by Calculated Risk on 11/19/2019 08:38:00 AM
From the Census Bureau: Permits, Starts and Completions
Housing Starts:
Privately‐owned housing starts in October were at a seasonally adjusted annual rate of 1,314,000. This is 3.8 percent above the revised September estimate of 1,266,000 and is 8.5 percent above the October 2018 rate of 1,211,000. Single‐family housing starts in October were at a rate of 936,000; this is 2.0 percent above the revised September figure of 918,000. The October rate for units in buildings with five units or more was 362,000.
Building Permits:
Privately‐owned housing units authorized by building permits in October were at a seasonally adjusted annual rate of 1,461,000. This is 5.0 percent above the revised September rate of 1,391,000 and is 14.1 percent above the October 2018 rate of 1,281,000. Single‐family authorizations in October were at a rate of 909,000; this is 3.2 percent above the revised September figure of 881,000. Authorizations of units in buildings with five units or more were at a rate of 505,000 in October.
emphasis added
 Click on graph for larger image.
The first graph shows single and multi-family housing starts for the last several years.
Multi-family starts (red, 2+ units) were up in October compared to September. Multi-family starts were up 10.7% year-over-year in October.
Multi-family is volatile month-to-month, and has been mostly moving sideways the last several years.
Single-family starts (blue) increased in October, and were up 8.2% year-over-year.
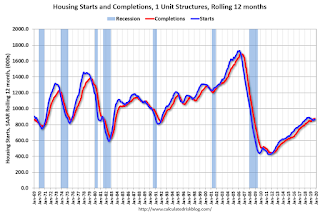
 The second graph shows total and single unit starts since 1968.
 The second graph shows the huge collapse following the housing bubble, and then eventual recovery (but still historically low).
Total housing starts in October were close to expectations and revisions were minor.
I'll have more later …
Monday, November 18, 2019
Tuesday: Housing Starts
by Calculated Risk on 11/18/2019 06:48:00 PM
From Matthew Graham at Mortgage News Daily: Lowest Mortgage Rates in 2 Weeks
Mortgage rates added to last week's improvement with another modest drop today. That brings the average lender to the best levels in exactly 2 weeks--a welcome change after hitting the highest levels in more than 3 months on Friday November 8th. [Most Prevalent Rates For Top Tier Scenarios 30YR FIXED 3.75-3.875%]Tuesday:
emphasis added
• At 8:30 AM, Housing Starts for October. The consensus is for 1.320 million SAAR, up from 1.256 million SAAR.
• At 10:00 AM, State Employment and Unemployment (Monthly) for October 2019
Lawler: Early Read on Existing Home Sales in October
by Calculated Risk on 11/18/2019 04:00:00 PM
From housing economist Tom Lawler: Early Read on Existing Home Sales in October
Based on publicly-available local realtor/MLS reports released across the country through today, I project that existing home sales as estimated by the National Association of Realtors ran at a seasonally adjusted annual rate of 5.36 million in October, down 0.4% from September’s preliminary pace but up 2.7% from last October’s seasonally adjusted pace.
On the inventory front, local realtor/MLS data, as well as data from other inventory trackers, suggest that the inventory of existing homes for sale at the end of October should be down by about 6.5% from a year earlier.
Finally, local realtor/MLS data suggest that the median US existing single-family home sales price last month was up by about 5.6% from last October.
CR Note: The National Association of Realtors (NAR) is scheduled to release October existing home sales on Thursday, November 21st at 10:00 AM ET. The consensus is for 5.49 million SAAR.
Mortgage Rates and Ten Year Yield
by Calculated Risk on 11/18/2019 01:17:00 PM
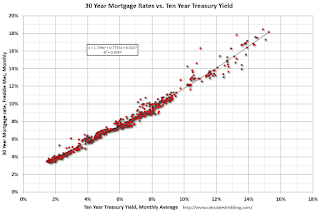
With the ten year yield at 1.81%, and based on an historical relationship, 30-year rates should currently be around 3.75%.
As of Friday, Mortgage News Daily reported: Much Better Week For Rates, But Bigger Picture Risks Remain
Mortgage rates finished the week in much better territory compared to last Friday. Today only added modestly to that move, but the simple act of moving in a friendly direction feels like a major victory after coming toe to toe with the highest rates in more than 3 months (last week). [30YR FIXED - 3.75-3.875%]The graph shows the relationship between the monthly 10 year Treasury Yield and 30 year mortgage rates from the Freddie Mac survey.
emphasis added
 Currently the 10 year Treasury yield is at 1.81%, and 30 year mortgage rates were at 3.75% according to the Freddie Mac survey last week - about as expected.
The record low in the Freddie Mac survey was 3.31% in November 2012 (Survey started in 1971).
To fall to 3.31% on the Freddie Mac survey, and based on the historical relationship, the Ten Year yield would have to fall to around 1.4% (but there is some variability in the relationship).


