by Calculated Risk on 1/27/2020 04:34:00 PM
Monday, January 27, 2020
Freddie Mac: Mortgage Serious Delinquency Rate increased slightly in December
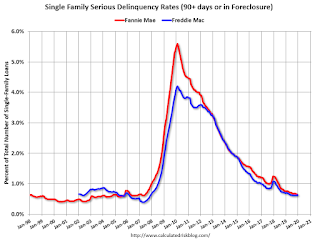
Freddie Mac reported that the Single-Family serious delinquency rate in December was 0.63%, up from 0.62% in November. Freddie's rate is down from 0.69% in December 2018.
Freddie's serious delinquency rate peaked in February 2010 at 4.20%.
These are mortgage loans that are "three monthly payments or more past due or in foreclosure".

I expect the delinquency rate to decline to a cycle bottom in the 0.4% to 0.6% range - so this is close to a bottom.
Note: Fannie Mae will report for December soon.
New Home Prices
by Calculated Risk on 1/27/2020 03:12:00 PM
As part of the new home sales report released today, the Census Bureau reported the number of homes sold by price and the average and median prices.
From the Census Bureau: "The median sales price of new houses sold in December 2019 was $331,400. The average sales price was $384,500."
The following graph shows the median and average new home prices.

During the housing bust, the builders had to build smaller and less expensive homes to compete with all the distressed sales. When housing started to recovery - with limited finished lots in recovering areas - builders moved to higher price points to maximize profits.
Now it appears the home builders are offering some less expensive (and probably smaller) homes.
The average price in December 2019 was $384,500, and the median price was $311,400.
The second graph shows the percent of new homes sold by price.

The $400K+ bracket increased significantly since the housing recovery started, but has been holding steady recently. Still, a majority of new homes (about 57%) in the U.S., are in the $200K to $400K range.
A few Comments on December New Home Sales
by Calculated Risk on 1/27/2020 11:26:00 AM
New home sales for December were reported at 694,000 on a seasonally adjusted annual rate basis (SAAR). Sales for the previous three months were revised down.
Annual sales in 2019 were at 681,000, up 10.3% from annual sales in 2018, and the best year for new home sales since 2007. This was well above analysts forecast for sales in 2019, and the growth mostly happened in the second half of the year.
Earlier: New Home Sales at 694,000 Annual Rate in December.

This graph shows new home sales for 2018 and 2019 by month (Seasonally Adjusted Annual Rate).
The year-over-year comparison was easy in December, and sales in December were up 23.0% year-over-year compared to December 2018.
Note that the comparisons will be fairly easy for the first five months of 2020, but will be more difficult in the second half of the year.
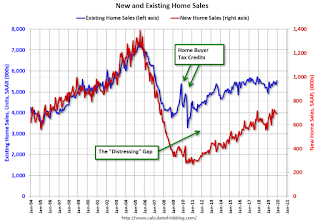
And here is another update to the "distressing gap" graph that I first started posting a number of years ago to show the emerging gap caused by distressed sales.

Following the housing bubble and bust, the "distressing gap" appeared mostly because of distressed sales.
Even though distressed sales are down significantly, following the bust, new home builders focused on more expensive homes - so the gap closed slowly.
Now the gap is mostly closed, and I expect it to close a little more. However, this assumes that the builders will offer some smaller, less expensive homes.
Note: Existing home sales are counted when transactions are closed, and new home sales are counted when contracts are signed. So the timing of sales is different.
Dallas Fed: "Growth in Texas Manufacturing Activity Picks Up"
by Calculated Risk on 1/27/2020 10:38:00 AM
From the Dallas Fed: Growth in Texas Manufacturing Activity Picks Up
Growth in Texas factory activity accelerated in January, according to business executives responding to the Texas Manufacturing Outlook Survey. The production index, a key measure of state manufacturing conditions, rose seven points to 10.5, suggesting stronger output growth than last month.This was another weak regional report for January with the General business activity index at zero. The last of the regional Fed surveys for January will be released tomorrow (Richmond Fed).
Other measures of manufacturing activity also pointed to an acceleration in January. The new orders index shot up 16 points to 17.6, its highest reading in 15 months. The growth rate of orders index returned to positive territory, rising from -5.0 to 6.1. The capacity utilization and shipments indexes pushed further positive, coming in at 11.5 and 8.6, respectively.
Perceptions of broader business conditions were largely unchanged in January. The general business activity index came in at zero, with three-fourths of respondents noting no change this month and the rest split between improved and worsened activity.
Labor market measures suggested slower employment growth and no change in workweek length this month. The employment index retreated from 6.2 to 1.9, indicative of an abatement in hiring. Sixteen percent of firms noted net hiring, while 14 percent noted net layoffs. The hours worked index came in at zero.
emphasis added
New Home Sales at 694,000 Annual Rate in December
by Calculated Risk on 1/27/2020 10:14:00 AM
The Census Bureau reports New Home Sales in December were at a seasonally adjusted annual rate (SAAR) of 694 thousand.
The previous three months were revised down, combined.
"Sales of new single‐family houses in December 2019 were at a seasonally adjusted annual rate of 694,000, according to estimates released jointly today by the U.S. Census Bureau and the Department of Housing and Urban Development. This is 0.4 percent below the revised November rate of 697,000, but is 23.0 percent above the December 2018 estimate of 564,000.
An estimated 681,000 new homes were sold in 2019. This is 10.3 percent above the 2018 figure of 617,000. "
emphasis added
 Click on graph for larger image.
The first graph shows New Home Sales vs. recessions since 1963. The dashed line is the current sales rate.
Even with the increase in sales over the last several years, new home sales are still somewhat low historically.
The second graph shows New Home Months of Supply.
 The months of supply increased in December to 5.7 months from 5.5 months in November.
 The all time record was 12.1 months of supply in January 2009.
This is in the normal range (less than 6 months supply is normal).
"The seasonally‐adjusted estimate of new houses for sale at the end of December was 327,000. This represents a supply of 5.7 months at the current sales rate."
 On inventory, according to the Census Bureau:
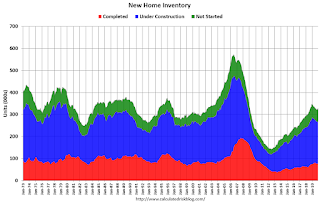
 "A house is considered for sale when a permit to build has been issued in permit-issuing places or work has begun on the footings or foundation in nonpermit areas and a sales contract has not been signed nor a deposit accepted."Starting in 1973 the Census Bureau broke this down into three categories: Not Started, Under Construction, and Completed.
The third graph shows the three categories of inventory starting in 1973.
The inventory of completed homes for sale is still somewhat low, and the combined total of completed and under construction is close to normal.
 The last graph shows sales NSA (monthly sales, not seasonally adjusted annual rate).
In December 2019 (red column), 47 thousand new homes were sold (NSA). Last year, 38 thousand homes were sold in December.
The all time high for December was 87 thousand in 2005, and the all time low for December was 23 thousand in both 1966 and 2010.
This was below expectations of 730 thousand sales SAAR, and sales in the three previous months were revised down, combined. However this was still solid with sales up 23% year-over-year. I'll have more later today.
Sunday, January 26, 2020
Monday: New Home Sales
by Calculated Risk on 1/26/2020 08:04:00 PM
Weekend:
• Schedule for Week of January 26, 2020
Monday:
• At 10:00 AM ET, New Home Sales for December from the Census Bureau. The consensus is for 730 thousand SAAR, up from 719 thousand in November.
• At 10:30 AM, Dallas Fed Survey of Manufacturing Activity for January.
From CNBC: Pre-Market Data and Bloomberg futures: S&P 500 are down 49 and DOW futures are down 235 (fair value).
Oil prices were down over the last week with WTI futures at $52.87 per barrel and Brent at $59.40 barrel. A year ago, WTI was at $52, and Brent was at $59 - so oil prices are mostly unchanged year-over-year.
Here is a graph from Gasbuddy.com for nationwide gasoline prices. Nationally prices are at $2.51 per gallon. A year ago prices were at $2.26 per gallon, so gasoline prices are up 25 cents per gallon year-over-year.
FOMC Preview
by Calculated Risk on 1/26/2020 12:09:00 PM
Expectations are there will be no change to policy when the FOMC meets this week. Also there should be minimal changes to the FOMC statement, and Fed Chair Powell will mostly repeat his comments from the December meeting.
There should be no surprises.
Here are some comments from Goldman Sachs chief economist Jan Hatzius and economist David Choi:
"The FOMC is set to keep the target range for the funds rate on hold at 1.5-1.75% at the January meeting ... We expect minimal changes to the statement, and for the policy guidance section to remain unchanged. … Economic conditions have changed little on net since the FOMC met in December, while financial conditions have eased significantly further. … Beyond the January meeting, we see a high bar for policy moves in either direction, and we expect the funds rate to remain unchanged in 2020.”For review, here are the December FOMC projections. In general the data has been close to expectations, suggesting no change in policy at this meeting.
Q1 2019 real GDP growth was at 3.1% annualized, Q2 at 2.0% and Q3 at 2.1%. Currently the consensus is for 2.1% in Q4. So 2019 was about as expected.
| GDP projections of Federal Reserve Governors and Reserve Bank presidents | ||||
|---|---|---|---|---|
| Change in Real GDP1 | 2019 | 2020 | 2021 | 2022 |
| Dec 2019 | 2.1 to 2.2 | 2.0 to 2.2 | 1.8 to 2.0 | 1.8 to 2.0 |
| Sept 2019 | 2.1 to 2.3 | 1.8 to 2.1 | 1.8 to 2.0 | NA |
The unemployment rate was at 3.5% in December. So the unemployment rate projection for Q4 2019 was correct. Note: My guess is the unemployment rate will decrease further in 2020, and I expect the FOMC to revised down unemployment projections for 2020 later this year.
| Unemployment projections of Federal Reserve Governors and Reserve Bank presidents | ||||
|---|---|---|---|---|
| Unemployment Rate2 | 2019 | 2020 | 2021 | 2022 |
| Dec 2019 | 3.5 to 3.6 | 3.5 to 3.7 | 3.5 to 3.9 | 3.5 to 4.0 |
| Sept 2019 | 3.6 to 3.7 | 3.6 to 3.8 | 3.6 to 3.9 | NA |
As of November 2019, PCE inflation was up 1.5% from November 2018 So PCE inflation projections were close.
| Inflation projections of Federal Reserve Governors and Reserve Bank presidents | ||||
|---|---|---|---|---|
| PCE Inflation1 | 2019 | 2020 | 2021 | 2022 |
| Dec 2019 | 1.4 to 1.5 | 1.8 to 1.9 | 2.0 to 2.1 | 2.0 to 2.2 |
| Sept 2019 | 1.5 to 1.6 | 1.9 to 2.0 | 2.0 | NA |
PCE core inflation was up 1.6% in November year-over-year. So Core PCE inflation was revised also close to expectations.
| Core Inflation projections of Federal Reserve Governors and Reserve Bank presidents | ||||
|---|---|---|---|---|
| Core Inflation1 | 2019 | 2020 | 2021 | 2022 |
| Dec 2019 | 1.6 to 1.7 | 1.9 to 2.0 | 2.0 to 2.1 | 2.0 to 2.2 |
| Sept 2019 | 1.7 to 1.8 | 1.9 to 2.0 | 2.0 | NA |
Saturday, January 25, 2020
Schedule for Week of January 26, 2020
by Calculated Risk on 1/25/2020 08:11:00 AM
The key reports scheduled for this week are the advance estimate of Q4 GDP and December New Home sales. Other key indicators include December Personal Income and Outlays and November Case-Shiller house prices.
For manufacturing, the Dallas and Richmond Fed manufacturing surveys will be released.
The FOMC meets this week, and no change to policy is expected at this meeting.
 10:00 AM: New Home Sales for December from the Census Bureau.
 This graph shows New Home Sales since 1963.
The dashed line is the sales rate for last month.
The consensus is for 730 thousand SAAR, up from 719 thousand in November.
10:30 AM: Dallas Fed Survey of Manufacturing Activity for January.
8:30 AM: Durable Goods Orders for December. The consensus is for a 0.5% increase in durable goods.
 9:00 AM ET: S&P/Case-Shiller House Price Index for December.
This graph shows the Year over year change in the nominal seasonally adjusted National Index, Composite 10 and Composite 20 indexes through the most recent report (the Composite 20 was started in January 2000).
The consensus is for a 2.4% year-over-year increase in the Comp 20 index for December.
10:30 AM: Richmond Fed Survey of Manufacturing Activity for January. This is the last of regional manufacturing surveys for January.
7:00 AM ET: The Mortgage Bankers Association (MBA) will release the results for the mortgage purchase applications index.
10:00 AM: Pending Home Sales Index for December. The consensus is for a 0.5% increase in the index.
2:00 PM: FOMC Meeting Announcement. No change to policy is expected at this meeting.
2:30 PM: Fed Chair Jerome Powell holds a press briefing following the FOMC announcement.
8:30 AM: The initial weekly unemployment claims report will be released. The consensus is for 215,000 initial claims, up from 211,000 last week.
8:30 AM: Gross Domestic Product, 4th quarter 2019 (Advance estimate). The consensus is that real GDP increased 2.1% annualized in Q4, the same as in Q3.
10:00 AM: the Q4 2019 Housing Vacancies and Homeownership from the Census Bureau.
8:30 AM ET: Personal Income and Outlays for December. The consensus is for a 0.3% increase in personal income, and for a 0.3% increase in personal spending. And for the Core PCE price index to increase 0.1%.
9:45 AM: Chicago Purchasing Managers Index for January. The consensus is for a reading of 48.5, up from 48.2 in December.
10:00 AM: University of Michigan's Consumer sentiment index (Final for January). The consensus is for a reading of 99.1.
Friday, January 24, 2020
Q4 GDP Forecasts: 1.2% to 2.2%
by Calculated Risk on 1/24/2020 12:49:00 PM
The preliminary estimate of Q4 GDP will be released on Thursday, January 30th. The consensus is that annualized real GDP increased 2.2% in Q4.
From Merrill Lynch
We expect GDP growth in 4Q to hold steady at 2.0% qoq saar. [Jan 24 estimate]From the NY Fed Nowcasting Report
emphasis added
The New York Fed Staff Nowcast stands at 1.2% for 2019:Q4 and 1.7% for 2020:Q1. [Jan 24 estimate]And from the Altanta Fed: GDPNow
The GDPNow model estimate for real GDP growth (seasonally adjusted annual rate) in the fourth quarter of 2019 is 1.8 percent on January 17. [Jan 17 estimate]CR Note: These estimates suggest real GDP growth will be between 1.2% and 2.2% annualized in Q4.
BLS: December Unemployment rates at New Series Lows in Eight States
by Calculated Risk on 1/24/2020 10:52:00 AM
From the BLS: Regional and State Employment and Unemployment Summary
Unemployment rates were lower in December in 11 states, higher in 4 states, and stable in 35 states and the District of Columbia, the U.S. Bureau of Labor Statistics reported today. Eight states had jobless rate decreases from a year earlier, 1 state had an increase, and 41 states and the District had little or no change. The national unemployment rate, 3.5 percent, was unchanged over the month but was 0.4 percentage point lower than in December 2018.
...
South Carolina, Utah, and Vermont had the lowest unemployment rates in December, 2.3 percent each. The rates in Colorado (2.5 percent), Florida (3.0 percent), Georgia (3.2 percent), Illinois (3.7 percent), Oregon (3.7 percent), South Carolina (2.3 percent), Utah (2.3 percent), and Washington (4.3 percent) set new series lows. (All state series begin in 1976.) Alaska had the highest jobless rate, 6.1 percent.
emphasis added
 Click on graph for larger image.
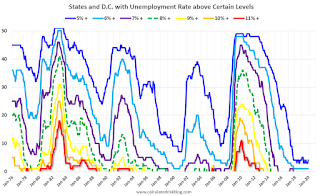
This graph shows the number of states (and D.C.) with unemployment rates at or above certain levels since January 1976.
At the worst of the great recession, there were 11 states with an unemployment rate at or above 11% (red).
Currently only one state, Alaska, has an unemployment rate at or above 6% (dark blue). Note that Alaska is at a series low (since 1976). Three states and the D.C. have unemployment rates above 5%; Alaska, Mississippi and West Virginia.
A total of twelve states are at a series low: Alabama, Alaska, California, Colorado, Florida, Georgia, Illinois, Nevada, Oregon, South Carolina, Utah and Washington.


