by Calculated Risk on 1/29/2020 07:22:00 PM
Wednesday, January 29, 2020
Thursday: GDP, Unemployment Claims
Thursday:
• At 8:30 AM ET, The initial weekly unemployment claims report will be released. The consensus is for 215,000 initial claims, up from 211,000 last week.
• At 8:30 AM, Gross Domestic Product, 4th quarter 2019 (Advance estimate). The consensus is that real GDP increased 2.1% annualized in Q4, the same as in Q3.
• At 10:00 AM, the Q4 2019 Housing Vacancies and Homeownership from the Census Bureau.
Zillow Case-Shiller Forecast: House Price Gains "Primed for an Upswing"
by Calculated Risk on 1/29/2020 04:40:00 PM
The Case-Shiller house price indexes for November were released yesterday. Zillow forecasts Case-Shiller a month early, and I like to check the Zillow forecasts since they have been pretty close.
From Matthew Speakman at Zillow: November Case-Shiller Results and December Forecast: Primed for an Upswing
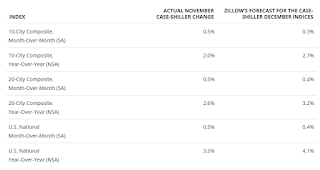
The S&P CoreLogic Case-Shiller U.S. National Home Price Index® rose 3.5% year-over-year in November (non-seasonally adjusted), up from 3.2% in October. Annual growth was also up from September in the smaller 10-city index (to 2%, from 1.7%) and in the 20-city index (to 2.6%, from 2.2%).
...
After a yearlong slowdown in 2019, home values appear primed to go back on the upswing to start 2020.
The main driver in this acceleration is clearly the ongoing and historic lack of for-sale inventory, though a strong job market, stabilizing geopolitical tensions and still-low mortgage rates have played their part. Even taking seasonal factors into consideration, the number of homes available for sale fell consistently through the latter part of 2019 and now sits near the lowest level on record. This lack of homes has made competition among buyers — buoyed by otherwise favorable economic conditions — even more fierce, in turn helping to push up prices even faster. Indeed, homebuying activity has picked up in recent months, with sales of existing homes reaching their highest level in nearly two years in December.
emphasis added
 The Zillow forecast is for the year-over-year change for the Case-Shiller National index to be at 4.1% in December, up from 3.5% in December.
 The Zillow forecast is for the 20-City index to be up 3.2% YoY in December from 2.6% in November, and for the 10-City index to increase to 2.7% YoY compared to 2.0% YoY in November.
FOMC Statement: No Change to Policy
by Calculated Risk on 1/29/2020 02:01:00 PM
Information received since the Federal Open Market Committee met in December indicates that the labor market remains strong and that economic activity has been rising at a moderate rate. Job gains have been solid, on average, in recent months, and the unemployment rate has remained low. Although household spending has been rising at a moderate pace, business fixed investment and exports remain weak. On a 12‑month basis, overall inflation and inflation for items other than food and energy are running below 2 percent. Market-based measures of inflation compensation remain low; survey-based measures of longer-term inflation expectations are little changed.
Consistent with its statutory mandate, the Committee seeks to foster maximum employment and price stability. The Committee decided to maintain the target range for the federal funds rate at 1‑1/2 to 1-3/4 percent. The Committee judges that the current stance of monetary policy is appropriate to support sustained expansion of economic activity, strong labor market conditions, and inflation returning to the Committee's symmetric 2 percent objective. The Committee will continue to monitor the implications of incoming information for the economic outlook, including global developments and muted inflation pressures, as it assesses the appropriate path of the target range for the federal funds rate.
In determining the timing and size of future adjustments to the target range for the federal funds rate, the Committee will assess realized and expected economic conditions relative to its maximum employment objective and its symmetric 2 percent inflation objective. This assessment will take into account a wide range of information, including measures of labor market conditions, indicators of inflation pressures and inflation expectations, and readings on financial and international developments.
Voting for the monetary policy action were Jerome H. Powell, Chair; John C. Williams, Vice Chair; Michelle W. Bowman; Lael Brainard; Richard H. Clarida; Patrick Harker; Robert S. Kaplan; Neel Kashkari; Loretta J. Mester; and Randal K. Quarles
emphasis added
Philly Fed: State Coincident Indexes increased in 37 states in December
by Calculated Risk on 1/29/2020 11:00:00 AM
From the Philly Fed:
The Federal Reserve Bank of Philadelphia has released the coincident indexes for the 50 states for December 2019. Over the past three months, the indexes increased in 39 states, decreased in eight states, and remained stable in three, for a threemonth diffusion index of 62. In the past month, the indexes increased in 37 states, decreased in nine states, and remained stable in four, for a one-month diffusion index of 56.Note: These are coincident indexes constructed from state employment data. An explanation from the Philly Fed:
emphasis added
The coincident indexes combine four state-level indicators to summarize current economic conditions in a single statistic. The four state-level variables in each coincident index are nonfarm payroll employment, average hours worked in manufacturing by production workers, the unemployment rate, and wage and salary disbursements deflated by the consumer price index (U.S. city average). The trend for each state’s index is set to the trend of its gross domestic product (GDP), so long-term growth in the state’s index matches long-term growth in its GDP.
 Click on map for larger image.
Here is a map of the three month change in the Philly Fed state coincident indicators. This map was all red during the worst of the recession, and all or mostly green during most of the recent expansion.
The map is mostly green on a three month basis, but there are some red and gray states.
Source: Philly Fed.
Note: For complaints about red / green issues, please contact the Philly Fed.
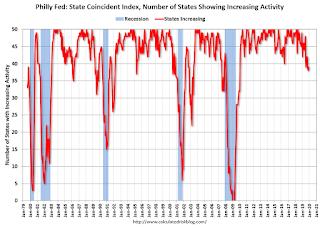
 And here is a graph is of the number of states with one month increasing activity according to the Philly Fed. This graph includes states with minor increases (the Philly Fed lists as unchanged).
In December, 39 states had increasing activity including states with minor increases.
NAR: "Pending Home Sales Skid 4.9% in December"
by Calculated Risk on 1/29/2020 10:03:00 AM
From the NAR: Pending Home Sales Skid 4.9% in December
Pending home sales fell in December, taking a step back after increasing slightly in November, according to the National Association of Realtors®. Each of the four major regions reported a drop in month-over-month contract activity, with the South experiencing the steepest fall. However, year-over-year pending home sales activity was up nationally compared to one year ago.This was well below expectations for this index. Note: Contract signings usually lead sales by about 45 to 60 days, so this would usually be for closed sales in January and February.
The Pending Home Sales Index (PHSI), a forward-looking indicator based on contract signings, fell 4.9% to 103.2 in December. Year-over-year contract signings increased 4.6%. An index of 100 is equal to the level of contract activity in 2001.
...
All regional indices were down in December. The Northeast PHSI slipped 4.0% to 92.4 in December, 0.1% lower than a year ago. In the Midwest, the index dropped 3.6% to 98.8 last month, 1.3% higher than in December 2018.
Pending home sales in the South decreased 5.5% to an index of 118.1 in December, a 7.4% increase from December 2018. The index in the West fell 5.4% in December 2019 to 93.1, an increase of 7.0% from a year ago.
emphasis added
MBA: Mortgage Applications Increased in Latest Weekly Survey
by Calculated Risk on 1/29/2020 07:00:00 AM
From the MBA: Mortgage Applications Increase in Latest MBA Weekly Survey
Mortgage applications increased 7.2 percent from one week earlier, according to data from the Mortgage Bankers Association’s (MBA) Weekly Mortgage Applications Survey for the week ending January 24, 2020. This week’s results include an adjustment for the Martin Luther King Jr. Holiday.
... The Refinance Index increased 8 percent from the previous week and was 146 percent higher than the same week one year ago. The seasonally adjusted Purchase Index increased 5 percent from one week earlier. The unadjusted Purchase Index increased 2 percent compared with the previous week and was 17 percent higher than the same week one year ago.
...
“Mortgage applications continued their strong start to the year, as borrowers acted on the drop in mortgage rates last week. Rates were driven lower by investors’ increased concern about the economic impact from China’s coronavirus outbreak, in addition to existing concerns over trade and other geo-political risks,” said Joel Kan, MBA’s Associate Vice President of Economic and Industry Forecasting. “With the 30-year fixed rate at its lowest level since November 2016, refinances jumped 7.5 percent. Purchase applications grew 2 percent and were more than 16 percent higher than the same week last year. Thanks to low rates and the healthy job market, purchase activity continues to run stronger than in 2019.”
...
The average contract interest rate for 30-year fixed-rate mortgages with conforming loan balances ($510,400 or less) decreased to 3.81 percent from 3.87 percent, with points increasing to 0.28 from 0.27 (including the origination fee) for 80 percent loan-to-value ratio (LTV) loans.
emphasis added
 Click on graph for larger image.
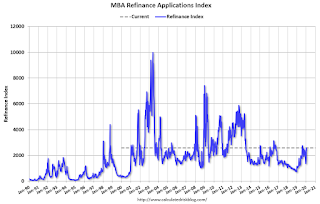
The first graph shows the refinance index since 1990.
With lower rates, we saw a sharp increase in refinance activity, but mortgage rates would have to decline further to see a huge refinance boom.
 The second graph shows the MBA mortgage purchase index
According to the MBA, purchase activity is up 17% year-over-year.
Tuesday, January 28, 2020
Wednesday: FOMC Statement and Press Conference, Pending Home Sales
by Calculated Risk on 1/28/2020 06:28:00 PM
Wednesday:
• At 7:00 AM ET, The Mortgage Bankers Association (MBA) will release the results for the mortgage purchase applications index.
• At 10:00 AM, Pending Home Sales Index for December. The consensus is for a 0.5% increase in the index.
• At 2:00 PM, FOMC Meeting Announcement. No change to policy is expected at this meeting.
• At 2:30 PM, Fed Chair Jerome Powell holds a press briefing following the FOMC announcement.
CBO Projection: Annual Budget Deficit to be above 4% GDP for the Next Decade
by Calculated Risk on 1/28/2020 03:57:00 PM
Remember the promise that the 2017 Tax Cuts and Jobs Act (TCJA) would "pay for itself", and that the current administration would reduce the deficit? Hoocoodanode? ("Who could have known?",Popularized by my former co-blogger Tanta!)
The Congressional Budget Office (CBO) released their new The Budget and Economic Outlook: 2020 to 2030
In CBO’s projections, the federal budget deficit is $1.0 trillion in 2020 and averages $1.3 trillion between 2021 and 2030. Projected deficits rise from 4.6 percent of gross domestic product (GDP) in 2020 to 5.4 percent in 2030.The CBO projects the deficit will above 4% for the next decade. I think their projections are optimistic.
Other than a six-year period during and immediately after World War II, the deficit over the past century has not exceeded 4.0 percent for more than five consecutive years. And during the past 50 years, deficits have averaged 1.5 percent of GDP when the economy was relatively strong (as it is now).
Because of the large deficits, federal debt held by the public is projected to grow, from 81 percent of GDP in 2020 to 98 percent in 2030 (its highest percentage since 1946). By 2050, debt would be 180 percent of GDP—far higher than it has ever been
emphasis added
 Click on graph for larger image.
This graph shows the actual (purple) budget deficit each year as a percent of GDP, and an estimate for the next ten years based on estimates from the CBO.
Note: the Federal government's deficit usually increases sharply during a recession - it is the only entity that can be countercyclical - and then decreases during an expansion. So no one should compare the deficit to 2008 (under Bush) or 2009 (under Obama) during the great recession.
From a policy perspective and using these projections, the TCJA was a policy failure on this issue (the TCJA was also a failure on GDP growth, business investment, and the typical tax cut for most Americans).
Update: A few comments on the Seasonal Pattern for House Prices
by Calculated Risk on 1/28/2020 12:53:00 PM
CR Note: This is a repeat of earlier posts with updated graphs.
A few key points:
1) There is a clear seasonal pattern for house prices.
2) The surge in distressed sales during the housing bust distorted the seasonal pattern.
3) Even though distressed sales are down significantly, the seasonal factor is based on several years of data - and the factor is now overstating the seasonal change (second graph below).
4) Still the seasonal index is probably a better indicator of actual price movements than the Not Seasonally Adjusted (NSA) index.
For in depth description of these issues, see former Trulia chief economist Jed Kolko's article "Let’s Improve, Not Ignore, Seasonal Adjustment of Housing Data"
Note: I was one of several people to question the change in the seasonal factor (here is a post in 2009) - and this led to S&P Case-Shiller questioning the seasonal factor too (from April 2010). I still use the seasonal factor (I think it is better than using the NSA data).

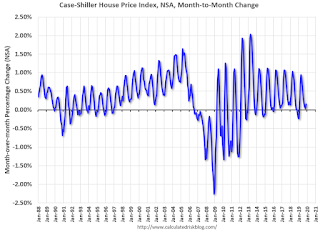
This graph shows the month-to-month change in the NSA Case-Shiller National index since 1987 (through November 2019). The seasonal pattern was smaller back in the '90s and early '00s, and increased once the bubble burst.
The seasonal swings have declined since the bubble.

The swings in the seasonal factors have started to decrease, and I expect that over the next several years - as recent history is included in the factors - the seasonal factors will move back towards more normal levels.
However, as Kolko noted, there will be a lag with the seasonal factor since it is based on several years of recent data.
Richmond Fed: Manufacturing Activity Rebounded in January
by Calculated Risk on 1/28/2020 10:41:00 AM
From the Richmond Fed: Manufacturing Activity Rebounded in January
Fifth District manufacturing activity rebounded in January, according to the most recent survey from the Richmond Fed. The composite index rose from −5 in December to 20 in January, as all three components— shipments, new orders, and employment— increased. Local business conditions also improved as this index saw its largest increase since February 2013. Manufacturers were optimistic that conditions would continue to strengthen in the coming monthsThis was the last of the regional Fed surveys for January.
Survey results indicate that both employment and wages rose for survey participants in January. However, firms continued to struggle to find workers with the necessary skills. They expected this difficulty to persist but wages and employment to continue to grow in the next six months.
emphasis added
Here is a graph comparing the regional Fed surveys and the ISM manufacturing index:
 Click on graph for larger image.
The New York and Philly Fed surveys are averaged together (yellow, through January), and five Fed surveys are averaged (blue, through January) including New York, Philly, Richmond, Dallas and Kansas City. The Institute for Supply Management (ISM) PMI (red) is through December (right axis).
Based on these regional surveys, it seems likely the ISM manufacturing index will show expansion in January after five consecutive months of contraction.


