by Calculated Risk on 1/31/2020 09:35:00 AM
Friday, January 31, 2020
Q4 2019 GDP Details on Residential and Commercial Real Estate
The BEA has released the underlying details for the Q4 initial GDP report this morning.
The BEA reported that investment in non-residential structures decreased at a 10.1% annual pace in Q4.
Investment in petroleum and natural gas exploration decreased in Q4 compared to Q3, and was down 19% year-over-year.

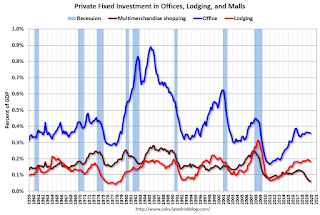
The first graph shows investment in offices, malls and lodging as a percent of GDP.
Investment in offices decreased in Q4, but was up 3% year-over-year.
Investment in multimerchandise shopping structures (malls) peaked in 2007 and was down about 32% year-over-year in Q4 - and at a record low as a percent of GDP. The vacancy rate for malls is still very high, so investment will probably stay low for some time.
Lodging investment decreased in Q4, but lodging investment was up 1% year-over-year.

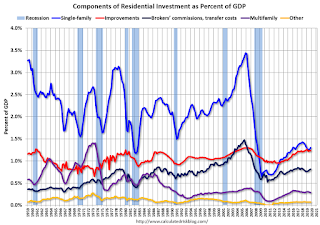
Usually single family investment is the top category, although home improvement was the top category for five consecutive years following the housing bust. Then investment in single family structures was back on top, however it is close between single family and home improvement.
Even though investment in single family structures has increased from the bottom, single family investment is still low, and still below the bottom for previous recessions as a percent of GDP. I expect some further increases.
Investment in single family structures was $282 billion (SAAR) (about 1.3% of GDP)..
Investment in multi-family structures decreased in Q4.
Investment in home improvement was at a $268 billion Seasonally Adjusted Annual Rate (SAAR) in Q2 (about 1.2% of GDP). Home improvement spending has been solid.
Personal Income increased 0.2% in December, Spending increased 0.3%
by Calculated Risk on 1/31/2020 09:02:00 AM
The BEA released the Personal Income and Outlays report for December:
Personal income increased $40.7 billion (0.2 percent) in December according to estimates released today by the Bureau of Economic Analysis. Disposable personal income (DPI) increased $30.6 billion (0.2 percent) and personal consumption expenditures (PCE) increased $46.6 billion (0.3 percent).The December PCE price index increased 1.6 percent year-over-year and the December PCE price index, excluding food and energy, increased 1.6 percent year-over-year.
Real DPI decreased 0.1 percent in December and Real PCE increased 0.1 percent. The PCE price index increased 0.3 percent. Excluding food and energy, the PCE price index increased 0.2 percent
The following graph shows real Personal Consumption Expenditures (PCE) through December 2019 (2012 dollars). Note that the y-axis doesn't start at zero to better show the change.
 Click on graph for larger image.
The dashed red lines are the quarterly levels for real PCE.
The increase in personal income was below expectations, and the increase in PCE was at expectations.
PCE growth was sluggish in Q4, and inflation remains below the Fed's target.
Thursday, January 30, 2020
Friday: Personal Income and Outlays
by Calculated Risk on 1/30/2020 07:37:00 PM
Friday:
• At 8:30 AM ET, Personal Income and Outlays for December. The consensus is for a 0.3% increase in personal income, and for a 0.3% increase in personal spending. And for the Core PCE price index to increase 0.1%.
• At 9:45 AM, Chicago Purchasing Managers Index for January. The consensus is for a reading of 48.5, up from 48.2 in December.
• At 10:00 AM, University of Michigan's Consumer sentiment index (Final for January). The consensus is for a reading of 99.1.
"Mortgage Rates Basically at Best Levels Since 2016"
by Calculated Risk on 1/30/2020 04:30:00 PM
From Matthew Graham at MortgageNewsDaily: Mortgage Rates Basically at Best Levels Since 2016
Mortgage rates improved again today as the market continued to react to updates on the coronavirus outbreak. For top tier scenarios, the average lender is now offering rates not seen since 2016, with the slight exception of a few hours during the beginning of September 2019. Even then, today's rates at least match Sept 2019's rates on average. In other words, today is tied for the lowest levels in more than 3 years. [Today's Most Prevalent Rates For Top Tier Scenarios 30YR FIXED - 3.5 -3.625%]
 Click on graph for larger image.
This graph from Mortgage News Daily shows mortgage rates since January 2011.
Not far from the record low levels of late 2012.
This graph is interactive, and you could view mortgage rates back to the mid-1980s - click here for interactive graph.
Q4 GDP: Investment
by Calculated Risk on 1/30/2020 12:54:00 PM
Investment was weak again in Q4, although residential investment picked up (increased at a 5.8% annual rate).
The first graph below shows the contribution to GDP from residential investment, equipment and software, and nonresidential structures (3 quarter trailing average). This is important to follow because residential investment tends to lead the economy, equipment and software is generally coincident, and nonresidential structure investment trails the economy.
In the graph, red is residential, green is equipment and software, and blue is investment in non-residential structures. So the usual pattern - both into and out of recessions is - red, green, blue.
The dashed gray line is the contribution from the change in private inventories.

Residential investment (RI) increased in Q4 (5.8% annual rate in Q3). Equipment investment decreased at a 2.9% annual rate, and investment in non-residential structures decreased at a 10.1% annual rate.
On a 3 quarter trailing average basis, RI (red) is up, equipment (green) is negative, and nonresidential structures (blue) is also down.
I'll post more on the components of non-residential investment once the supplemental data is released.

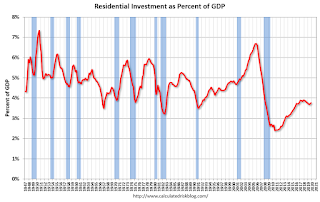
Residential Investment as a percent of GDP increased in Q4. RI as a percent of GDP is close to the bottom of the previous recessions - and I expect RI to continue to increase further in this cycle.
I'll break down Residential Investment into components after the GDP details are released.
Note: Residential investment (RI) includes new single family structures, multifamily structures, home improvement, broker's commissions, and a few minor categories.

HVS: Q4 2019 Homeownership and Vacancy Rates
by Calculated Risk on 1/30/2020 10:09:00 AM
The Census Bureau released the Residential Vacancies and Homeownership report for Q4 2019.
This report is frequently mentioned by analysts and the media to track household formation, the homeownership rate, and the homeowner and rental vacancy rates. However, there are serious questions about the accuracy of this survey.
This survey might show the trend, but I wouldn't rely on the absolute numbers. he Census Bureau is investigating the differences between the HVS, ACS and decennial Census, and analysts probably shouldn't use the HVS to estimate the excess vacant supply or household formation, or rely on the homeownership rate, except as a guide to the trend.
"National vacancy rates in the fourth quarter 2019 were 6.4 percent for rental housing and 1.4 percent for homeowner housing. The rental vacancy rate of 6.4 percent was not statistically different from the rate in the fourth quarter 2018 (6.6 percent), but 0.4 percentage points lower than the rate in the third quarter 2019 (6.8 percent). The homeowner vacancy rate of 1.4 percent was not statistically different from the rate in the fourth quarter 2018 (1.5 percent) and virtually unchanged from the rate in the third quarter 2019.
The homeownership rate of 65.1 percent was not statistically different from the rate in the fourth quarter 2018 (64.8 percent) nor from the rate in the third quarter 2019 (also 64.8 percent). "
 Click on graph for larger image.
The Red dots are the decennial Census homeownership rates for April 1st 1990, 2000 and 2010. The HVS homeownership rate increased to 65.1% in Q4, from 64.8% in Q3.
I'd put more weight on the decennial Census numbers. However, given changing demographics, the homeownership rate has bottomed.
 The HVS homeowner vacancy was unchanged at 1.4%.
 Once again - this probably shows the general trend, but I wouldn't rely on the absolute numbers.
 The rental vacancy rate decreased to 6.4% in Q4.
The quarterly HVS is the most timely survey on households, but there are many questions about the accuracy of this survey.
Overall this suggests that vacancies have declined significantly, and my guess is the homeownership rate has bottomed - and that the rental vacancy rate is close to the bottom for this cycle.
Weekly Initial Unemployment Claims Decrease to 216,000
by Calculated Risk on 1/30/2020 08:39:00 AM
The DOL reported:
In the week ending January 25, the advance figure for seasonally adjusted initial claims was 216,000, a decrease of 7,000 from the previous week's revised level. The previous week's level was revised up by 12,000 from 211,000 to 223,000. The 4-week moving average was 214,500, a decrease of 1,750 from the previous week's revised average. The previous week's average was revised up by 3,000 from 213,250 to 216,250.The previous week was revised up significantly.
emphasis added
The following graph shows the 4-week moving average of weekly claims since 1971.
 Click on graph for larger image.
The dashed line on the graph is the current 4-week average. The four-week average of weekly unemployment claims decreased to 214,500.
This was close to the consensus forecast.
BEA: Real GDP increased at 2.1% Annualized Rate in Q4
by Calculated Risk on 1/30/2020 08:34:00 AM
From the BEA: Gross Domestic Product, Fourth Quarter and Year 2019 (Advance Estimate)
Real gross domestic product (GDP) increased at an annual rate of 2.1 percent in the fourth quarter of 2019, according to the "advance" estimate released by the Bureau of Economic Analysis. In the third quarter, real GDP increased 2.1 percent. ...The advance Q4 GDP report, with 2.1% annualized growth, was at expectations.
The increase in real GDP in the fourth quarter reflected positive contributions from personal consumption expenditures (PCE), federal government spending, state and local government spending, residential fixed investment, and exports, that were partly offset by negative contributions from private inventory investment and nonresidential fixed investment. Imports, which are a subtraction in the calculation of GDP, decreased.
Real GDP growth in the fourth quarter was the same as that in the third. In the fourth quarter, a downturn in imports, an acceleration in government spending, and a smaller decrease in nonresidential investment were offset by a larger decrease in private inventory investment and a slowdown in PCE.
emphasis added
Personal consumption expenditures (PCE) increased at 1.8% annualized rate in Q4, down from 3.2% in Q3. Residential investment (RI) increased at a 5.8% rate in Q4. Equipment investment decreased at a 2.9% annualized rate, and investment in non-residential structures decreased at a 10.1% pace.
I'll have more later ...
Wednesday, January 29, 2020
Thursday: GDP, Unemployment Claims
by Calculated Risk on 1/29/2020 07:22:00 PM
Thursday:
• At 8:30 AM ET, The initial weekly unemployment claims report will be released. The consensus is for 215,000 initial claims, up from 211,000 last week.
• At 8:30 AM, Gross Domestic Product, 4th quarter 2019 (Advance estimate). The consensus is that real GDP increased 2.1% annualized in Q4, the same as in Q3.
• At 10:00 AM, the Q4 2019 Housing Vacancies and Homeownership from the Census Bureau.
Zillow Case-Shiller Forecast: House Price Gains "Primed for an Upswing"
by Calculated Risk on 1/29/2020 04:40:00 PM
The Case-Shiller house price indexes for November were released yesterday. Zillow forecasts Case-Shiller a month early, and I like to check the Zillow forecasts since they have been pretty close.
From Matthew Speakman at Zillow: November Case-Shiller Results and December Forecast: Primed for an Upswing
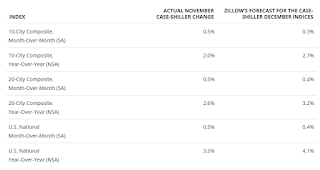
The S&P CoreLogic Case-Shiller U.S. National Home Price Index® rose 3.5% year-over-year in November (non-seasonally adjusted), up from 3.2% in October. Annual growth was also up from September in the smaller 10-city index (to 2%, from 1.7%) and in the 20-city index (to 2.6%, from 2.2%).
...
After a yearlong slowdown in 2019, home values appear primed to go back on the upswing to start 2020.
The main driver in this acceleration is clearly the ongoing and historic lack of for-sale inventory, though a strong job market, stabilizing geopolitical tensions and still-low mortgage rates have played their part. Even taking seasonal factors into consideration, the number of homes available for sale fell consistently through the latter part of 2019 and now sits near the lowest level on record. This lack of homes has made competition among buyers — buoyed by otherwise favorable economic conditions — even more fierce, in turn helping to push up prices even faster. Indeed, homebuying activity has picked up in recent months, with sales of existing homes reaching their highest level in nearly two years in December.
emphasis added
 The Zillow forecast is for the year-over-year change for the Case-Shiller National index to be at 4.1% in December, up from 3.5% in December.
 The Zillow forecast is for the 20-City index to be up 3.2% YoY in December from 2.6% in November, and for the 10-City index to increase to 2.7% YoY compared to 2.0% YoY in November.


