by Calculated Risk on 2/27/2020 12:57:00 PM
Thursday, February 27, 2020
NAR: "Pending Home Sales Ascend 5.2% in January"
From the NAR: Pending Home Sales Ascend 5.2% in January
Pending home sales rebounded in January, ticking up following a decline in December, according to the National Association of Realtors®. Only the West region reported a minor drop in month-over-month contract activity, while the other three major regions each saw pending home sales grow. Year-over-year pending home sales activity was up in all four regions and thus up nationally compared to one year ago.This was well above expectations for this index. Note: Contract signings usually lead sales by about 45 to 60 days, so this would usually be for closed sales in February and March.
The Pending Home Sales Index (PHSI), a forward-looking indicator based on contract signings, grew 5.2% to 108.8 in January. Year-over-year contract signings increased 5.7%. An index of 100 is equal to the level of contract activity in 2001.
...
The Northeast PHSI rose 1.3% to 92.9 in January, 1.2% higher than a year ago. In the Midwest, the index increased 7.3% to 105.3 last month, 6.5% higher than in January 2019.
Pending home sales in the South grew 8.7% to an index of 129.4 in January, a 7.1% increase from January 2019. The index in the West declined 1.1% in January 2020 to 92.6, still a jump of 5.5% from a year ago.
emphasis added
Kansas City Fed: "Tenth District Manufacturing Activity Increased Modestly" in February
by Calculated Risk on 2/27/2020 11:00:00 AM
From the Kansas City Fed: Tenth District Manufacturing Activity Increased Modestly
The Federal Reserve Bank of Kansas City released the February Manufacturing Survey today. According to Chad Wilkerson, vice president and economist at the Federal Reserve Bank of Kansas City, the survey revealed that Tenth District manufacturing activity increased modestly, reaching positive territory for the first time in eight months.This was the last of the regional Fed surveys for February.
“Regional factory activity finally expanded again in February,” said Wilkerson. “This was despite over 40 percent of firms reporting some negative effect from the spread of coronavirus so far in 2020.”
...
The month-over-month composite index was 5 in February, higher than -1 in January and -5 in December. The composite index is an average of the production, new orders, employment, supplier delivery time, and raw materials inventory indexes. The increase in district manufacturing activity was driven by both durable and non-durable goods plants, particularly food and transportation equipment producers. Most month-over-month indexes moved into positive territory in February, with many reaching their highest levels in over a year. However, the order backlog and employment indexes continued to fall. Year-over-year factory indexes rebounded strongly, with the composite index jumping from -7 to 5. The future composite index remained solid, inching slightly higher from 14 to 16.
emphasis added
Here is a graph comparing the regional Fed surveys and the ISM manufacturing index:
 Click on graph for larger image.
The New York and Philly Fed surveys are averaged together (yellow, through February), and five Fed surveys are averaged (blue, through February) including New York, Philly, Richmond, Dallas and Kansas City. The Institute for Supply Management (ISM) PMI (red) is through January (right axis).
Based on these regional surveys, it seems likely the ISM manufacturing index will increase further in February.
Q4 GDP Unchanged at 2.1% Annual Rate
by Calculated Risk on 2/27/2020 08:39:00 AM
From the BEA: Gross Domestic Product, Fourth Quarter and Year 2019 (Second Estimate)
Real gross domestic product (GDP) increased at an annual rate of 2.1 percent in the fourth quarter of 2019 (table 1), according to the "second" estimate released by the Bureau of Economic Analysis. In the third quarter, real GDP also increased 2.1 percent.Here is a Comparison of Second and Advance Estimates. PCE growth was revised down to 1.7% from 1.8%. Residential investment was revised up from 5.8% to 6.2%. The revisions were small. This was at the consensus forecast.
The GDP estimate released today is based on more complete source data than were available for the "advance" estimate issued last month. In the advance estimate, the increase in real GDP was also 2.1 percent. In the second estimate, an upward revision to private inventory investment was offset by a downward revision to nonresidential fixed investment.
emphasis added
Weekly Initial Unemployment Claims Increase to 219,000
by Calculated Risk on 2/27/2020 08:33:00 AM
The DOL reported:
In the week ending February 22, the advance figure for seasonally adjusted initial claims was 219,000, an increase of 8,000 from the previous week's revised level. The previous week's level was revised up by 1,000 from 210,000 to 211,000. The 4-week moving average was 209,750, an increase of 500 from the previous week's revised average. The previous week's average was revised up by 250 from 209,000 to 209,250.The previous week was revised up.
emphasis added
The following graph shows the 4-week moving average of weekly claims since 1971.
 Click on graph for larger image.
The dashed line on the graph is the current 4-week average. The four-week average of weekly unemployment claims increased to 209,750.
This was higher than the consensus forecast.
Wednesday, February 26, 2020
Thursday: GDP, Unemployment Claims
by Calculated Risk on 2/26/2020 07:42:00 PM
Thursday:
• At 8:30 AM ET, The initial weekly unemployment claims report will be released. The consensus is for 211 thousand initial claims, up from 210 thousand the previous week.
• At 8:30 AM, Gross Domestic Product, 4th quarter 2019 (Second estimate). The consensus is that real GDP increased 2.1% annualized in Q4, unchanged from the advance estimate.
• At 8:30 AM, Durable Goods Orders for January from the Census Bureau. The consensus is for a 1.5% decrease in durable goods orders.
• At 11:00 AM, the Kansas City Fed manufacturing survey for February. This is the last of regional manufacturing surveys for February.
Zillow Case-Shiller Forecast: House Price Gains "Back on the Gas"
by Calculated Risk on 2/26/2020 04:58:00 PM
The Case-Shiller house price indexes for December were released yesterday. Zillow forecasts Case-Shiller a month early, and I like to check the Zillow forecasts since they have been pretty close.
From Matthew Speakman at Zillow: December Case-Shiller Results & January Forecast: Back on the Gas
The final reading of 2019 confirmed that a reacceleration of home price growth has indeed begun, after growth spent nearly the entire calendar year tapping on the brakes.
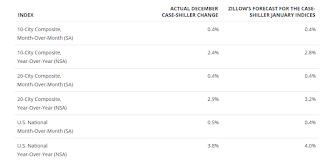
The national Case-Shiller Home Price Index rose 3.8% year-over-year in December. The smaller 10- and 20-city composite indices grew more slowly, at 2.4% and 2.9% year-over-year, respectively.
...
For-sale inventory remains near its lowest level on record, which has stoked competition for the relatively few homes on the market and nudged prices back upward as a result. The rebound in home price growth is also rooted in the sustained strength of the U.S. economy, which continues to ride a robust labor market, and mortgage rates that finished the year near their lowest levels since 2016 and have fallen even further since.
emphasis added
 The Zillow forecast is for the year-over-year change for the Case-Shiller National index to be at 4.0% in January, up from 3.8% in December.
 The Zillow forecast is for the 20-City index to be up 3.2% YoY in January from 2.9% in December, and for the 10-City index to increase to 2.8% YoY compared to 2.4% YoY in December.
New Home Prices
by Calculated Risk on 2/26/2020 03:24:00 PM
As part of the new home sales report released today, the Census Bureau reported the number of homes sold by price and the average and median prices.
From the Census Bureau: "The median sales price of new houses sold in January 2020 was $348,200. The average sales price was $402,300."
The following graph shows the median and average new home prices.

During the housing bust, the builders had to build smaller and less expensive homes to compete with all the distressed sales. When housing started to recovery - with limited finished lots in recovering areas - builders moved to higher price points to maximize profits.
The average price in January 2020 was $402,300, and the median price was $348,200.
The second graph shows the percent of new homes sold by price.

The $400K+ bracket increased significantly since the housing recovery started, but has been holding steady recently. Still, a majority of new homes (about 55%) in the U.S., are in the $200K to $400K range.
A few Comments on January New Home Sales
by Calculated Risk on 2/26/2020 11:08:00 AM
New home sales for January were reported at 764,000 on a seasonally adjusted annual rate basis (SAAR). Sales for the previous three months were revised up, combined.
This was the highest sales rate since July 2007.
Earlier: New Home Sales increase to 764,000 Annual Rate in January.

This graph shows new home sales for 2019 and 2020 by month (Seasonally Adjusted Annual Rate).
The year-over-year comparison are fairly easy in the first half of 2020, and sales were up 18.6% YoY in January.
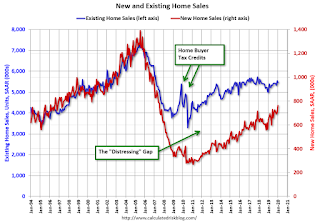
And here is another update to the "distressing gap" graph that I first started posting a number of years ago to show the emerging gap caused by distressed sales.

Following the housing bubble and bust, the "distressing gap" appeared mostly because of distressed sales.
Even though distressed sales are down significantly, following the bust, new home builders focused on more expensive homes - so the gap closed slowly.
Now the gap is mostly closed, and I expect it to close a little more. However, this assumes that the builders will offer some smaller, less expensive homes.

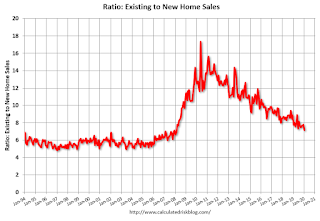
This ratio was fairly stable from 1994 through 2006, and then the flood of distressed sales kept the number of existing home sales elevated and depressed new home sales. (Note: This ratio was fairly stable back to the early '70s, but I only have annual data for the earlier years).
In general the ratio has been trending down since the housing bust - and is getting close to the historical ratio - and I expect this ratio will trend down a little more.
Note: Existing home sales are counted when transactions are closed, and new home sales are counted when contracts are signed. So the timing of sales is different.
New Home Sales increase to 764,000 Annual Rate in January
by Calculated Risk on 2/26/2020 10:13:00 AM
The Census Bureau reports New Home Sales in January were at a seasonally adjusted annual rate (SAAR) of 764 thousand.
The previous three months were revised up, combined.
"Sales of new single‐family houses in January 2020 were at a seasonally adjusted annual rate of 764,000, according to estimates released jointly today by the U.S. Census Bureau and the Department of Housing and Urban Development. This is 7.9 percent above the revised December rate of 708,000 and is 18.6 percent above the January 2019 estimate of 644,000."
emphasis added
 Click on graph for larger image.
The first graph shows New Home Sales vs. recessions since 1963. The dashed line is the current sales rate.
Even with the increase in sales over the last several years, new home sales are just at a normal level.
The second graph shows New Home Months of Supply.
 The months of supply decreased in January to 5.1 months from 5.5 months in December.
 The all time record was 12.1 months of supply in January 2009.
This is in the normal range (less than 6 months supply is normal).
"The seasonally‐adjusted estimate of new houses for sale at the end of January was 324,000. This represents a supply of 5.1 months at the current sales rate."
 On inventory, according to the Census Bureau:
 "A house is considered for sale when a permit to build has been issued in permit-issuing places or work has begun on the footings or foundation in nonpermit areas and a sales contract has not been signed nor a deposit accepted."Starting in 1973 the Census Bureau broke this down into three categories: Not Started, Under Construction, and Completed.
The third graph shows the three categories of inventory starting in 1973.
The inventory of completed homes for sale is still somewhat low, and the combined total of completed and under construction is close to normal.
 The last graph shows sales NSA (monthly sales, not seasonally adjusted annual rate).
In January 2020 (red column), 57 thousand new homes were sold (NSA). Last year, 49 thousand homes were sold in January
The all time high for January was 92 thousand in 2005, and the all time low for January was 21 thousand in 2011.
This was above expectations of 715 thousand sales SAAR, and sales in the three previous months were revised up, combined. This was a strong report with sales up 18.6% year-over-year. I'll have more later today.
MBA: Mortgage Applications Increased in Latest Weekly Survey
by Calculated Risk on 2/26/2020 07:00:00 AM
From the MBA: Mortgage Applications Increase in Latest MBA Weekly Survey
Mortgage applications increased 1.5 percent from one week earlier, according to data from the Mortgage Bankers Association’s (MBA) Weekly Mortgage Applications Survey for the week ending February 21, 2020. This week’s results include an adjustment for the Washington Birthday (Presidents’ Day) Holiday.
... The Refinance Index decreased 1 percent from the previous week and was 152 percent higher than the same week one year ago. The seasonally adjusted Purchase Index increased 6 percent from one week earlier. The unadjusted Purchase Index decreased 1 percent compared with the previous week and was 10 percent higher than the same week one year ago.
...
“Last week appears to have been the calm before the storm. Weaker readings on economic growth caused a slight drop in mortgage rates, bringing them back to their level two weeks ago, but applications overall moved 1.5 percent higher,” said Mike Fratantoni, MBA’s Senior Vice President and Chief Economist. “Refinance applications for conventional loans dropped a bit, but FHA refinances increased more than 22 percent. Purchase volume remained strong, supported both by low rates and the increased pace of construction over the past few months. With housing supply at low levels, new inventory is a positive development for prospective homebuyers.”
Added Fratantoni, “As fears regarding the coronavirus have increased, Treasury yields have dropped to record lows this week amid the ensuing financial market volatility. Next week’s results will show the impact this drop in Treasuries had on mortgage activity.”
...
The average contract interest rate for 30-year fixed-rate mortgages with conforming loan balances ($510,400 or less) decreased to 3.73 percent from 3.77 percent, with points decreasing to 0.27 from 0.28 (including the origination fee) for 80 percent loan-to-value ratio (LTV) loans.
emphasis added
 Click on graph for larger image.
The first graph shows the refinance index since 1990.
With lower rates, we saw a sharp increase in refinance activity, but mortgage rates would have to decline further to see a 2012 size refinance boom.
 The second graph shows the MBA mortgage purchase index
According to the MBA, purchase activity is up 10% year-over-year.


