by Calculated Risk on 3/08/2020 12:40:00 PM
Sunday, March 08, 2020
Fiscal Policies to Address COVID-19
First, some good news on the flu from the CDC:
"Key indicators that track flu activity remain high but decreased for the third week in a row. Severity indicators (hospitalizations and deaths) remain moderate to low overall …"It appears flu season is starting to wind down, and that will lessen the burden on our healthcare professionals.
And on testing, Dr. Anthony Fauci, director of the National Institute of Allergy and Infectious Diseases said on Meet the Press this morning:
"early on, there were some missteps" … "But right now I believe 1.1 million tests have already been sent out. By Monday there’ll be an additional 400,000."IMPORTANT: See the entire interview with Dr. Fauci here: Fauci: Those 'vulnerable' to coronavirus should limit travel and crowd exposure (second video is full interview). Listen to his comments on testing! (first couple of minutes). Dr. Fauci is transparent, honest and factual.
Test kits are just one part of the equation on testing. We also need testing capacity. Tests need to be ubiquitous, and free for all. Medicare is already paying for the tests, and most insurance companies have said they will pay for the tests. The Federal Government needs to step up and pay for the tests for the uninsured (with no citizenship requirement).
Currently qualifying for a test is too restrictive (due to the lack of test kits and capacity). It should be easy to qualify (those that have symptoms, or close contact with someone with COVID-19, or healthcare workers and first responders, or staff at retirement communities and those that frequent those communities should all be able to obtain tests on demand).
On fiscal policy:
1) The Federal Government should immediately announce that tests are free for the uninsured.
2) For those that test positive (but don't need hospitalization), the experts should determine how to isolate them. If their employers will not pay for their time off, then the government should pay. We don't want people avoiding tests because of the costs or the fear of lost income.
3) Sick people should not go to work. If the company does not pay for sick leave, the Government could have a program of sharing part of the sick leave (say 50% with the company). This is important for part time workers. Companies like Trader Joe's have already announced that part time employees can take sick leave.
4) We need to proactively expand unemployment insurance. (Note: There would be triggers for this program, so if we get lucky, and COVID-19 is seasonal, then this program would have minimal fiscal impact.) The idea is to increase the amount paid (based on various triggers) and to include parents with school closures (to help with child care).
4a) Based on certain triggers, the Federal Government would pay an additional 60% of whatever the state is paying for unemployment insurance (if the state is paying $300 per week, the Federal government would add $180 per week). (Note: The 60% is just an arbitrary number). The requirement that people are looking for work would be waived (this is not a financial issue - it is a health issue)
Triggers could be based on an increase in the 4-week average of unemployment claims above a certain threshold (like 250K), or industry triggers (workers in leisure industries such as airlines, hotels, etc. could qualify), or there could be geographical triggers based on a serious regional outbreak of the virus. So this wouldn't go into effect until certain triggers happen.
4b) On school closures, the Federal Government would pay a parent both the state share and the 60% extra. School closures are easy to verify. There should be a "reduction in hours" clause, so a person can keep working during a school closure, and still receive some benefits.
4c) There should be a provision to extend the benefits (entirely paid by the Federal government) if the crisis is still ongoing.
This type of program is targeted and builds confidence. One of the concerns during a downturn is that people will slow their spending because they become worried about their financial situation if they lose their job. This will alleviate that fear somewhat.
5) Based on economic data, the Federal Government should be prepared to get money to everyone. One suggestion is to significantly lower payroll tax withholding, from former Fed economist Claudia Sahm:
The easiest way is to cut federal tax withholding for the next two months. In 1992, George H. W. Bush issued an executive order, employers used the new withholding tables, and within weeks people got a bump in their paychecks. It worked, people spent the money.It is important to be proactive on fiscal policy so that we are prepared if the situation deteriorates quickly.
Saturday, March 07, 2020
Schedule for Week of March 8, 2020
by Calculated Risk on 3/07/2020 08:11:00 AM
This will be a light week for economic data.
The key report scheduled for this week is February CPI.
No major economic releases scheduled.
6:00 AM ET: NFIB Small Business Optimism Index for February.
7:00 AM ET: The Mortgage Bankers Association (MBA) will release the results for the mortgage purchase applications index.
8:30 AM: The Consumer Price Index for February from the BLS. The consensus is for no change in CPI, and a 0.2% increase in core CPI.
8:30 AM: The initial weekly unemployment claims report will be released. The consensus is for 215 thousand initial claims, down from 216 thousand the previous week.
8:30 AM: The Producer Price Index for February from the BLS. The consensus is for a 0.1% decrease in PPI, and a 0.2% increase in core PPI.
12:00 PM: Q4 Flow of Funds Accounts of the United States from the Federal Reserve.
10:00 AM: University of Michigan's Consumer sentiment index (Preliminary for March).
Friday, March 06, 2020
High Frequency Data: Movie Box Office
by Calculated Risk on 3/06/2020 06:27:00 PM
There are some sectors that will be hit hard over the next several months: hotels, airlines, restaurants, movie theaters, sporting events, and convention centers. People will probably avoid these places as part of social distancing.
I already track weekly hotel occupancy data from STR, and the occupancy data is starting to show some impact from COVID-19. I'll also be posting updates on monthly visitor and convention traffic in Las Vegas.
For high frequency data, I'm going to start tracking domestic box office numbers from Box Office Mojo every Friday.

This data shows cumulative domestic box office for this year (red) and the previous four years.
This data is through the week ending March 5, 2020.
There are many factors impacting box office numbers, but this will give an idea if people are avoiding theaters.
Currently 2020 is tracking close to 2019.
Q1 GDP Forecasts: 0.7% to 3.1%
by Calculated Risk on 3/06/2020 02:52:00 PM
From Merrill Lynch:
We mark to market our 1Q GDP forecast up to 1.5% from 1.0%, while taking down 2Q GDP by 0.6pp to 1.0% and 3Q GDP 0.2pp to 1.4%, reflecting wider disruption from the COVID-19 spread. [Mar 6 estimate]From Goldman Sachs:
emphasis added
Based on the downward revision to January wholesale inventories and the declines in US and global trade volumes, we lowered our Q1 GDP growth forecast by two-tenths to +0.7% (qoq ar). [Mar 6 estimate]From the NY Fed Nowcasting Report
The New York Fed Staff Nowcast stands at 1.7% for 2020:Q1 and 1.3% for 2020:Q2 [Mar 6 estimate]And from the Altanta Fed: GDPNow
The GDPNow model estimate for real GDP growth (seasonally adjusted annual rate) in the first quarter of 2020 is 3.1 percent on March 6, up from 2.7 percent on March 2. [Mar 6 estimate]CR Note: These early estimates suggest real GDP growth will be between 0.7% and 3.1% annualized in Q1.
AAR: February Rail Carloads down 7.3% YoY, Intermodal Down 8.9% YoY
by Calculated Risk on 3/06/2020 02:19:00 PM
From the Association of American Railroads (AAR) Rail Time Indicators. Graphs and excerpts reprinted with permission.
Total U.S. rail carloads fell 7.3% (73,058 carloads) in February 2020 from February 2019, their 13th straight decline, but the decline disappears if you take away coal and grain (whose carloads tend to rise or fall for reasons that have little to do with the state of the economy).
...
U.S. intermodal originations fell 8.9% (96,897 units) in February 2020 and 7.0% (167,978 units) in the first two months of 2020. Around half of U.S. intermodal comes from international trade. Supply chain disruptions related to the coronavirus outbreak may have played some unquantifiable role in February’s decline, but intermodal has been falling for more than a year, so more is going on, including economic uncertainty and trade frictions that pre-date the virus.
emphasis added
 Click on graph for larger image.
This graph from the Rail Time Indicators report shows the six week average of U.S. Carloads in 2018, 2019 and 2020:
Total originated carloads were 7.3% lower, or 73,058 carloads, in February 2020 from February 2019, their 13th consecutive year-over-year monthly decline. Total carloads averaged 231,771 per week in February 2020. That’s the lowest for any month since 1988, when our data begin.
Coal bears most of the blame. Carloads of coal in February were down 67,770 carloads, or 21.1%, their biggest percentage decline since mid-2016.
 The second graph shows the six week average of U.S. intermodal in 2018, 2019 and 2020: (using intermodal or shipping containers):
U.S. intermodal originations were down 8.9%, or 96,897 containers and trailers, in February 2020, their 13th straight decline. Weekly average originations in February 2020 were 249,421, the lowest for February since 2015. Year-to-date volume through February was down 7.0%, or 167,978 units. If, as the American Association of Port Authorities recently suggested, cargo volumes at many U.S. ports will fall by 20% or more in Q1 2020 from Q1 2019 because of the coronavirus, it might be a while before U.S. intermodal volumes move back into growth mode.
Comments on February Employment Report
by Calculated Risk on 3/06/2020 10:41:00 AM
The headline jobs number at 273 thousand for February was well above consensus expectations of 175 thousand, and the previous two months were revised up 85 thousand, combined. The unemployment rate decreased to 3.5%. Note: It appears weather boosted employment in February - I'll have more on this later.
Earlier: February Employment Report: 273,000 Jobs Added (266,000 ex-Census), 3.5% Unemployment Rate
In February, the year-over-year employment change was 2.409 million jobs including Census hires.
Average Hourly Earnings
Wage growth was at expectations. From the BLS:
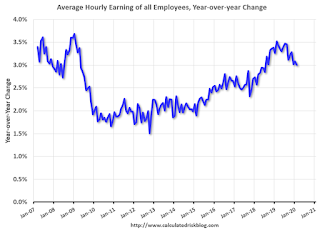
"In February, average hourly earnings for all employees on private nonfarm payrolls increased by 9 cents to $28.52. Over the past 12 months, average hourly earnings have increased by 3.0 percent."
 This graph is based on “Average Hourly Earnings” from the Current Employment Statistics (CES) (aka "Establishment") monthly employment report. Note: There are also two quarterly sources for earnings data: 1) “Hourly Compensation,” from the BLS’s Productivity and Costs; and 2) the Employment Cost Index which includes wage/salary and benefit compensation.
The graph shows the nominal year-over-year change in "Average Hourly Earnings" for all private employees. Nominal wage growth was at 3.0% YoY in February.
Wage growth had been generally trending up, but weakened in 2019 and early 2020.
Prime (25 to 54 Years Old) Participation
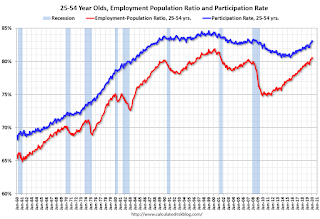
 Since the overall participation rate has declined due to cyclical (recession) and demographic (aging population, younger people staying in school) reasons, here is the employment-population ratio for the key working age group: 25 to 54 years old.
In the earlier period the participation rate for this group was trending up as women joined the labor force. Since the early '90s, the participation rate moved more sideways, with a downward drift starting around '00 - and with ups and downs related to the business cycle.
The 25 to 54 participation rate decreased in February to 83.0%, and the 25 to 54 employment population ratio decreased to 80.5%.
Part Time for Economic Reasons
 From the BLS report:
"The number of persons employed part time for economic reasons, at 4.3 million, changed little in February. These individuals, who would have preferred full-time employment, were working part time because their hours had been reduced or they were unable to find full-time jobs."The number of persons working part time for economic reasons increased in February to 4.318 million from 4.182 million in January. The number of persons working part time for economic reason has been generally trending down.
Part time workers will be something to watch over the next several months.
These workers are included in the alternate measure of labor underutilization (U-6) that increased to 7.0% in February.
Unemployed over 26 Weeks
 This graph shows the number of workers unemployed for 27 weeks or more.
 According to the BLS, there are 1.102 million workers who have been unemployed for more than 26 weeks and still want a job. This was down from 1.166 million in January.
This was the lowest level for long term unemployed since December 2006.
Summary:
The headline jobs number was well above expectations, and the previous two months were revised up. The headline unemployment rate decreased to 3.5%; however wage growth slowed to 3.0% year-over-year. Overall this was a solid report, although there was probably some boost from the weather.
Las Vegas Real Estate in February: Sales up 23% YoY, Inventory down 39% YoY
by Calculated Risk on 3/06/2020 10:08:00 AM
Note: Las Vegas will probably see a significant decline in visitor and convention traffic over the next several months due to COVID-19. We will see if this has a significant impact on local real estate. Sales in February were strong, and prices finally hit new highs (there was a huge bubble in Las Vegas).
The Greater Las Vegas Association of Realtors reported Southern Nevada home prices finally break all-time record while supply keeps shrinking; LVR housing statistics for February 2020
The total number of existing local homes, condos and townhomes sold during February was 3,089. Compared to the same time last year, February sales were up 25.7% for homes and up 14.0% for condos and townhomes.1) Overall sales were up 23.2% year-over-year to 3,089 in February 2020 from 2,508 in February 2019.
...
By the end of February, LVR reported 4,240 single-family homes listed for sale without any sort of offer. That’s down 40.6% from one year ago. For condos and townhomes, the 1,214 properties listed without offers in February represented a 30.8% drop from one year ago.
…
Meanwhile, the number of so-called distressed sales remains near historically low levels. The association reported that short sales and foreclosures combined accounted for 2.5% of all existing local property sales in February. That compares to 2.6% of all sales one year ago, 3.8% two years ago and 10.6% three years ago.
emphasis added
2) Active inventory (single-family and condos) is down from a year ago, from a total of 8,888 in February 2019 to 5,454 in February 2020. Note: Total inventory was down 38.6% year-over-year. This is the fourth consecutive month with a year-over-year decrease in inventory, and that follows 16 consecutive months with a YoY increase in inventory. And months of inventory is still low.
3) Low level of distressed sales.
Trade Deficit decreased to $45.3 Billion in January
by Calculated Risk on 3/06/2020 09:07:00 AM
Note: This data was for January and the outbreak of COVID-19 probably had little or no on impact at that time.
From the Department of Commerce reported:
The U.S. Census Bureau and the U.S. Bureau of Economic Analysis announced today that the goods and services deficit was $45.3 billion in January, down $3.3 billion from $48.6 billion in December, revised.
January exports were $208.6 billion, $0.9 billion less than December exports. January imports were $253.9 billion, $4.2 billion less than December imports.
emphasis added
 Click on graph for larger image.
Both exports and imports decreased in January.
Exports are 26% above the pre-recession peak and up 1% compared to January 2019; imports are 9% above the pre-recession peak, and down 2% compared to January 2019.
In general, trade both imports and exports have moved more sideways or down recently.
The second graph shows the U.S. trade deficit, with and without petroleum.
 The blue line is the total deficit, and the black line is the petroleum deficit, and the red line is the trade deficit ex-petroleum products.
Note that the U.S. exported a slight net positive petroleum products in recent months.
Oil imports averaged $61.93 per barrel in January, up from $61.34 in December, and up from $54.35 in January 2019.
The trade deficit with China decreased to $26.1 billion in January, from $34.5 billion in January 2019.
February Employment Report: 273,000 Jobs Added (266,000 ex-Census), 3.5% Unemployment Rate
by Calculated Risk on 3/06/2020 08:42:00 AM
From the BLS:
Total nonfarm payroll employment rose by 273,000 in February, and the unemployment rate was little changed at 3.5 percent, the U.S. Bureau of Labor Statistics reported today. Notable job gains occurred in health care and social assistance, food services and drinking places, government, construction, professional and technical services, and financial activities.
...
Federal employment increased by 8,000, reflecting the hiring of 7,000 temporary workers for the 2020 Census.
...
The change in total nonfarm payroll employment for December was revised up by 37,000 from +147,000 to +184,000, and the change for January was revised up by 48,000 from +225,000 to +273,000. With these revisions, employment gains in December and January combined were 85,000 higher than previously reported.
...
In February, average hourly earnings for all employees on private nonfarm payrolls increased by 9 cents to $28.52. Over the past 12 months, average hourly earnings have increased by 3.0 percent.
emphasis added
 Click on graph for larger image.
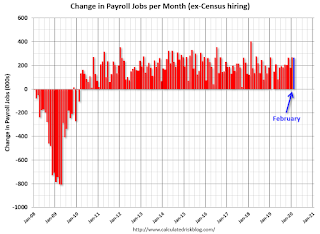
The first graph shows the monthly change in payroll jobs, ex-Census (meaning the impact of the decennial Census temporary hires and layoffs is removed - mostly in 2010 - to show the underlying payroll changes).
Total payrolls increased by 266 thousand in February ex-Census (private payrolls increased 228 thousand).
Payrolls for December and January were revised up 85 thousand combined.
 This graph shows the year-over-year change in total non-farm employment since 1968.
In February, the year-over-year change was 2.409 million jobs.
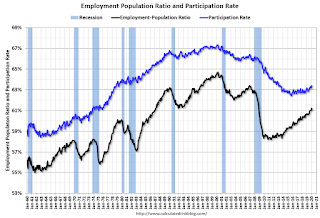
The third graph shows the employment population ratio and the participation rate.
 The Labor Force Participation Rate was unchanged at 63.4% in February. This is the percentage of the working age population in the labor force. A large portion of the recent decline in the participation rate is due to demographics and long term trends.
The Employment-Population ratio decreased to 61.1% (black line).
I'll post the 25 to 54 age group employment-population ratio graph later.
 The fourth graph shows the unemployment rate.
 The unemployment rate decreased in February to 3.5%.
This was well above consensus expectations of 175,000 jobs added, and December and January were revised up by 85,000 combined.
I'll have much more later ...
Thursday, March 05, 2020
Friday: Employment Report, Trade Deficit
by Calculated Risk on 3/05/2020 06:16:00 PM
My February Employment Preview.
Goldman's February Payrolls preview.
Friday:
• At 8:30 AM ET, Employment Report for February. The consensus is for 175,000 jobs added, and for the unemployment rate to be unchanged at 3.6%.
• Also at 8:30 AM, Trade Balance report for January from the Census Bureau. The consensus is the trade deficit to be $47.7 billion. The U.S. trade deficit was at $48.9 billion in December.
• At 3:00 PM, Consumer Credit from the Federal Reserve.


