by Calculated Risk on 3/10/2020 04:29:00 PM
Tuesday, March 10, 2020
Employment: February Diffusion Indexes
I haven't posted this in a few months.
The BLS diffusion index for total private employment was at 58.7 in February, up from 57.0 in January.
For manufacturing, the diffusion index was at 54.6, up from 47.4 in January.
Think of this as a measure of how widespread job gains are across industries. The further from 50 (above or below), the more widespread the job losses or gains reported by the BLS. From the BLS:
Figures are the percent of industries with employment increasing plus one-half of the industries with unchanged employment, where 50 percent indicates an equal balance between industries with increasing and decreasing employment.
 Overall both total private and manufacturing job growth were somewhat widespread in February.
Both indexes generally trended down in 2019 - except for a spike up in November - indicating job growth was becoming less widespread across industries (especially manufacturing).
Trends in Educational Attainment in the U.S. Labor Force
by Calculated Risk on 3/10/2020 12:44:00 PM
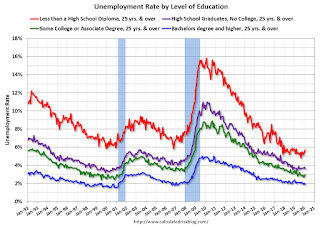
The first graph shows the unemployment rate by four levels of education (all groups are 25 years and older) through Feb 2020. Note: This is an update to a post from a few years ago.
Unfortunately this data only goes back to 1992 and includes only two recessions (the stock / tech bust in 2001, and the housing bust/financial crisis). Clearly education matters with regards to the unemployment rate - and all four groups are generally trending down.

Note: This says nothing about the quality of jobs - as an example, a college graduate working at minimum wage would be considered "employed".
This brings up an interesting question: What is the composition of the labor force by educational attainment, and how has that been changing over time?
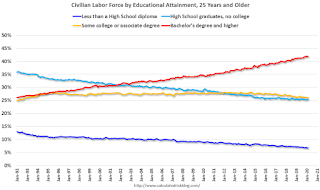
Here is some data on the U.S. labor force by educational attainment since 1992.

This is the only category trending up. "Some college" has been steady, and both "high school" and "less than high school" have been trending down.
Based on current trends, probably more than half the labor force will have at least a bachelor's degree at the end of this decade (2020s).
Some thoughts: Since workers with bachelor's degrees typically have a lower unemployment rate, this is probably a factor in pushing down the overall unemployment rate over time.
Also, I'd guess more education would mean less labor turnover, and that education is a factor in fewer weekly claims (I haven't seen data on unemployment claims by education).
A more educated labor force is a positive for the future.
On COVID-19 Seasonality
by Calculated Risk on 3/10/2020 09:55:00 AM
The Flu is seasonal. There are research papers on why this happens, and it is very possible that COVID-19 will be seasonal too.
Here is an optimistic paper that suggests seasonality: Temperature and Latitude Analysis to Predict Potential Spread and Seasonality for COVID-19
A significant number of infectious diseases display seasonal patterns in their incidence, including human coronaviruses. We hypothesize that SARS-CoV-2 does as well. To date, Coronavirus Disease 2019 (COVID-19), caused by SARS-CoV-2, has established significant community spread in cities and regions only along a narrow east west distribution roughly along the 30-50 N” corridor at consistently similar weather patterns (5-11OC and 47-79% humidity). ...
 Click on graph for larger image.
Because of geographical proximity and significant travel connections, epidemiological modeling of the epicenter predicted that regions in Southeast Asia, and specifically Bangkok would follow Wuhan, and China in the epidemic.7 However, the establishment of community transmission has occurred in a consistent east and west pattern. The new epicenters of virus were all roughly along the 30-50o N” zone; to South Korea, Japan, Iran, and Northern Italy. After the unexpected emergence of a large outbreak in Iran, we first made this map in late February. Since then new areas with significant community transmission include the Northwestern United States and France. Notably, during the same time, COVID-19 failed to spread significantly to countries immediately south of China. The number of patients and reported deaths in Southeast Asia is much less when compared to more temperate regions noted above.This suggests temperature and humidity may be factors in the spread of COVID-19. If this is the case, then the spread of the disease might slow sharply in May.
This is a possibility, but not a certainty. If there is seasonality, we need to prepare for a resurgence of the disease in the Fall.
Small Business Optimism Increased Slightly in February
by Calculated Risk on 3/10/2020 08:46:00 AM
Most of this survey is noise, but there is some information, especially on the labor market and the "Single Most Important Problem".
From the National Federation of Independent Business (NFIB): February 2020 Report
Small business owners expressed slightly higher levels of optimism in February with the NFIB Optimism Index moving up 0.2 points to 104.5 ...
..
Strong job creation continued in February, with an average addition of 0.43 workers per firm, adding to a strong 1st quarter of 2020. Finding qualified workers remains the top issue with 25 percent reporting this as their number one problem.
emphasis added
 Click on graph for larger image.
This graph shows the small business optimism index since 1986.
The index increased to 104.5 in February.
Note: Usually small business owners complain about taxes and regulations (currently 2nd and 3rd on the "Single Most Important Problem" list). However, during the recession, "poor sales" was the top problem. Now the difficulty of finding qualified workers is the top problem.
Monday, March 09, 2020
Seattle Real Estate in February: Sales up 5.2% YoY, Inventory down 32.5% YoY
by Calculated Risk on 3/09/2020 04:47:00 PM
The Northwest Multiple Listing Service reported NWMLS brokers report brisk activity, noting “too early to tell” if coronavirus will soften sales
“It’s still too early to tell if the broadening effects of the coronavirus will sideline buyers,” said Matthew Gardner, chief economist at Windermere Real Estate. “What we do know is that news of the virus led equity markets sharply lower and this caused mortgage rates to drop significantly. Therefore, the question is whether buyers will put their search on hold until the virus has abated, or if they will decide to move forward so they don’t miss out on near historic low mortgage rates,” he added.There were 5,265 sales in February 2020, up 2.3% from 5,145 sales in February 2019.
...
Inventory remained tight. At month end, there were 7,655 active listings in the 23 counties included in the MLS report. That was a 32% drop from the year ago total of 11,275. All but two counties (San Juan and Douglas) reported declines. Thurston County had the largest year-over-year drop, at 45.7%, followed by Snohomish (down 42%) and King (down 40.7%).
There is only 1.45 months of supply area-wide, according to Northwest MLS data.
emphasis added
The press release is for the Northwest. In King County, sales were up 5.4% year-over-year, and active inventory was down 40.7% year-over-year.
In Seattle, sales were up 5.2% year-over-year, and inventory was down 32.5% year-over-year.. This puts the months-of-supply in Seattle at just 1.3 months.
Black Knight Mortgage Monitor for January; "Cash-out lending hit a more than 10-year high at the end of 2019"
by Calculated Risk on 3/09/2020 01:43:00 PM
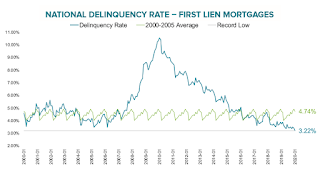
Black Knight released their Mortgage Monitor report for January last week. According to Black Knight, 3.22% of mortgages were delinquent in January, down from 3.75% in January 2019. Black Knight also reported that 0.46% of mortgages were in the foreclosure process, down from 0.51% a year ago.
This gives a total of 3.73% delinquent or in foreclosure.
Press Release: Black Knight Mortgage Monitor: Despite 6.5-Year High in Refinance Lending, Servicers Struggle to Retain and Recapture Borrowers; 80% of Refinance Borrower Business Lost
Today, the Data & Analytics division of Black Knight, Inc. released its latest Mortgage Monitor Report, based upon the company’s industry-leading mortgage performance, housing and public records datasets. This month, in light of a marked increase in refinance activity in Q4 2019, Black Knight looked into servicers’ retention of refinancing borrowers. As Black Knight Data & Analytics President Ben Graboske explained, despite refinance lending hitting a 6.5-year high, servicers are facing challenges in retaining the business of refinancing borrowers.
“Despite a surge in refinance lending driven by low rates, servicers continue to struggle in their efforts to recapture refinancing borrowers, with only one in five being retained by servicers in Q4 2019,” said Graboske. “Retention rates rose along with refinance volumes early last year, hitting an 18-month high in Q2 2019, but retention rates have since fallen in each of the past two quarters. Fewer than one in four borrowers refinancing to lower their rate or term – business which has been historically easier to retain – stayed with their servicer post-refinance in Q4 2019. A large driver has been a recent failure to retain 2018 vintage mortgages, which goes to show just how quickly lender/borrower relationships can evaporate without the right data and tools for servicers to early on identify clients in their portfolios with sufficient tappable equity, and act to retain them. Borrowers who left for ‘greener pastures’ received an average 0.08% lower interest rate than those who stayed, strengthening the need for tools to ensure rate pricing is competitive. Retention challenges are even more pronounced among cash-out refinances, for which retention rates fell from 19% in Q3 2019 to just 17% in Q4 2019, the lowest in more than four years. At the same time, cash-out lending hit a more than 10-year high at the end of 2019, with some 600,000 borrowers pulling an estimated $41B in equity from their homes, the largest quarterly volume since 2007.
“Lenders and servicers should take note – there are currently 44.7 million homeowners with equity available to tap via cash-out refinance or HELOC, with the average homeowner having $119K in equity. At $6.2 trillion, total tappable equity – the amount available to homeowners with mortgages to borrow against while still retaining at least 20% equity in their homes – hit its highest year-end total on record. What’s more, the same falling interest rates that have reheated the housing market have also increased the rate of equity growth for the third consecutive quarter. Tappable equity grew 9.0% year-over-year in Q4 2019, the highest such growth rate since Q3 2018. Refinance lending is up 250% year-over-year, cash-out lending is at a 10-year high and 75% of homeowners with tappable equity have first lien interest rates at or above today’s prevailing rate. Taking all of this into account, improving the retention and recapture of this business is of critical importance. Data-driven portfolio retention strategies that help determine borrowers’ motivations for refinancing can go a long way in this regard.”
emphasis added
 Click on graph for larger image.
Here is a graph from the Mortgage Monitor that shows the National Delinquency Rate.
From Black Knight:
• Mortgage delinquencies fell by 5.4% month-over month to the lowest level on record since Black Knight began reporting the metric in 2000The second graph shows Black Knight's estimate of equity withdrawn (cash-out):
• At 3.22%, the national delinquency rate is down 14% from the same time last year
• With annual declines picking up in recent months and tax refund season on the horizon, we could see delinquencies push downward even further

• Approximately 600K homeowners pulled $41 billion in equity via cash-outs in Q4, the largest such volume since mid-2009There is much more in the mortgage monitor.
• With rates falling below 3.5% in early 2020, cash-out refinance activity is likely to remain strong in coming months
• Cash-out origination volumes have increased in each of the past three quarters
• However, outsized growth in rate/term lending has suppressed the cash-out share of refinance lending, which edged below 50% in Q4 2019 for the first time in three years
Going on Recession Watch
by Calculated Risk on 3/09/2020 11:39:00 AM
I'm not forecasting a recession, just moving to Recession Watch for the first time since 2006. Note: In early 2007, I moved from Recession Watch to forecasting a recession that started in December 2007.
As I noted in Predicting the Next Recession, the usual leading indicators are not useful if there is "a pandemic, significant military conflict, disruption of energy supplies for any reason, a major natural disaster (meteor strike, super volcano, etc), and a number of other low probability reasons".
The reason I'm moving to Recession Watch now is a combination of the COVID-19 pandemic, and the response to the pandemic of the current administration.
Leadership is key in a crisis. Information should be clear, transparent, and accurate. Action should be proactive.
Usually the CDC leads the world in responding to a health crisis. However, the CDC was caught flat-footed this time. Testing for COVID-19 should already be ubiquitous and free for all (not just those with insurance). It appears testing will increase dramatically over the next several weeks, but the administration still needs to make testing free for all (otherwise the uninsured will avoid the test and spread the disease).
And the administration should have fiscal policies ready to go to address the economic impact of the health crisis. Here are my suggestions: Fiscal Policies to Address COVID-19. There is news out this morning that White House advisers will have a list of policy options for Mr. Trump today. My sense is the administration will slow track a fiscal response and try to embrace ineffective policies. For example, enacting corporate tax cuts would be bad policy - it would take many months to have an impact, and the cuts would target the wrong segment of the economy.
Before predicting a recession, we need to see how this unfolds. Perhaps COVID-19 will be seasonal like the flu and the economy will bounce back in the Summer. If that is the case, we will have time to prepare for a probable resurgence of the disease in the Fall. But that is a thin thread to pin our hopes.
Oil Prices
by Calculated Risk on 3/09/2020 09:37:00 AM
From CNBC: Oil prices plunge as much as 30% after OPEC deal failure sparks price war
Oil prices plunged after OPEC’s failure to strike a deal with its allies regarding production cuts caused Saudi Arabia to slash its prices as it reportedly gets set to ramp up production, leading to fears of an all-out price war.
 Click on graph for larger image
The first graph shows WTI spot oil prices from the EIA. (Prices today added).
According to Bloomberg, WTI is at $32.55 per barrel today, and Brent is at $35.68.
Prices collapsed in 2008 due to the financial crisis, and then increased as the economy recovered. Oil prices collapsed again in 2014 and 2015, mostly due to oversupply.
Currently demand has weakened due to the COVID-19 pandemic, and Saudi Arabia is apparently going to increase production.
 The second graph shows the year-over-year change in WTI based on data from the EIA.
Six times since 1987, oil prices have increased 100% or more YoY. And several times prices have almost fallen in half YoY.
Currently WTI is down 42% year-over-year.
Weather Adjusted Employment Gains in February
by Calculated Risk on 3/09/2020 08:39:00 AM
The weather boosted employment gains in again in February. The question is: how much?
The BLS reported 190 thousand people were employed in non-agriculture industries, with a job, but not at work due to bad weather. The average for February over the previous 10 years was 380 thousand. The median was 294 thousand.
The BLS also reported 667 thousand people were usually full time employees, but were working part time in February due to bad weather. The average for February over the previous 10 years was 2.02 million. The median was 1.08 million.
Both of the series suggest weather negatively impacted employment less than usual (boosting seasonally adjusted employment).
The San Francisco Fed estimates Weather-Adjusted Change in Total Nonfarm Employment (monthly change, seasonally adjusted). They use local area weather to estimate the impact on employment. For February, the BLS reported 273 thousand jobs added, the San Francisco Fed estimates that weather adjusted employment gains were 240 thousand. Still solid, but there have been weather related gains the last three months of close to 160 thousand.
So we should expect some payback in coming months.
Sunday, March 08, 2020
Sunday Night Futures; Oil Prices Collapse
by Calculated Risk on 3/08/2020 06:18:00 PM
For health updates please see the CDC website: Coronavirus Disease 2019.
A huge economic story is the collapse in oil prices.
Weekend:
• Schedule for Week of March 8, 2020
• Fiscal Policies to Address COVID-19
Monday:
• No major economic releases scheduled.
From CNBC: Pre-Market Data and Bloomberg futures: S&P 500 are down 112 and DOW futures are down 930 (fair value).
Oil prices were down over the last week with WTI futures at $30.23 per barrel and Brent at $31.97 barrel. A year ago, WTI was at $56, and Brent was at $66 - so oil prices are down about 50% year-over-year.
Here is a graph from Gasbuddy.com for nationwide gasoline prices. Nationally prices are at $2.36 per gallon. A year ago prices were at $2.47 per gallon, so gasoline prices are down 11 cents per gallon year-over-year.


