by Calculated Risk on 3/17/2020 05:38:00 PM
Tuesday, March 17, 2020
COVID-19 Tests per Day
Tests per day is a key number to track (along with actual cases and, sadly, deaths). But total tests were a key for South Korea slowing the spread of COVID-19. South Korea has been conducting 15,000 tests per day with about one-fifth of the US population, so the US needs to test 70,000 to 100,000 per day.
The last two days, the US has average 13,000 tests per day. Those are still rookie numbers, and the US needs the ability to conduct about 5 times as many tests.

This data is from the COVID Tracking Project.
Testing it getting better, but is still far too low.
Test. Test. Test.
Stay Healthy!
BLS: Job Openings increased to 7.0 Million in January
by Calculated Risk on 3/17/2020 10:19:00 AM
From the BLS: Job Openings and Labor Turnover Summary
The number of job openings rose to 7.0 million (+411,000) on the last business day of January, the U.S. Bureau of Labor Statistics reported today. Over the month, hires and separations were little changed at 5.8 million and 5.6 million, respectively. Within separations, the quits rate was unchanged at 2.3 percent and the layoffs and discharges rate was little changed at 1.1 percent. ...The following graph shows job openings (yellow line), hires (dark blue), Layoff, Discharges and other (red column), and Quits (light blue column) from the JOLTS.
The number of quits was little changed in January at 3.5 million and the rate was unchanged at 2.3 percent. The quits level was little changed for total private but fell for government (-18,000). Quits decreased in other services (-46,000), state and local government education (-12,000), and federal government (-5,000). The quits level increased in real estate and rental and leasing (+14,000).
emphasis added
This series started in December 2000.
Note: The difference between JOLTS hires and separations is similar to the CES (payroll survey) net jobs headline numbers. This report is for January, the most recent employment report was for February.
 Click on graph for larger image.
Note that hires (dark blue) and total separations (red and light blue columns stacked) are pretty close each month. This is a measure of labor market turnover. When the blue line is above the two stacked columns, the economy is adding net jobs - when it is below the columns, the economy is losing jobs.
Jobs openings increased in January to 6.963 million from 6.552 million in December.
The number of job openings (yellow) are down 7% year-over-year.
Quits are up slightly year-over-year. These are voluntary separations. (see light blue columns at bottom of graph for trend for "quits").
Job openings are at a solid level, but have been declining - and are down 7% year-over-year. Quits are still increasing year-over-year. However this was for January - the picture will change sharply in March and April.
NAHB: Builder Confidence Decreased to 72 in March
by Calculated Risk on 3/17/2020 10:06:00 AM
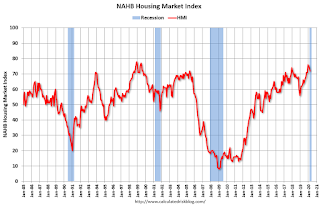
The National Association of Home Builders (NAHB) reported the housing market index (HMI) was at 72, down from 74 in February. Any number above 50 indicates that more builders view sales conditions as good than poor.
From NAHB: Builder Confidence Declines But Remains Solid Amid Rising Risks
Builder confidence in the market for newly-built single-family homes fell two points to 72 in March, according to the latest NAHB/Wells Fargo Housing Market Index (HMI) released today. Sentiment levels have held in a firm range in the low- to mid-70s for the past six months.
“Builder confidence remains solid, although sales expectations for the next six months dropped four points on economic uncertainty stemming from the coronavirus,” said NAHB Chairman Dean Mon. “Interest rates remain low, and a lack of inventory creates market opportunities for single-family builders.”
“It is important to note that half of the builder responses in the March HMI were collected prior to March 4, so the recent stock market declines and the rising economic impact of the coronavirus will be reflected more in next month’s report,” said NAHB Chief Economist Robert Dietz. “Overall, 21% of builders in the survey report some disruption in supply due to virus concerns in other countries such as China. However, the incidence is higher (33%) among builders who responded to the survey after March 6, indicating that this is an emerging issue.”
...
The HMI index gauging current sales conditions fell two points to 79, the component measuring sales expectations in the next six months dropped four points to 75 and the gauge charting traffic of prospective buyers also decreased one point to 56.
Looking at the three-month moving averages for regional HMI scores, the Midwest fell two points to 66, the South moved one point lower to 77 and the West posted a one-point decline to 82. The Northeast rose two points to 64.
emphasis added
 Click on graph for larger image.
This graph show the NAHB index since Jan 1985.
This was slightly below the consensus forecast, but still another very strong reading. However, this survey was largely prior to the impact of COVID-19.
Note: The graph shows the 2020 recession starting in March 2020.
Industrial Production Increased in February
by Calculated Risk on 3/17/2020 09:22:00 AM
From the Fed: Industrial Production and Capacity Utilization
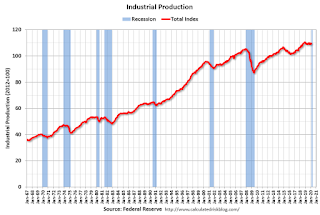
Industrial production rose 0.6 percent in February after falling 0.5 percent in January. Manufacturing output edged up 0.1 percent in February; excluding a large gain for motor vehicles and parts and a large drop for civilian aircraft, factory output was unchanged. The index for mining declined 1.5 percent, but the index for utilities jumped 7.1 percent, as temperatures returned to more typical levels following an unseasonably warm January. At 109.6 percent of its 2012 average, the level of total industrial production in February was unchanged from a year earlier. Capacity utilization for the industrial sector increased 0.4 percentage point in February to 77.0 percent, a rate that is 2.8 percentage points below its long-run (1972–2019) average.
emphasis added
 Click on graph for larger image.
This graph shows Capacity Utilization. This series is up 10.3 percentage points from the record low set in June 2009 (the series starts in 1967).
Capacity utilization at 77.0% is 2.8% below the average from 1972 to 2017 and below the pre-recession level of 80.8% in December 2007.
Note: y-axis doesn't start at zero to better show the change.
 The second graph shows industrial production since 1967.
Industrial production increased in February to 109.6. This is 25.9% above the recession low, and 4.0% above the pre-recession peak.
The change in industrial production was above consensus expectations.
Note: The graphs show the 2020 recession starting in March 2020.
Retail Sales decreased 0.5% in February
by Calculated Risk on 3/17/2020 08:36:00 AM
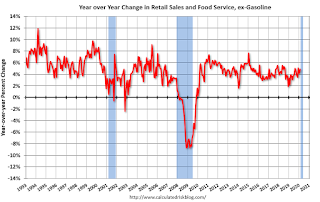
On a monthly basis, retail sales decreased 0.5 percent from January to February (seasonally adjusted), and sales were up 4.3 percent from February 2019.
From the Census Bureau report:
Advance estimates of U.S. retail and food services sales for February 2020, adjusted for seasonal variation and holiday and trading-day differences, but not for price changes, were $528.1 billion, a decrease of 0.5 percent from the previous month, but 4.3 percent above February 2019.
emphasis added
 Click on graph for larger image.
This graph shows retail sales since 1992. This is monthly retail sales and food service, seasonally adjusted (total and ex-gasoline).
Retail sales ex-gasoline were down 0.3% in February.
The second graph shows the year-over-year change in retail sales and food service (ex-gasoline) since 1993.
 Retail and Food service sales, ex-gasoline, increased by 4.9% on a YoY basis.
The decrease in February was well below expectations, however sales in December and January were revised up, combined.
Note: The graphs show the 2020 recession starting in March 2020.
Monday, March 16, 2020
Tuesday: Retail Sales, Industrial Production, Homebuilder Survey, Job Openings
by Calculated Risk on 3/16/2020 06:59:00 PM
The retail sales and industrial production data is for February (pre-crisis), but the homebuilder survey was taken in March - and might show a sharp decline.
Tuesday:
• At 8:30 AM ET, Retail sales for February is scheduled to be released. The consensus is for a 0.2% increase in retail sales.
• At 9:15 AM, The Fed will release Industrial Production and Capacity Utilization for February. The consensus is for a 0.4% increase in Industrial Production, and for Capacity Utilization to increase to 77.0%.
• At 10:00 AM, The March NAHB homebuilder survey. The consensus is for a reading of 74, unchanged from 74. Any number above 50 indicates that more builders view sales conditions as good than poor.
• At 10:00 AM, Job Openings and Labor Turnover Survey for January from the BLS.
Thanks to All the Heroes!
by Calculated Risk on 3/16/2020 04:57:00 PM
Let's thank all the heroes in this fight. Especially the healthcare workers that are at serious risk (two ER doctors are in critical condition) and the first responders.
Let's also thank all the people working at the grocery stores and pharmacies - and working in the supply chain to keep us fed and bring us goods.
And all the people working at the restaurants (it will probably be just pickup and delivery soon) and delivery people bringing other goods.
And all the people going to work practicing safe distancing (please keep making toilet paper!).
And for the utility workers keeping the power on and the internet working.
And all the people working from home.
And all the people staying at home are heroes too.
Thank you!
Update: Decline in Restaurant Traffic
by Calculated Risk on 3/16/2020 01:24:00 PM
There are some sectors that will be hit hard over the next several months: hotels, airlines, restaurants, movie theaters, sporting events, and convention centers. People will probably avoid these places as part of social distancing.
Here is some restaurant data from OpenTable:

This data shows the year-over-year change in diners as tabulated by OpenTable for the US, the states of Washington and New York, and a few impacted cities (Seattle, San Francisco, and Boston).
This data is updated through March 15, 2020.
Seattle and San Francisco saw a dramatic decline starting at the beginning of March. Starting a few days ago, restaurant traffic is declining sharply just about everywhere.
As of yesterday, San Francisco was off 72% YoY, Boston was off 70% YoY, and Seattle was off 62%. Going forward, restaurants are closing in many states (or going to half occupancy).
Clearly the US will need to help the employees (and owners) of these impacted sectors.
BLS: January Unemployment rates at New Series Lows in Six States
by Calculated Risk on 3/16/2020 10:26:00 AM
From the BLS: Regional and State Employment and Unemployment Summary
Unemployment rates were lower in January in 5 states and stable in 45 states and the District of Columbia, the U.S. Bureau of Labor Statistics reported today. Eleven states had jobless rate decreases from a year earlier, 1 state had an increase, and 38 states and the District had little or no change. The national unemployment rate, 3.6 percent, was little changed over the month but was 0.4 percentage point lower than in January 2019.
...
North Dakota had the lowest unemployment rate in January, 2.3 percent, while Alaska had the highest rate, 6.0 percent. The rates in Alaska (6.0 percent), Illinois (3.5 percent), Nevada (3.6 percent), New York (3.8 percent), Oregon (3.3 percent), and Washington (3.9 percent) set new series lows. (All state series begin in 1976.)
emphasis added
 Click on graph for larger image.
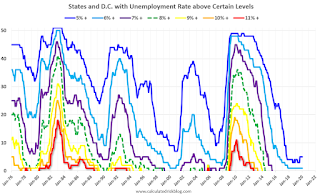
This graph shows the number of states (and D.C.) with unemployment rates at or above certain levels since January 1976.
At the worst of the great recession, there were 11 states with an unemployment rate at or above 11% (red).
Currently only one state, Alaska, has an unemployment rate at or above 6% (dark blue). Note that Alaska is at a series low (since 1976). Four states and the D.C. have unemployment rates above 5%; Alaska, Louisiana, Mississippi and West Virginia.
A total of seventeen states are at a series low: Alabama, Alaska, Arkansas, California, Colorado, Florida, Georgia, Idaho, Illinois, Maryland, Nevada, New York, North Dakota, Oregon, South Carolina, Tennessee and Washington
NY Fed: Manufacturing "Business activity declined in New York State", Headline Fell Sharply
by Calculated Risk on 3/16/2020 08:37:00 AM
From the NY Fed: Empire State Manufacturing Survey
Business activity declined in New York State, according to firms responding to the March 2020 Empire State Manufacturing Survey. The headline general business conditions index fell thirty-four points to -21.5, its lowest level since 2009. The new orders index dropped to -9.3, pointing to a decline in orders, and the shipments index fell to -1.7. Delivery times lengthened slightly, and inventories increased. Employment levelled off, and the average workweek declined. Input price increases were little changed, while selling prices increased at a slower pace than last month. Optimism about the six-month outlook fell sharply, with firms less optimistic than they have been since 2009.This was well below the consensus forecast, and the outlook is the worst since 2009.
...
The index for number of employees fell eight points to -1.5, indicating that employment levels were little changed over the month. The average workweek fell to -10.6, a sign that the average workweek was shorter.
emphasis added


