by Calculated Risk on 3/20/2020 01:28:00 PM
Friday, March 20, 2020
Comments on February Existing Home Sales
Earlier: NAR: Existing-Home Sales Increased to 5.77 million in February
A few key points:
1) This is pre-crisis data. Sales will decline sharply in March and April.
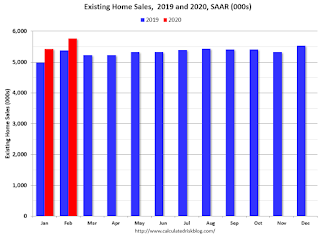
2) Existing home sales were up 7.2% year-over-year (YoY) in February.
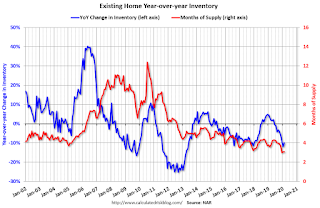
2) Inventory is very low, and was down 9.8% year-over-year (YoY) in February. Inventory will probably stay low in March as people wait to list their homes.

Sales will probably be down sharply year-over-year in March and April.
Note that existing home sales picked up somewhat in the second half of 2019 as interest rates declined.

Sales NSA in February (335,000) were the highest for January since 2017.
Note that sales have been in the middle of the range recently - not absurdly high like in 2005, and not depressed like in 2010 and 2011.
Overall this was a solid report. Now, with the pandemic, sales will decline sharply.
CDC: Seasonal Flu Activity Slowing
by Calculated Risk on 3/20/2020 11:25:00 AM
Seasonal flu activity is slowing, and that will help with the rapidly increasing COVID-19 pandemic.
From the CDC: Weekly U.S. Influenza Surveillance Report
Laboratory confirmed flu activity as reported by clinical laboratories continued to decrease; however, influenza-like illness activity increased. Influenza severity indicators remain moderate to low overall, but hospitalization rates differ by age group, with high rates among children and young adults.Note that ILI (influenza-like illness) activity is increasing due to COVID-19.
…
Nationally, the percent of specimens testing positive for influenza at clinical laboratories continued to decrease while ILI activity increased for the second week in a row after declining for three weeks. Due to the ongoing COVID-19 pandemic, more people may be seeking care for respiratory illness than usual at this time.
 Click on graph for larger image.
This graph from the CDC shows the number of positive specimens, and the percent of tests positive.
Social distancing will help lower flu activity too. And fewer patients with the flu is a positive for healthcare workers.
NAR: Existing-Home Sales Increased to 5.77 million in February
by Calculated Risk on 3/20/2020 10:10:00 AM
From the NAR: Existing-Home Sales Jump 6.5% in February
Existing-home sales climbed substantially in February after a slight decline in January, according to the National Association of Realtors®. Of the four major regions, only the Northeast reported a drop in sales, while other areas saw increases, including sizable sales gains in the West.
Total existing-home sales, completed transactions that include single-family homes, townhomes, condominiums and co-ops, rose 6.5% from January to a seasonally-adjusted annual rate of 5.77 million in February. Additionally, for the eighth straight month, overall sales greatly increased year-over-year, up 7.2% from a year ago (5.38 million in February 2019)..
...
Total housing inventory at the end of February totaled 1.47 million units, up 5.0% from January, but down 9.8% from one year ago (1.63 million). Unsold inventory sits at a 3.1-month supply at the current sales pace, equal to the supply recorded in January and down from the 3.6-month figure recorded in February 2019.
emphasis added
 Click on graph for larger image.
This graph shows existing home sales, on a Seasonally Adjusted Annual Rate (SAAR) basis since 1993.
Sales in February (5.77 million SAAR) were up 6.5% from last month, and were 7.2% above the February 2019 sales rate.
The second graph shows nationwide inventory for existing homes.
 According to the NAR, inventory increased to 1.47 million in February from 1.40 million in January. Headline inventory is not seasonally adjusted, and inventory usually decreases to the seasonal lows in December and January, and peaks in mid-to-late summer.
The last graph shows the year-over-year (YoY) change in reported existing home inventory and months-of-supply. Since inventory is not seasonally adjusted, it really helps to look at the YoY change. Note: Months-of-supply is based on the seasonally adjusted sales and not seasonally adjusted inventory.
 Inventory was down 9.8% year-over-year in February compared to February 2019.
 Months of supply was unchanged at 3.1 months in February.
This was above the consensus forecast. I'll have more later …
Note: These number are pre-crisis, and everything will change in the March and April numbers.
Thursday, March 19, 2020
Friday: Existing Home Sales
by Calculated Risk on 3/19/2020 07:45:00 PM
This report is for February, and sales were probably solid. However sales will slow down in March, and are likely to really collapse in April.
Friday:
• At 10:00 AM ET, Existing Home Sales for February from the National Association of Realtors (NAR). The consensus is for 5.50 million SAAR, up from 5.46 million.
Housing economist Tom Lawler expects the NAR will report sales of 5.58 million.
March 19 Update: US COVID-19 Tests per Day
by Calculated Risk on 3/19/2020 04:36:00 PM
Tests per day is a key number to track (along with actual cases and, sadly, deaths). But total tests were a key for South Korea slowing the spread of COVID-19. South Korea has been conducting 15,000 tests per day with about one-fifth of the US population, so the US needs to test 70,000 to 100,000 per day.
The US conducted 27,450 tests in the last 24 hours. That is progress.

This data is from the COVID Tracking Project. Some states could do a better job of reporting the number of tests - so this is probably low.
Testing it getting better, but needs to at least triple from here.
Hopefully I'll be changing the y-axis scale soon.
Test. Test. Test.
Stay Healthy!
Update: Decline in Restaurant Traffic
by Calculated Risk on 3/19/2020 01:11:00 PM
There are some sectors that will be hit hard over the next several months: hotels, airlines, restaurants, movie theaters, sporting events, and convention centers. People will probably avoid these places as part of social distancing.
Thanks to OpenTable for providing this restaurant data:

This data shows the year-over-year change in diners as tabulated by OpenTable for the US, the states of Washington and New York, and a few impacted cities (Seattle, San Francisco, and Boston).
This data is updated through March 18, 2020.
The US was off 91% YoY as of yesterday.
San Francisco, Boston and Seattle are off 100%. Going forward, restaurants have close in most states (except take out and pick up)
The laggards are Oklahoma (off 70%), Hawaii (off 71%) and Alabama (off 78%).
When the crisis is ending, I'll post this data again.
Sacramento Housing in February: Sales Unchanged YoY, Active Inventory down 28.7% YoY
by Calculated Risk on 3/19/2020 11:57:00 AM
The housing market will slow soon, but here are the stats from February. Note that the median sales price finally passed the previous high in August 2005 (almost 15 years ago, and not adjusted for inflation).
From SacRealtor.org: February 2020 Statistics – Sacramento Housing Market – Single Family Homes
February closed with 1,014 sales, up 7.4% from the 944 sales in January. Compared to one year ago (1,015), the current figure nearly unchanged.1) Overall sales decreased to 1,014 in February, down 1 from 1015 in February 2019. Sales were up from January 2020 (previous month), and essentially unchanged from February 2019.
...
The Active Listing Inventory increased .9% from January to February, from 1,409 units to 1,422 units. Compared with February 2019 (1,994), inventory is down 28.7%. The Months of Inventory decreased from 1.5 to 1.4 Months. This figure represents the amount of time (in months) it would take for the current rate of sales to deplete the total active listing inventory.
...
The Median DOM (days on market) decreased from 17 to 10 and the Average DOM decreased from 33 to 29. “Days on market” represents the days between the initial listing of the home as “active” and the day it goes “pending.”
emphasis added
2) Active inventory was at 1,422, down from 1,994 in February 2019. That is down 28.7% year-over-year. This is the tenth consecutive month with a YoY decline in inventory, following 20 months of YoY increases in inventory.
Hotels: Occupancy Rate Declined 24.4% Year-over-year
by Calculated Risk on 3/19/2020 10:43:00 AM
From HotelNewsNow.com: STR: US hotel results for week ending 14 March
Showing further COVID-19 impact, the U.S. hotel industry reported negative year-over-year results in the three key performance metrics during the week of 8-14 March 2020, according to data from STR.The following graph shows the seasonal pattern for the hotel occupancy rate using the four week average.
In comparison with the week of 10-16 March 2019, the industry recorded the following:
• Occupancy: -24.4% to 53.0%
• Average daily rate (ADR): -10.7% to US$120.30
• Revenue per available room (RevPAR): -32.5% to US$63.74
Performance declines were uniform across chain scales, classes and location types.
“To no surprise, the hurt continued and intensified for hotels around the country,” said Jan Freitag, STR’s senior VP of lodging insights. “The performance declines were especially pronounced in hotels that cater to meetings and group business, which is a reflection of the latest batch of event cancellations and government guidance to restrict the size of gatherings.
“The questions we are hearing the most right now are around how far occupancy will drop and how long this will last. Through comparative analysis of the occupancy trends in China and Italy over the past weeks, we can with certainty say that we are not yet close to the bottom in the U.S. However, the timeline for that decline and the eventual recovery are much tougher to predict because there is still so much uncertainty around the COVID-19 case numbers in the U.S. and how serious citizens are when practicing social distancing. China and Italy saw a more abrupt decline in occupancy because of stricter lockdowns. That will dictate the speed of recovery.”
emphasis added
 Click on graph for larger image.
The red line is for 2020, dash light blue is 2019, blue is the median, and black is for 2009 (the worst year probably since the Great Depression for hotels).
2020 was off to a solid start, however, COVID-19 is now significantly impacting occupancy.
It is likely the four week average will drop below the 2009 average during the crisis.
Philly Fed "Current Manufacturing Indicators Show a Weakening in Activity in March"
by Calculated Risk on 3/19/2020 08:45:00 AM
From the Philly Fed: Current Manufacturing Indicators Show a Weakening in Activity in March
Manufacturing firms reported a significant weakening in regional manufacturing activity this month, according to results from the Manufacturing Business Outlook Survey. The survey’s current indicators for general activity, new orders, and shipments fell precipitously this month, coinciding with developments related to the coronavirus. The firms reported a slight overall increase in employment, however, and a near-steady workweek. The broadest indicator of future activity weakened somewhat but remained elevated; however, firms still expect overall growth in new orders, shipments, and employment over the next six months.This was well below the consensus forecast. Here is a graph comparing the regional Fed surveys and the ISM manufacturing index:
The diffusion index for current activity declined markedly from a three-year high reading of 36.7 in February to -12.7 this month, its lowest reading since July 2012 … The firms reported an overall slight increase in manufacturing employment this month, but the current employment index decreased 6 points to 4.1, its lowest reading since November 2016. The average workweek index fell 10 points but remained slightly positive at 0.5.
emphasis added
 Click on graph for larger image.
The New York and Philly Fed surveys are averaged together (yellow, through March), and five Fed surveys are averaged (blue, through February) including New York, Philly, Richmond, Dallas and Kansas City. The Institute for Supply Management (ISM) PMI (red) is through February (right axis).
These early reports suggest the ISM manufacturing index will decline significantly in March.
Weekly Initial Unemployment Claims Increase to 281,000
by Calculated Risk on 3/19/2020 08:35:00 AM
Note: Claims for this week (reported next Thursday) will be extremely high.
The DOL reported:
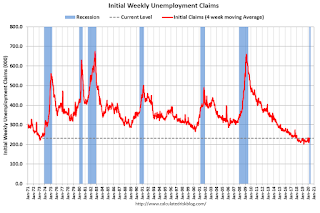
In the week ending March 14, the advance figure for seasonally adjusted initial claims was 281,000, an increase of 70,000 from the previous week's unrevised level of 211,000. This is the highest level for initial claims since September 2, 2017 when it was 299,000. The 4-week moving average was 232,250, an increase of 16,500 from the previous week's revised average. This is the highest level for this average since January 27, 2018 when it was 234,500. The previous week's average was revised up by 1,750 from 214,000 to 215,750.The previous week was unrevised.
emphasis added
The following graph shows the 4-week moving average of weekly claims since 1971.
 Click on graph for larger image.
The dashed line on the graph is the current 4-week average. The four-week average of weekly unemployment claims increased to 232,250.
This was lower than the consensus forecast.
Note: Companies have just started announcing layoffs related to COVID-19. So we should expect weekly claims to increase to record levels next week.


