by Calculated Risk on 1/27/2021 12:24:00 PM
Wednesday, January 27, 2021
House Prices and Median Household Income
One of the metrics we'd like to follow is a ratio of house prices to incomes. Unfortunately most income data is released with a significantly lag, and there are always questions about which income data to use (the average total income is skewed by the income of a few people).
And for key measures of house prices - like Case-Shiller - we have indexes, not actually prices.
But we can construct a ratio of the house price indexes to some measure of income.
Last October I posted House Prices to National Average Wage Index. Here is another measure - house prices to the Median Household income.
This graph uses the year end Case-Shiller house price index - and the nominal median household income through 2019 (from the Census Bureau). 2020 median income is estimated at a 5% gain.

This graph shows the ratio of house price indexes divided by the Median Household Income through 2020 (the HPI is first multiplied by 1000).
This uses the year end National Case-Shiller index since 1976 (December 2020 estimated).
DOT: Vehicle Miles Driven decreased 10.3% year-over-year in November
by Calculated Risk on 1/27/2021 09:48:00 AM
The Department of Transportation (DOT) reported:
Travel on all roads and streets changed by -11.1% (-28.9 billion vehicle miles) for November 2020 as compared with November 2019. Travel for the month is estimated to be 231.6 billion vehicle miles.
The seasonally adjusted vehicle miles traveled for November 2020 is 244.8 billion miles, a -10.3% (-28.2 billion vehicle miles) decline from November 2019. It also represents -0.7% decline (-1.6 billion vehicle miles) compared with October 2020.
Cumulative Travel for 2020 changed by -13.7% (-410.0 billion vehicle miles). The cumulative estimate for the year is 2,583.1 billion vehicle miles of travel.
emphasis added
 Click on graph for larger image.
This graph shows the rolling 12 month total vehicle miles driven to remove the seasonal factors.
Miles driven declined during the great recession, and the rolling 12 months stayed below the previous peak for a record 85 months.
Miles driven declined sharply in March, and really collapsed in April.
 This graph shows the YoY change in vehicle miles driven.
Miles driven have rebounded, but are still down 10.3% YoY (seasonally adjusted).
MBA: Mortgage Applications Decrease in Latest Weekly Survey
by Calculated Risk on 1/27/2021 07:00:00 AM
From the MBA: Mortgage Applications Decrease in Latest MBA Weekly Survey
Mortgage applications decreased 4.1 percent from one week earlier, according to data from the Mortgage Bankers Association’s (MBA) Weekly Mortgage Applications Survey for the week ending January 22, 2021.
... The Refinance Index decreased 5 percent from the previous week and was 83 percent higher than the same week one year ago. The seasonally adjusted Purchase Index decreased 4 percent from one week earlier. The unadjusted Purchase Index increased 3 percent compared with the previous week and was 16 percent higher than the same week one year ago.
“Mortgage rates were mixed last week, with the 30-year fixed rate rising to its highest level since November 2020 at 2.95 percent, and all other rates in the survey posting a decline. In a sign that borrowers are increasingly more sensitive to higher rates, large declines in government purchase applications and refinance applications pulled overall activity lower. The refinance index has now declined for two straight weeks, but is still 83 percent higher than last year,” said Joel Kan, MBA’s Associate Vice President of Economic and Industry Forecasting. “Purchase applications also decreased last week, but the impressive trend of year-over-year growth since the second half of 2020 has continued in early 2021. Activity was up 16 percent from a year ago, and the average purchase loan amount hit another record high of $395,200. Since hitting a recent low in April 2020, the average purchase loan amount has steadily risen – in line with the accelerating home-price appreciation occurring in most of the country because of strong demand and extremely low inventory levels.”
...
The average contract interest rate for 30-year fixed-rate mortgages with conforming loan balances ($510,400 or less) increased to 2.95 percent from 2.92 percent, with points decreasing to 0.32 from 0.37 (including the origination fee) for 80 percent loan-to-value ratio (LTV) loans.
emphasis added
 Click on graph for larger image.
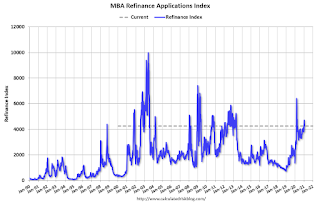
The first graph shows the refinance index since 1990.
The refinance index has been volatile recently depending on rates.
With near record low rates, the index remains up significantly from last year.
 The second graph shows the MBA mortgage purchase index
According to the MBA, purchase activity is up 16% year-over-year unadjusted.
Note: Red is a four-week average (blue is weekly).
Tuesday, January 26, 2021
Wednesday: FOMC Statement
by Calculated Risk on 1/26/2021 09:11:00 PM
On Thursday, from 12:00 - 1:00 (PST), UCI Professor Chris Schwarz returns for the third year to the Irvine Chamber Business Outlook event.
Chris' presentations are great. This is free. Register here
Wednesday:
• At 7:00 AM ET, The Mortgage Bankers Association (MBA) will release the results for the mortgage purchase applications index.
• At 8:30 AM, Durable Goods Orders for December. The consensus is for a 0.9% increase in durable goods.
• At 2:00 PM, FOMC Meeting Announcement. No change to policy is expected at this meeting.
• At 2:30 PM, Fed Chair Jerome Powell holds a press briefing following the FOMC announcement.
January 26 COVID-19 Test Results and Vaccinations; January Now Deadliest Month
by Calculated Risk on 1/26/2021 07:52:00 PM
"Vaccinations in the U.S. began Dec. 14 with health-care workers, and so far 23.5 million shots have been given, according to a state-by-state tally by Bloomberg and data from the Centers for Disease Control and Prevention. In the last week, an average of 1.25 million doses per day were administered."Also check out the graphs at COVID-19 Vaccine Projections The site has several interactive graphs related to US COVID vaccinations including a breakdown of how many have had one shot, and how many have had both shots.
It is possible the 7-day average cases has peaked. Stay safe! I'm looking forward to not posting this data in a few months.
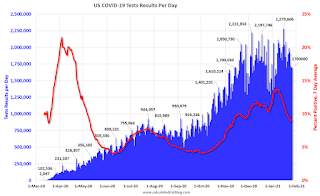
The US is now averaging close to 2 million tests per day. Based on the experience of other countries, for adequate test-and-trace (and isolation) to reduce infections, the percent positive needs to be under 5% (probably close to 1%), so the US has far too many daily cases - and percent positive - to do effective test-and-trace.
There were 1.7 million test results reported over the last 24 hours.
There were 144 thousand positive tests.
Almost 79,000 US deaths have been reported so far in January surpassing December as the deadliest month. See the graph on US Daily Deaths here.
 Click on graph for larger image.
This data is from the COVID Tracking Project.
The percent positive over the last 24 hours was 8.4% (red line is 7 day average). The percent positive is calculated by dividing positive results by total tests (including pending).
And check out COVID Act Now to see how each state is doing. (updated link to new site)
 The second graph shows the 7 day average of positive tests reported and daily hospitalizations.
It is possible cases and hospitalizations have peaked, but are declining from a very high level.
Zillow Case-Shiller House Price Forecast: "Gathering Speed", 10.3% YoY in December
by Calculated Risk on 1/26/2021 04:18:00 PM
The Case-Shiller house price indexes for November were released today. Zillow forecasts Case-Shiller a month early, and I like to check the Zillow forecasts since they have been pretty close.
From Matthew Speakman at Zillow: November Case-Shiller Results & December Forecast: Gathering Speed
Growth in home prices continued to climb in November, gathering speed before the end of the year and setting the stage for a full out sprint in 2021.
...
Buoyed by record-low mortgage rates, which continued to plumb new depths back in November, a wave of eager would-be homebuyers poured into the market, further stoking the competition for homes that has been red-hot since the late spring. Homes flew off the market as a result and prices shot upward at their fastest pace in years. Even as the pandemic accelerated its rapid spread across the country, this fervent market competition has shown few, if any, signs of cooling and is unlikely in the near future. Combined, annual growth in home prices should continue its sharp upward trajectory in the months to come.
Monthly growth in December as reported by Case-Shiller is expected to slow slightly from [November] in all three main indices, while annual growth is expected to accelerate across the board. S&P Dow Jones Indices is expected to release data for the December S&P CoreLogic Case-Shiller Indices on Tuesday, February 23.
emphasis added
 The Zillow forecast is for the year-over-year change for the Case-Shiller National index to be at 10.3% in December, up from 9.5% in November.
 The Zillow forecast is for the 20-City index to be up 9.8% YoY in December from 8.9% in November, and for the 10-City index to increase to be up 9.5% YoY compared to 8.4% YoY in November.
BLS: December Unemployment rates down in 19 States, Higher in 12 States
by Calculated Risk on 1/26/2021 02:41:00 PM
From the BLS: Regional and State Employment and Unemployment Summary
Unemployment rates were lower in December in 19 states, higher in 12 states and the District of Columbia, and stable in 19 states, the U.S. Bureau of Labor Statistics reported today. Forty-five states and the District had jobless rate increases from a year earlier, one state had a decrease, and four states had little or no change. The national unemployment rate, 6.7 percent, was unchanged over the month but was 3.1 percentage points higher than in December 2019.Hawaii and Nevada are being impacted by the lack of tourism.
In December 2020, nonfarm payroll employment increased in 15 states, decreased in 11 states, and was essentially unchanged in 24 states and the District of Columbia. Over the year, nonfarm payroll employment decreased in 48 states and the District and was essentially unchanged in 2 states.
...
Hawaii and Nevada had the highest unemployment rates in December, 9.3 percent and 9.2 percent, respectively. Nebraska and South Dakota had the lowest rates, 3.0 percent each.
January Vehicle Sales Forecast: "Steady in January"
by Calculated Risk on 1/26/2021 12:54:00 PM
From Wards: U.S. Sales to Remain Steady in January But Production Losses Will Hurt Inventory (pay content)

This graph shows actual sales from the BEA (Blue), and Wards forecast for January (Red).
Sales have bounced back from the April low, but will likely be down around 5% year-over-year in January.
The Wards forecast of 16.1 million SAAR, would be down about 1% from December.
Real House Prices and Price-to-Rent Ratio in November
by Calculated Risk on 1/26/2021 10:12:00 AM
Here is the post earlier on Case-Shiller: Case-Shiller: National House Price Index increased 9.5% year-over-year in November
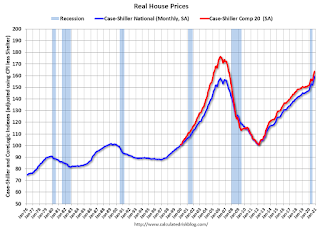
It has been over fourteen years since the bubble peak. In the Case-Shiller release today, the seasonally adjusted National Index (SA), was reported as being 26% above the previous bubble peak. However, in real terms, the National index (SA) is about 1% above the bubble peak (and historically there has been an upward slope to real house prices). The composite 20, in real terms, is still 7% below the bubble peak.
The year-over-year growth in prices increased to 9.5% nationally.
Usually people graph nominal house prices, but it is also important to look at prices in real terms (inflation adjusted). Case-Shiller and others report nominal house prices. As an example, if a house price was $200,000 in January 2000, the price would be close to $292,000 today adjusted for inflation (46%). That is why the second graph below is important - this shows "real" prices (adjusted for inflation).
Nominal House Prices

In nominal terms, the Case-Shiller National index (SA) and the Case-Shiller Composite 20 Index (SA) are both at new all times highs (above the bubble peak).
Real House Prices

In real terms, the National index is back to the bubble peak, and the Composite 20 index is back to early 2005.
In real terms, house prices are at 2005 levels.
Note that inflation was negative for a few months earlier this year, and that also boosted real prices.
Price-to-Rent
In October 2004, Fed economist John Krainer and researcher Chishen Wei wrote a Fed letter on price to rent ratios: House Prices and Fundamental Value. Kainer and Wei presented a price-to-rent ratio using the OFHEO house price index and the Owners' Equivalent Rent (OER) from the BLS.

This graph shows the price to rent ratio (January 2000 = 1.0). The price-to-rent ratio had been moving mostly sideways, but picked up recently.
On a price-to-rent basis, the Case-Shiller National index is back to October 2004 levels, and the Composite 20 index is back to April 2004 levels.
In real terms, prices are back to 2005 levels, and the price-to-rent ratio is back to 2004.
Case-Shiller: National House Price Index increased 9.5% year-over-year in November
by Calculated Risk on 1/26/2021 09:12:00 AM
S&P/Case-Shiller released the monthly Home Price Indices for November ("November" is a 3 month average of September, October and November prices).
This release includes prices for 20 individual cities, two composite indices (for 10 cities and 20 cities) and the monthly National index.
From S&P: S&P CoreLogic Case-Shiller Index Shows Annual Home Price Gains Climbed to 9.5% in November
The S&P CoreLogic Case-Shiller U.S. National Home Price NSA Index, covering all nine U.S. census divisions, reported a 9.5% annual gain in November, up from 8.4% in the previous month. The 10-City Composite annual increase came in at 8.8%, up from 7.6% in the previous month. The 20-City Composite posted a 9.1% year-over-year gain, up from 8.0% in the previous month.
Phoenix, Seattle and San Diego continued to report the highest year-over-year gains among the 19 cities (excluding Detroit) in November. Phoenix led the way with a 13.8% year-over-year price increase, followed by Seattle with a 12.7% increase and San Diego with a 12.3% increase. All 19 cities reported higher price increases in the year ending November 2020 versus the year ending October 2020.
...
The U.S. National Index posted a 1.1% month-over-month increase, while the 10-City and 20-City Composites both posted increases of 1.2% and 1.1% respectively, before seasonal adjustment in November. After seasonal adjustment, the U.S. National Index posted a month-over-month increase of 1.4%, while the 10-City and 20-City Composites both posted increases of 1.4%. In November, all 19 cities (excluding Detroit) reported increases before and after seasonal adjustment.
“The trend of accelerating home prices that began in June 2020 has now reached its sixth month with November’s emphatic report,” says Craig J. Lazzara, Managing Director and Global Head of Index Investment Strategy at S&P Dow Jones Indices. “The National Composite Index gained 9.5% relative to its level a year ago, accelerating from October’s 8.4% increase. The 10- and 20-City Composites (up 8.8% and 9.1%, respectively) also rose more rapidly in November than they had done in October. The housing market’s strength was once again broadly-based: all 19 cities for which we have November data rose, and all 19 gained more in the 12 months ended in November than they had gained in the 12 months ended in October.
emphasis added
 Click on graph for larger image.
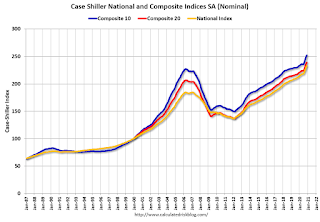
 The first graph shows the nominal seasonally adjusted Composite 10, Composite 20 and National indices (the Composite 20 was started in January 2000).
The Composite 10 index is up 1.4% in November (SA) from October.
The Composite 20 index is up 1.4% (SA) in November.
The National index is 26% above the bubble peak (SA), and up 1.4% (SA) in November. The National index is up 70% from the post-bubble low set in December 2011 (SA).
 The second graph shows the Year over year change in all three indices.
The Composite 10 SA is up 8.8% compared to November 2019. The Composite 20 SA is up 9.1% year-over-year.
The National index SA is up 9.5% year-over-year.
Note: According to the data, prices increased in 19 cities month-over-month seasonally adjusted.
Price increases were above expectations. I'll have more later.


