by Calculated Risk on 3/12/2021 06:00:00 PM
Friday, March 12, 2021
March 12 COVID-19 Test Results and Vaccinations; Over 100 Million Doses Administered
From Bloomberg on vaccinations as of Mar 12th:
"So far, 101 million doses have been given. In the last week, an average of 2.30 million doses per day were administered."Here is the CDC COVID Data Tracker. This site has data on vaccinations, cases and more.
And check out COVID Act Now to see how each state is doing. (updated link to new site)
 Click on graph for larger image.
This graph shows the daily (columns) 7 day average (line) of positive tests reported.
This data is from the CDC.
Note that three days ago, Missouri reported 81,000 previously unreported cases, and that caused the spike in total cases (and an increase in 7 day average).
The second graph shows the number of people hospitalized.
 This data is also from the CDC.
The CDC cautions that due to reporting delays, the area in grey will probably increase.
South Carolina Real Estate in February: Sales Up 13% YoY, Inventory Down 46% YoY
by Calculated Risk on 3/12/2021 02:00:00 PM
Note: I'm posting data for many local markets around the U.S. The story is the same everywhere ... inventory is at record lows.
From the South Carolina Realtors for the entire state:
Closed sales in February 2021 were 7,127, up 13.4% from 6,284 in February 2020.
Active Listings in February 2021 were 14,253, down 46.3% from 26,521 in February 2020.
Months of Supply was 1.6 Months in February 2021, compared to 3.2 Months in February 2020.
MBA: Share of Second Home and Investor Mortgage Applications
by Calculated Risk on 3/12/2021 12:49:00 PM
From the MBA:
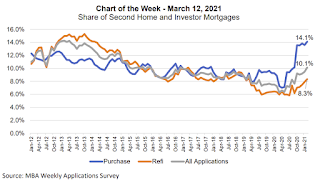
This week’s MBA Chart of the Week captures the share of mortgage applications to purchase or refinance a second home or investment property. In February 2021, 10.1 percent of all applications in the retail and consumer direct channels were for a non‐primary residence. This was an increase from 9.5 percent the previous month. 2019 and 2020 saw annual averages of approximately 8 percent. Breaking down the categories, second‐home transactions accounted for 3.6 percent of all applications and investment properties were 6.5 percent, totaling 10.1 percent. Average loan sizes as of February 2021 were $430,000 for second homes and $263,000 for investment properties.
Within purchase mortgages, the second home and investment property share was 14.1 percent of applications in February 2021, an increase from 13.6 percent in January and up from the annual averages of 9 percent in 2019 and 10 percent in 2020. Purchase activity in these property types has been increasing with the start of the spring buying season. Furthermore, demand is rising because of the rise in remote work and the desire to live further away from more densely populated urban areas. Refinancing of second homes and investment properties has also seen an increase – the result of homeowners taking advantage of record‐low mortgage rates.
 Click on graph for larger image.
Recognizing that compositional measures are impacted by the mix of applications, we also examined the year‐over‐year trends in the number of applications for these loan categories. Second home applications were up 37 percent compared to February 2020 and investor applications were up 110.6 percent, while overall applications were up 26.8 percent, which highlights the fact that the pace of growth has been higher for second homes and investment properties.CR Note: The Fannie and Freddie announcement will push up mortgage rates on 2nd homes and investor buying.
Lenders were focused this week on announcements from Fannie Mae and Freddie Mac to limit the share of loans they could sell to the GSEs to 7 percent of their portfolios, well below the run ‐rate in the market at this time.
Q1 GDP Forecasts: Around 5.5% SAAR
by Calculated Risk on 3/12/2021 11:34:00 AM
There was a research note out yesterday that suggested GDP could be back to pre-recession levels by the end of Q1 2021.
Real GDP peaked at $19.254 trillion in Q4 2019 SAAR (Seasonally Adjusted, Annual Rate, 2012 Dollars). In Q4 2020, real GDP was at $18.784 trillion. To increase to the previous peak, real GDP would have to increase at a 10.4% annual rate in Q1 (or upward revisions to previous quarters). That is very unlikely.
From Merrrill Lynch:
We continue to track 5.5% for 1Q GDP. [Mar 12 estimate]From the NY Fed Nowcasting Report
emphasis added
The New York Fed Staff Nowcast stands at 8.6% for 2021:Q1 and 4.0% for 2021:Q2. [Mar 12 estimate]And from the Altanta Fed: GDPNow
The GDPNow model estimate for real GDP growth (seasonally adjusted annual rate) in the first quarter of 2021 is 8.4 percent on March 8, up from 8.3 percent on March 5. [Mar 8 estimate]
Mortgage Equity Withdrawal in Q4 2020
by Calculated Risk on 3/12/2021 10:00:00 AM
Note: This is not Mortgage Equity Withdrawal (MEW) data from the Fed. The last MEW data from Fed economist Dr. Kennedy was for Q4 2008.
The following data is calculated from the Fed's Flow of Funds data (released yesterday) and the BEA supplement data on single family structure investment. This is an aggregate number, and is a combination of homeowners extracting equity - hence the name "MEW" - and normal principal payments and debt cancellation (modifications, short sales, and foreclosures).
For Q4 2020, the Net Equity Extraction was $81 billion, or 1.9% of Disposable Personal Income (DPI) . This is the second highest level of MEW since 2007 (Q3 was higher), but nothing like the amount of equity extraction during the housing bubble as a percent of DPI.

This graph shows the net equity extraction, or mortgage equity withdrawal (MEW), results, using the Flow of Funds (and BEA data) compared to the Kennedy-Greenspan method.
MEW has been mostly positive for the last five years.
The Fed's Flow of Funds report showed that the amount of mortgage debt outstanding increased by $149 billion in Q4.
For reference:
Dr. James Kennedy also has a simple method for calculating equity extraction: "A Simple Method for Estimating Gross Equity Extracted from Housing Wealth". Here is a companion spread sheet (the above uses my simple method).
For those interested in the last Kennedy data included in the graph, the spreadsheet from the Fed is available here.
Black Knight: Number of Homeowners in COVID-19-Related Forbearance Plans Decreased
by Calculated Risk on 3/12/2021 08:26:00 AM
Note: Both Black Knight and the MBA (Mortgage Bankers Association) are putting out weekly estimates of mortgages in forbearance.
This data is as of March 9th.
From Black Knight: Forbearances See Largest Weekly Decline Since Beginning Of 2021
The number of active forbearance plans fell by 77,000 (-2.9%) this week, marking the largest weekly decline since early January 2021. This week’s decline was due to a combination of February month-end expirations as well as the proactive extension and removal of borrowers who were set to see their plans expire at the end of March.The number of loans in forbearance has declined slightly over the last few months.
As of March 9, 2.6 million homeowners remain in forbearance, marking the first time that the forbearance rate has fallen below 5% since early April 2020.
Click on graph for larger image.
While month-end expirations scheduled for the end of March are down from 1.1 million a week ago, there are still more than 800,000 plans currently listed with March month-end expirations. This represents a daunting task for servicers: the need to review hundreds of thousands of upcoming expirations for removal or extension based on recently revised HUD and FHFA allowable terms of up to 18 months for early forbearance entrants.
Early extension activity suggests that servicers are continuing to approach forbearance plans in three-month increments, with the bulk of would-be March expirations being extended out through June.
With more than 800,000 plans still listed with March month-end expirations we’ll be watching the numbers closely over the next few weeks for elevated levels of removal and extension activity.
emphasis added
Thursday, March 11, 2021
March 11 COVID-19 Test Results and Vaccinations
by Calculated Risk on 3/11/2021 05:14:00 PM
From Bloomberg on vaccinations as of Mar 11th:
"So far, 98.2 million doses have been given. In the last week, an average of 2.23 million doses per day were administered."Here is the CDC COVID Data Tracker. This site has data on vaccinations, cases and more.
And check out COVID Act Now to see how each state is doing. (updated link to new site)
 Click on graph for larger image.
This graph shows the daily (columns) 7 day average (line) of positive tests reported.
This data is from the CDC.
Note that two days ago, Missouri reported 81,000 previously unreported cases, and that caused the spike in total cases (and an increase in 7 day average).
The second graph shows the number of people hospitalized.
 This data is also from the CDC.
The CDC cautions that due to reporting delays, the area in grey will probably increase.
Hotels: Occupancy Rate Declined 26.7% Compared to Same Week in 2019
by Calculated Risk on 3/11/2021 02:37:00 PM
Note: Starting next week, the year-over-year comparisons will be easy - since occupancy declined sharply at the onset of the pandemic - but occupancy will still be down significantly from normal levels.
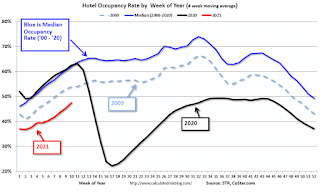
The occupancy rate is down 26.7% compared to the same week in 2019.
U.S. weekly hotel occupancy reached a 20-week high, according to STR‘s latest data through March 6.The following graph shows the seasonal pattern for the hotel occupancy rate using the four week average.
Feb. 28 through March 6, 2021 (percentage change from comparable week in 2020):
• Occupancy: 49.0% (-20.5%)
• Average daily rate (ADR): US$98.30 (-21.9%)
• Revenue per available room (RevPAR): US$48.13 (-37.9%)
While demand has improved in in many states, most markets remain deep in recessionary territory when indexed to 2019 levels. Year-over-year comparisons with 2020 are beginning to turn favorable as the country hits the one-year anniversary of its earliest pandemic restrictions.
emphasis added
 Click on graph for larger image.
The red line is for 2021, black is 2020, blue is the median, and dashed light blue is for 2009 (the worst year since the Great Depression for hotels prior to 2020).
Note: Y-axis doesn't start at zero to better show the seasonal change.
Portland Real Estate in February: Sales Up 4% YoY, Inventory Down 44% YoY
by Calculated Risk on 3/11/2021 01:20:00 PM
Note: I'm posting data for many local markets around the U.S. The story is the same everywhere ... inventory is at record lows.
For Portland, OR:
Closed sales in February 2021 were 1,978, up 4.3% from 1,897 in February 2020.
Active Listings in February 2021 were 1,993, down 44.3% from 3,580 in February 2020.
Months of Supply was 1.0 Months in February 2021, compared to 1.9 Months in February 2020.
Fed's Flow of Funds: Household Net Worth Increased $6.9 Trillion in Q4
by Calculated Risk on 3/11/2021 12:24:00 PM
The Federal Reserve released the Q4 2020 Flow of Funds report today: Flow of Funds.
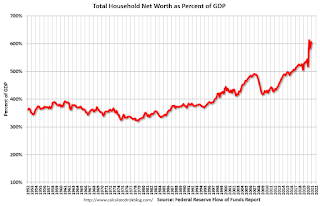
The net worth of households and nonprofits rose to $130.2 trillion during the fourth quarter of 2020. The value of directly and indirectly held corporate equities increased $4.9 trillion and the value of real estate increased $0.9 trillion.
Household debt increased 6.5 percent at an annual rate in the fourth quarter of 2020. Consumer credit grew at an annual rate of 2.3 percent, while mortgage debt (excluding charge-offs) grew at an annual rate of 5.2 percent.
 Click on graph for larger image.
The first graph shows Households and Nonprofit net worth as a percent of GDP.
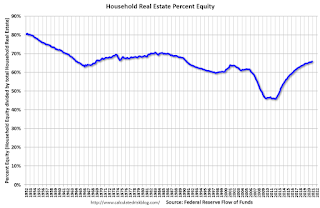
 This graph shows homeowner percent equity since 1952.
 Household percent equity (as measured by the Fed) collapsed when house prices fell sharply in 2007 and 2008.
In Q4 2020, household percent equity (of household real estate) was at 65.9% - up from 65.5% in Q3.
Note: about 30.3% of owner occupied households had no mortgage debt as of April 2010. So the approximately 50+ million households with mortgages have less than 65.9% equity - and about 1.5 million homeowners still have negative equity.
 The third graph shows household real estate assets and mortgage debt as a percent of GDP. Note this graph was impacted by the sharp decline in Q2 GDP.
Mortgage debt increased by $149 billion in Q4.
Mortgage debt is still down from the peak during the housing bubble, and, as a percent of GDP is at 50.9% - down from Q3 - and down from a peak of 73.5% of GDP during the housing bubble.
The value of real estate, as a percent of GDP, increased in Q4, and is above the average of the last 30 years.


