by Calculated Risk on 3/17/2021 10:17:00 AM
Wednesday, March 17, 2021
Comments on February Housing Starts
Earlier: Housing Starts decreased to 1.421 Million Annual Rate in February
It appears the poor weather in February impacted housing starts - the largest declines in starts were in the South and Mid-West regions. Single family starts were up 38% year-over-year in the West (not impacted by poor weather). Permits (unaffected by the weather) were up 17% year-over-year, and were up solidly in the South and Mid-West.
The housing starts report showed starts were down 10.3% in February compared to January, and starts were down 9.3% year-over-year compared to February 2020.
Single family starts were up less than 1% year-over-year.
The first graph shows the month to month comparison for total starts between 2020 (blue) and 2021 (red).
 Click on graph for larger image.
Starts were down 9.3% in February compared to February 2020. The year-over-year comparison will be easy in March, April and May.
2020 was off to a strong start before the pandemic, and with low interest rates and little competing existing home inventory, starts finished the year strong.
Below is an update to the graph comparing multi-family starts and completions. Since it usually takes over a year on average to complete a multi-family project, there is a lag between multi-family starts and completions. Completions are important because that is new supply added to the market, and starts are important because that is future new supply (units under construction is also important for employment).
These graphs use a 12 month rolling total for NSA starts and completions.
 The blue line is for multifamily starts and the red line is for multifamily completions.
 The rolling 12 month total for starts (blue line) increased steadily for several years following the great recession - then mostly moved sideways. Completions (red line) had lagged behind - then completions caught up with starts- then starts picked up a little again late last year, but have fallen off with the pandemic.
 The last graph shows single family starts and completions. It usually only takes about 6 months between starting a single family home and completion - so the lines are much closer. The blue line is for single family starts and the red line is for single family completions.
Single family starts are getting back to more normal levels, but I still expect some further increases in single family starts and completions on a rolling 12 month basis.
Housing Starts decreased to 1.421 Million Annual Rate in February
by Calculated Risk on 3/17/2021 08:38:00 AM
From the Census Bureau: Permits, Starts and Completions
Housing Starts:
Privately-owned housing starts in February were at a seasonally adjusted annual rate of 1,421,000. This is 10.3 percent below the revised January estimate of 1,584,000 and is 9.3 percent below the February 2020 rate of 1,567,000. Single-family housing starts in February were at a rate of 1,040,000; this is 8.5 percent below the revised January figure of 1,136,000. The February rate for units in buildings with five units or more was 372,000.
Building Permits:
Privately-owned housing units authorized by building permits in February were at a seasonally adjusted annual rate of 1,682,000. This is 10.8 percent below the revised January rate of 1,886,000, but is 17.0 percent above the February 2020 rate of 1,438,000. Single-family authorizations in February were at a rate of 1,143,000; this is 10.0 percent below the revised January figure of 1,270,000. Authorizations of units in buildings with five units or more were at a rate of 495,000 in February.
emphasis added
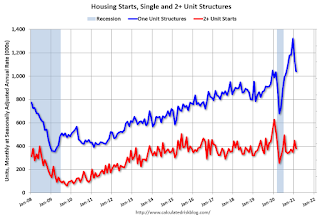 Click on graph for larger image.
The first graph shows single and multi-family housing starts for the last several years.
Multi-family starts (red, 2+ units) decreased in February compared to January. Multi-family starts were down 29% year-over-year in February.
Single-family starts (blue) decreased in February, and were up less than 1% year-over-year.
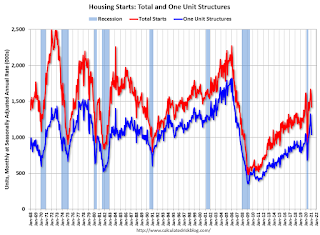 The second graph shows total and single unit starts since 1968.
 The second graph shows the huge collapse following the housing bubble, and then eventual recovery (but still historically low).
Total housing starts in February were well below expectations, and starts in December and January were revised down slightly, combined.
I'll have more later …
MBA: Mortgage Applications Decrease in Latest Weekly Survey
by Calculated Risk on 3/17/2021 07:00:00 AM
From the MBA: Mortgage Applications Decrease in Latest MBA Weekly Survey
Mortgage applications decreased 2.2 percent from one week earlier, according to data from the Mortgage Bankers Association’s (MBA) Weekly Mortgage Applications Survey for the week ending March 12, 2021.
... The Refinance Index decreased 4 percent from the previous week and was 39 percent lower than the same week one year ago. The seasonally adjusted Purchase Index increased 2 percent from one week earlier. The unadjusted Purchase Index increased 3 percent compared with the previous week and was 5 percent higher than the same week one year ago.
“Mortgage application activity was mixed last week, as the run-up in rates continues to reduce incentives for potential refinance borrowers. The 30-year fixed rate increased to its highest level since June 2020, and all other surveyed rates were either flat or increased,” said Joel Kan, MBA’s Associate Vice President of Economic and Industry Forecasting. “After reaching a recent high in the last week of January, the refinance index has since fallen 26 percent to its lowest level since September 2020. Rates have jumped 36 basis points since the end of January, and last week refinance activity fell across all loan types.”
Added Kan, “The purchase market helped offset the slump in refinances. Activity was up 5 percent from a year ago, as the recovering job market and demographic factors drive demand, despite ongoing supply and affordability constraints.”
...
The average contract interest rate for 30-year fixed-rate mortgages with conforming loan balances ($548,250 or less) increased to 3.28 percent from 3.26 percent, with points decreasing to 0.41 from 0.43 (including the origination fee) for 80 percent loan-to-value ratio (LTV) loans.
emphasis added
 Click on graph for larger image.
The first graph shows the refinance index since 1990.
With near record low rates, the index remains elevated, but, as expected, was down year-over-year - since rates fell sharply, and refinance activity picked up, at the beginning of the pandemic).
The second graph shows the MBA mortgage purchase index
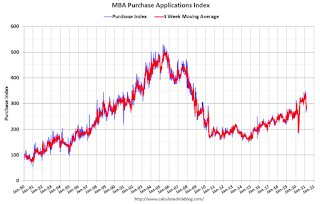 According to the MBA, purchase activity is up 5% year-over-year unadjusted.
Note: For the next 8 or 9 weeks, the MBA index will be up sharply year-over-year since purchase activity collapsed in late March 2020 in the early weeks of the pandemic.
Note: Red is a four-week average (blue is weekly).
Tuesday, March 16, 2021
Wednesday: Housing Starts, FOMC Announcement, Forecasts, and Press Conference
by Calculated Risk on 3/16/2021 09:00:00 PM
See my FOMC Preview
Wednesday:
• At 7:00 AM ET, The Mortgage Bankers Association (MBA) will release the results for the mortgage purchase applications index.
• At 8:30 AM, Housing Starts for February. The consensus is for 1.570 million SAAR, down from 1.580 million SAAR.
• At 2:00 PM, FOMC Meeting Announcement. No change to policy is expected at this meeting.
• At 2:00 PM, FOMC Forecasts This will include the Federal Open Market Committee (FOMC) participants' projections of the appropriate target federal funds rate along with the quarterly economic projections.
• At 2:30 PM, Fed Chair Jerome Powell holds a press briefing following the FOMC announcement.
March 16 COVID-19 Test Results and Vaccinations
by Calculated Risk on 3/16/2021 04:17:00 PM
From Bloomberg on vaccinations as of Mar 16th:
"So far, 111 million doses have been given. In the last week, an average of 2.44 million doses per day were administered."Here is the CDC COVID Data Tracker. This site has data on vaccinations, cases and more.
And check out COVID Act Now to see how each state is doing. (updated link to new site)
 Click on graph for larger image.
This graph shows the daily (columns) 7 day average (line) of positive tests reported.
This data is from the CDC.
The second graph shows the number of people hospitalized.
 This data is also from the CDC.
The CDC cautions that due to reporting delays, the area in grey will probably increase.
Phoenix Real Estate in February: Sales Up 5% YoY, Active Inventory Down 61% YoY
by Calculated Risk on 3/16/2021 02:07:00 PM
The Arizona Regional Multiple Listing Service (ARMLS) reports ("Stats Report"):
1) Overall sales were at 7,659 in February, up 5.2% from 7,279 in February 2020.
2) Active inventory was at 4,144, down 60.9% from 10,590 in February 2020.
3) Months of supply decreased to 1.14 in February from 2.14 in February 2020. This is very low.
Sales are reported at the close of escrow, so these sales were mostly signed in December and January.
CAR on California February Housing: Sales up 10% YoY, Active Listings down 53% YoY
by Calculated Risk on 3/16/2021 11:34:00 AM
California home sales moderated in February as mortgage rates spiked in recent weeks, while tight housing supply continued to constrain demand, especially in more affordable markets, the CALIFORNIA ASSOCIATION OF REALTORS® (C.A.R.) said today.CR Note: Existing home sales are reported when the transaction closes, so this was mostly for contracts signed in December and January.
Closed escrow sales of existing, single-family detached homes in California totaled a seasonally adjusted annualized rate of 462,720 in February, according to information collected by C.A.R. from more than 90 local REALTOR® associations and MLSs statewide. The statewide annualized sales figure represents what would be the total number of homes sold during 2021 if sales maintained the February pace throughout the year. It is adjusted to account for seasonal factors that typically influence home sales.
February home sales decreased 4.5 percent from 484,760 in January and were up 9.7 percent from a year ago, when 421,670 homes were sold on an annualized basis. While still solid, the nearly 10 percent sales increase was the smallest gain in the past seven months.
...
“The housing market has been cruising at a robust pace since the second half of 2020 but has encountered some speedbumps recently as rates began to rise,” said C.A.R. President Dave Walsh, vice president and manager of the Compass San Jose office. “While higher rates may slow growth in home sales temporarily, the major roadblock in the long run is a shortage of homes for sale. With inventory dropping more than a half from a year ago, the market will soften in the second half of 2021 if we don’t see enough homes come on the market to meet demand.”
...
The Unsold Inventory Index (UII) inched up from 1.9 months in January to 2.0 months in February but dropped sharply from a year ago, when there was 3.6 months of housing inventory. The index indicates the number of months it would take to sell the supply of homes on the market at the current rate of sales.
Active listings fell 52.5 percent in February from last year and continued to drop more than 40 percent on a year-over-year basis for the eighth consecutive month. On a month-to-month basis, for-sale properties inched up slightly by 0.4 percent in February and should climb further in the coming months as the market prepares for the spring homebuying season and the pandemic situation continues to improve.
emphasis added
NAHB: Builder Confidence Decreased to 82 in March
by Calculated Risk on 3/16/2021 10:06:00 AM
The National Association of Home Builders (NAHB) reported the housing market index (HMI) was at 82, down from 84 in February. Any number above 50 indicates that more builders view sales conditions as good than poor.
From the NAHB: Higher Material Costs, Interest Rates Lower Builder Sentiment
Despite high buyer traffic and strong demand, builder sentiment fell in March as rising lumber and other material prices pushed builder confidence lower. The latest National Association of Home Builders (NAHB)/Wells Fargo Housing Market Index (HMI) shows that builder confidence in the market for newly built single-family homes fell two points to 82 in March.
Though builders continue to see strong buyer traffic, recent increases for material costs and delivery times, particularly for softwood lumber, have depressed builder sentiment this month. Supply shortages and high demand have caused lumber prices to jump about 200 percent since last April.
Builder confidence peaked at a level of 90 last November and has trended lower as supply-side and demand-side factors have trimmed housing affordability. While single-family home building should grow this year, the elevated price of lumber is adding approximately $24,000 to the price of a new home. And mortgage interest rates, while historically low, have increased about 30 basis points over the last month. Nonetheless, the lack of resale inventory means new construction is the only option for some prospective home buyers.
...
The HMI index gauging current sales conditions fell three points to 87 while the component measuring sales expectations in the next six months increased three points to 83. The gauge charting traffic of prospective buyers held firm at 72.
Looking at the three-month moving averages for regional HMI scores, the Northeast rose two points to 80, the Midwest fell one point to 80, the South dropped two points to 82 and the West posted a three-point loss to 90.
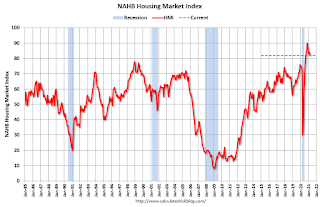 Click on graph for larger image.
This graph show the NAHB index since Jan 1985.
This was slightly below the consensus forecast, but still a very strong reading.
Housing and homebuilding have been one of the best performing sectors during the pandemic.
Industrial Production Decreased 2.2 Percent in February
by Calculated Risk on 3/16/2021 09:22:00 AM
From the Fed: Industrial Production and Capacity Utilization
In February, total industrial production decreased 2.2 percent. Manufacturing output and mining production fell 3.1 percent and 5.4 percent, respectively; the output of utilities increased 7.4 percent.
The severe winter weather in the south central region of the country in mid-February accounted for the bulk of the declines in output for the month. Most notably, some petroleum refineries, petrochemical facilities, and plastic resin plants suffered damage from the deep freeze and were offline for the rest of the month. Excluding the effects of the winter weather would have resulted in an index for manufacturing that fell about 1/2 percent and in an index for mining that rose about 1/2 percent. Both indexes would have remained below their pre-pandemic (February 2020) levels.
At 104.7 percent of its 2012 average, total industrial production in February was 4.2 percent lower than its year-earlier level. Capacity utilization for the industrial sector decreased 1.7 percentage points in February to 73.8 percent, a rate that is 5.8 percentage points below its long-run (1972–2020) average.
emphasis added
 Click on graph for larger image.
This graph shows Capacity Utilization. This series is up from the record low set in April, but still below the level in February 2020.
Capacity utilization at 73.8% is 5.8% below the average from 1972 to 2020.
Note: y-axis doesn't start at zero to better show the change.
 The second graph shows industrial production since 1967.
Industrial production decreased in February to 104.7. This is 4.2% below the February 2020 level.
The change in industrial production was below consensus expectations.
Retail Sales Decreased 3.0% in February
by Calculated Risk on 3/16/2021 08:39:00 AM
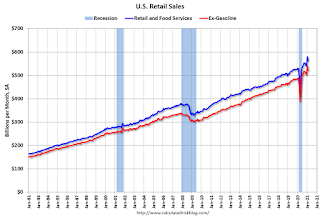
On a monthly basis, retail sales decreased 3.0 percent from January to February (seasonally adjusted), and sales were up 6.3 percent from February 2020.
From the Census Bureau report:
Advance estimates of U.S. retail and food services sales for February 2021, adjusted for seasonal variation and holiday and trading-day differences, but not for price changes, were $561.7 billion, a decrease of 3.0 percent from the previous month, and 6.3 percent above February 2020.
emphasis added
 Click on graph for larger image.
This graph shows retail sales since 1992. This is monthly retail sales and food service, seasonally adjusted (total and ex-gasoline).
Retail sales ex-gasoline were down 3.5% in February.
The second graph shows the year-over-year change in retail sales and food service (ex-gasoline) since 1993.
 Retail and Food service sales, ex-gasoline, increased by 7.0% on a YoY basis.
Sales in February were well below expectations, however sales in January were revised up.


