by Calculated Risk on 4/07/2021 11:09:00 AM
Wednesday, April 07, 2021
Some thoughts on increasing the Homeowner Housing Supply in the Short Term
Currently "For Sale" housing inventories are at record low levels. What could lead to more supply in the short term?
First, as the pandemic subsides, potential sellers will be more willing to list their homes (and allow strangers into their homes). So I expect more inventory later this year (See Some thoughts on Housing Inventory)
Second, an increase in mortgage rates (if this continues) would likely slow demand (usually demand picks up when interest rates first start to increase, as buyers are afraid of missing out on low rates). But if 30 year fixed rate mortgages move up closer to 4% (from the current 3.34%), this will probably slow demand.
 Click on graph for larger image.
Trade Deficit Increased to $71.1 Billion in February
by Calculated Risk on 4/07/2021 08:44:00 AM
From the Department of Commerce reported:
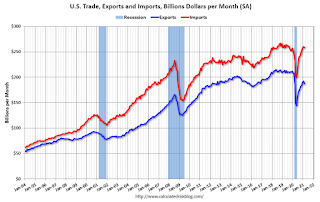
The U.S. Census Bureau and the U.S. Bureau of Economic Analysis announced today that the goods and services deficit was $71.1 billion in February, up $3.3 billion from $67.8 billion in January, revised.
February exports were $187.3 billion, $5.0 billion less than January exports. February imports were $258.3 billion, $1.7 billion less than January imports.
emphasis added
 Click on graph for larger image.
Both exports and imports decreased in February.
Exports are down 10.0% compared to February 2020; imports are up 5.0% compared to February 2020.
Both imports and exports decreased sharply due to COVID-19, and have now bounced back (imports much more than exports),
The second graph shows the U.S. trade deficit, with and without petroleum.
 The blue line is the total deficit, and the black line is the petroleum deficit, and the red line is the trade deficit ex-petroleum products.
Note that net, imports and exports of petroleum products are close to zero.
The trade deficit with China increased to $24.6 billion in February, from $16.0 billion in February 2020.
MBA: Mortgage Applications Decrease in Latest Weekly Survey
by Calculated Risk on 4/07/2021 07:00:00 AM
From the MBA: Mortgage Applications Decrease in Latest MBA Weekly Survey
Mortgage applications decreased 5.1 percent from one week earlier, according to data from the Mortgage Bankers Association’s (MBA) Weekly Mortgage Applications Survey for the week ending April 2, 2021.
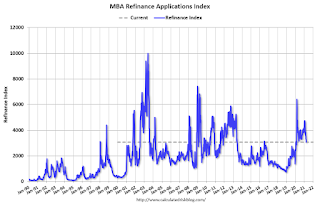
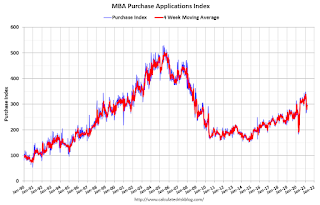
... The Refinance Index decreased 5 percent from the previous week and was 20 percent lower than the same week one year ago. The seasonally adjusted Purchase Index decreased 5 percent from one week earlier. The unadjusted Purchase Index decreased 4 percent compared with the previous week and was 51 percent higher than the same week one year ago.
“Mortgage rates resumed their upward move last week, with the 30-year fixed rate at 3.36 percent. The return of rates to the highest level since last June contributed to a slowdown in applications for both purchases and refinances. The rapidly recovering economy and improving job market is generating sizeable home buying demand, but activity in recent weeks is constrained by quicker home-price growth and extremely low inventory,” said Joel Kan, MBA’s Associate Vice President of Economic and Industry Forecasting. “Refinance applications declined for the fifth straight week, but there was a gain in VA loan activity. Overall, refinance demand has decreased, with volume over the past 10 weeks down by more than 30 percent.”
...
The average contract interest rate for 30-year fixed-rate mortgages with conforming loan balances ($548,250 or less) increased to 3.36 percent from 3.33 percent, with points increasing to 0.43 from 0.39 (including the origination fee) for 80 percent loan-to-value ratio (LTV) loans.
emphasis added
 Click on graph for larger image.
The first graph shows the refinance index since 1990.
With low rates, the index remains elevated, but falling as rates rise.
The second graph shows the MBA mortgage purchase index
 According to the MBA, purchase activity is up 51% year-over-year unadjusted.
Note: Until the 2nd half of May, the MBA index will be up sharply year-over-year since purchase activity collapsed in late March 2020 in the early weeks of the pandemic.
Note: Red is a four-week average (blue is weekly).
Tuesday, April 06, 2021
Wednesday: Trade Deficit, FOMC Minutes
by Calculated Risk on 4/06/2021 09:00:00 PM
Wednesday:
• At 7:00 AM ET, The Mortgage Bankers Association (MBA) will release the results for the mortgage purchase applications index.
• At 8:30 AM, Trade Balance report for February from the Census Bureau. The consensus is the trade deficit to be $70.3 billion. The U.S. trade deficit was at $68.2 billion in January.
• At 2:00 PM, FOMC Minutes, Minutes Meeting of March 16-17, 2021
SF Fed: Weather Increased March Employment by About 100 Thousand
by Calculated Risk on 4/06/2021 05:04:00 PM
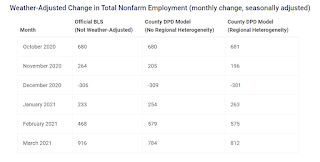
Every month, the San Francisco Fed estimates Weather-Adjusted Change in Total Nonfarm Employment (monthly change, seasonally adjusted). They use local area weather to estimate the impact on employment.
The BLS reported 916 thousand jobs were added in March.
The San Francisco Fed estimates that weather adjusted employment gains were 812 thousand; about 100 thousand lower than the BLS reported.
This reverses the impact of weather on the February report, and was expected. This was especially evident in construction were there were 56 thousand construction jobs lost in February, and 110 thousand construction jobs added in March.
 Click on table for larger image.
This table from Daniel Wilson at the SF Fed shows the BLS reported job gains for the last 6 months, and two estimates of the impact of weather.
April 6th COVID-19 Vaccinations, New Cases, Hospitalizations
by Calculated Risk on 4/06/2021 04:19:00 PM
Note: I've been posting this data daily for over a year. I'll stop once all three of these criteria are met:
1) 70% of the population over 18 has had at least one dose of vaccine,
2) new cases are under 5,000 per day, and
3) hospitalizations are below 3,000.
According to the CDC, 168.6 million doses have been administered. 24.4% of the population over 18 is fully vaccinated, and 41.7% of the population over 18 has had at least one dose (107.6 million people have had at least one dose).
And check out COVID Act Now to see how each state is doing.
 Click on graph for larger image.
This graph shows the daily (columns) 7 day average (line) of positive tests reported.
Note: The ups and downs during the Winter surge were related to reporting delays due to the Thanksgiving and Christmas holidays.
This data is from the CDC.
The second graph shows the number of people hospitalized.
 This data is also from the CDC.
The CDC cautions that due to reporting delays, the area in grey will probably increase.
Las Vegas Real Estate in March: Sales up 36% YoY, Inventory down 68% YoY
by Calculated Risk on 4/06/2021 12:37:00 PM
This report is for closed sales in March; sales are counted at the close of escrow, so the contracts for these homes were mostly signed in January and February.
The Las Vegas Realtors reported Southern Nevada home prices keep springing forward amid tight supply; LVR housing statistics for March 2021
"This is the first month where our housing statistics show a year-over-year comparison to the beginning of the pandemic,” said 2021 LVR President Aldo Martinez. “At the rate we’re going, we could see even greater gains in home prices and sales next month, since the housing market stalled briefly last April before roaring back since then.”1) Overall sales (single family and condos) were up 36.1% year-over-year to 4,724 in March 2021 from 7,315 in March 2020.
LVR reported a total of 4,724 existing local homes, condos and townhomes were sold during March. Compared to the same time last year, March sales were up 35.1% for homes and up 39.8% for condos and townhomes.
…
By the end of March, LVR reported 1,772 single-family homes listed for sale without any sort of offer. While up from the previous month, that’s still down 68.8% from one year ago. For condos and townhomes, the 597 properties listed without offers in March represent a 63.3% drop from one year ago.
...
Despite the ongoing pandemic and accompanying economic downturn, the number of so-called distressed sales remains near historically low levels. LVR reported that short sales and foreclosures combined accounted for just 0.6% of all existing local property sales in March. That compares to 2.0% of all sales one year ago, 2.5% of all sales two years ago, 2.9% three years ago, and 9.8% four years ago.
emphasis added
2) Active inventory (single-family and condos) is down from a year ago, from a total of 5,454 in March 2020 to 2,369 in March 2021. Note: Total inventory was down 67.6% year-over-year. And months of inventory is extremely low.
3) Very low level of distressed sales.
BLS: Job Openings Increased to 7.4 Million in February
by Calculated Risk on 4/06/2021 10:06:00 AM
From the BLS: Job Openings and Labor Turnover Summary
The number of job openings edged up to 7.4 million on the last business day of February, the U.S. Bureau of Labor Statistics reported today. Hires also edged up to 5.7 million while total separations were little changed at 5.5 million. Within separations, the quits rate and layoffs and discharges rate were unchanged at 2.3 percent and 1.2 percent, respectively.The following graph shows job openings (yellow line), hires (dark blue), Layoff, Discharges and other (red column), and Quits (light blue column) from the JOLTS.
emphasis added
This series started in December 2000.
Note: The difference between JOLTS hires and separations is similar to the CES (payroll survey) net jobs headline numbers. This report is for February, the most recent employment report was for March.
 Click on graph for larger image.
Note that hires (dark blue) and total separations (red and light blue columns stacked) are usually pretty close each month. This is a measure of labor market turnover. When the blue line is above the two stacked columns, the economy is adding net jobs - when it is below the columns, the economy is losing jobs.
The huge spikes in layoffs and discharges in March and April 2020 are labeled, but off the chart to better show the usual data.
Jobs openings increased in February to 7.367 million from 7.099 million in January. This is close to the series maximum of 7.574 million.
The number of job openings (yellow) were up 5.1% year-over-year. Note that job openings were declining a year ago prior to the pandemic.
Quits were down 2.1% year-over-year. These are voluntary separations. (see light blue columns at bottom of graph for trend for "quits").
CoreLogic: House Prices up 10.4% Year-over-year in February
by Calculated Risk on 4/06/2021 08:00:00 AM
Notes: This CoreLogic House Price Index report is for February. The recent Case-Shiller index release was for January. The CoreLogic HPI is a three month weighted average and is not seasonally adjusted (NSA).
From CoreLogic: Market Forces at Work: Supply Constraints and Buyer Demand Pushes US Home Price Annual Appreciation to 15-Year High in February, CoreLogic Reports
CoreLogic® ... today released the CoreLogic Home Price Index (HPI™) and HPI Forecast™ for February 2021.
Home prices continued to increase in February, reaching the highest annual gain since April 2006, as demand continues to clash with historically low supply. These factors have created increased affordability challenges, especially as mortgage rates also begin to rise.
CoreLogic analysis also shows homebuyers have steadily moved away from densely populated, high-cost coastal areas in favor of more affordable suburban locales. The number of homebuyers in the top 10 metros with the largest net out-migration — including West Coast metros like Los Angeles, San Francisco and San Jose — who chose to move to another metro increased by 3 percentage points in 2020 to 21% from 2019. This sentiment is reflected in CoreLogic’s recent consumer survey, which found that 57% of current non-homeowners on the West Coast feel the home options in their area are not at all affordable.
“Homebuyers are experiencing the most competitive housing market we’ve seen since the Great Recession,” said Frank Martell, president and CEO of CoreLogic. “Rising mortgage rates and severe supply constraints are pushing already-overheated home prices out of reach for some prospective buyers, especially in more expensive metro areas. As affordability challenges persist, we may see more potential homebuyers priced out of the market and a possible slowing of price growth on the horizon.”
...
Nationally, home prices increased 10.4% in February 2021, compared with February 2020. On a month-over-month basis, home prices increased by 1.2% compared to January 2021.
“The run-up in home prices is good news for current homeowners but sobering for prospective buyers,” said Dr. Frank Nothaft, chief economist at CoreLogic. “Those looking to buy need to save for a down payment, closing costs and cash reserves, all of which are much higher as home prices go up. Add to that a rise in mortgage rates and the affordability challenge for first-time buyers becomes even greater."
emphasis added
Monday, April 05, 2021
Tuesday: Job Openings
by Calculated Risk on 4/05/2021 09:00:00 PM
From Matthew Graham at Mortgage News Daily: MBS RECAP: Decent Showing For Bonds Despite Strong Data
The rising rate trend of 2021 is increasingly being called into question--even if only temporarily--due to the inability of 10yr yields to quickly break above 1.75%. That said, at levels of 1.72-1.74% so far this morning, it's definitely not time to celebrate just yet. ... [30 year fixed 3.38%]Tuesday:
emphasis added
• At 8:00 AM ET, Corelogic House Price index for February.
• At 10:00 AM, Job Openings and Labor Turnover Survey for February from the BLS.


