 RSS Feed
 by Calculated Risk on 4/29/2021 01:02:00 PM
Thursday, April 29, 2021
Hotels: Occupancy Rate Down 17% Compared to Same Week in 2019
Note: The year-over-year occupancy comparisons are easy, since occupancy declined sharply at the onset of the pandemic. However, occupancy is still down significantly from normal levels.
The occupancy rate is down 17% compared to the same week in 2019.
From CoStar: STR: US Weekly Hotel Occupancy Flat From Prior Week
U.S. weekly hotel occupancy remained flat from the previous week, according to STR‘s latest data through April 24.The following graph shows the seasonal pattern for the hotel occupancy rate using the four week average.
April 18-24, 2021:
• Occupancy: 57.3%
• Average daily rate (ADR): US$108.10
• Revenue per available room (RevPAR): US$61.93
Overall industry occupancy will likely remain plateaued until the summer leisure travel boom, but there has been noticeable uptick in weekday occupancy, which is indicative of increased business travel. ADR was up slightly from the previous week, and the Luxury, Midscale and Economy classes have each recovered more than 90% of their 2019 ADR levels.
emphasis added
 Click on graph for larger image.
The red line is for 2021, black is 2020, blue is the median, and dashed light blue is for 2009 (the worst year on record for hotels prior to 2020).
Occupancy is now slightly above the horrible 2009 levels.
Note: Y-axis doesn't start at zero to better show the seasonal change.
Note: Y-axis doesn't start at zero to better show the seasonal change.
A Few Comments on Q1 GDP
by Calculated Risk on 4/29/2021 11:36:00 AM
Earlier from the BEA: Gross Domestic Product, First Quarter 2021 (Advance Estimate)
Real gross domestic product (GDP) increased at an annual rate of 6.4 percent in the first quarter of 2021, according to the "advance" estimate released by the Bureau of Economic Analysis. In the fourth quarter of 2020, real GDP increased 4.3 percent.On a Q1-over-Q1 basis, GDP was up 0.4%.
emphasis added
 Click on graph for larger image.
This graph shows the percent decline in real GDP from the previous peak (currently the previous peak was in Q4 2019).
This graph is through Q1 2021, and real GDP is currently off 0.9% from the previous peak.
The advance Q1 GDP report, at 6.4% annualized, was slightly below expectations, largely due to a decline in private inventories.
Personal consumption expenditures (PCE) increased at a 10.7% annualized rate in Q1, due, in part, to the American Rescue Plan Act.
The second graph below shows the contribution to GDP from residential investment, equipment and software, and nonresidential structures (3 quarter trailing average). This is important to follow because residential investment tends to lead the economy, equipment and software is generally coincident, and nonresidential structure investment trails the economy.
In the graph, red is residential, green is equipment and software, and blue is investment in non-residential structures. So the usual pattern - both into and out of recessions is - red, green, blue.
Of course - with the sudden economic stop due to COVID-19 - the usual pattern doesn't apply.
The dashed gray line is the contribution from the change in private inventories.
 Residential investment (RI) increased at a 10.8% annual rate in Q1.
Equipment investment increased at a 16.7% annual rate, and investment in
non-residential structures decreased at a 4.8% annual rate (after getting crushed over the previous year)..
Residential investment (RI) increased at a 10.8% annual rate in Q1.
Equipment investment increased at a 16.7% annual rate, and investment in
non-residential structures decreased at a 4.8% annual rate (after getting crushed over the previous year)..The contribution to Q1 GDP from investment in private inventories was -2.64 percentage points (this will likely be a positive for Q2).
On a 3 quarter trailing average basis, RI (red) is up solidly, equipment (green) is also up solidly, and nonresidential structures (blue) is down.
On a 3 quarter trailing average basis, RI (red) is up solidly, equipment (green) is also up solidly, and nonresidential structures (blue) is down.
I'll post more on the components of non-residential investment once the
supplemental data is released.
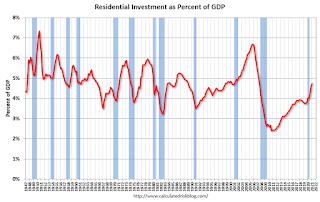 The second graph shows residential investment as a percent of GDP.
Residential Investment as a percent of GDP increased in Q1.
I'll break down Residential Investment into components after the GDP details are released.
Note: Residential investment (RI) includes new single family structures, multifamily structures, home improvement, broker's commissions, and a few minor categories.
 The third graph shows non-residential investment in
structures, equipment and "intellectual property products".
The third graph shows non-residential investment in
structures, equipment and "intellectual property products".
Investment in non-residential structures declined in Q1 as a percent GDP, and will probably be weak for some time (hotel occupancy is still low, office and mall vacancy rates are high).
NAR: Pending Home Sales Increased 1.9% in March
by Calculated Risk on 4/29/2021 10:03:00 AM
From the NAR: Pending Home Sales Grow 1.9% in March
Pending home sales increased in March, snapping two consecutive months of declines, according to the National Association of Realtors®. All but one of the four major U.S. regions experienced month-over-month gains in March, while each area recorded year-over-year growth.This was below expectations for this index. Note: Contract signings usually lead sales by about 45 to 60 days, so this would usually be for closed sales in April and May.
The Pending Home Sales Index (PHSI), a forward-looking indicator of home sales based on contract signings, rose 1.9% to 111.3 in March. Year-over-year, contract signings jumped 23.3%, with the difference due in large part to the pandemic-induced lockdown in March 2020. An index of 100 is equal to the level of contract activity in 2001.
...
The Northeast PHSI rose 6.1% to 97.9 in March, a 16.7% increase from a year ago. In the Midwest, the index fell 3.7% to 98.6 last month, up 14.1% from March 2020.
Pending home sales transactions in the South jumped 2.9% to an index of 137.2 in March, up 27.9% from March 2020. The index in the West grew 2.9% in March to 94.5, up 29.8% from a year prior.
emphasis added
Weekly Initial Unemployment Claims at 553,000
by Calculated Risk on 4/29/2021 08:39:00 AM
The DOL reported:
In the week ending April 24, the advance figure for seasonally adjusted initial claims was 553,000, a decrease of 13,000 from the previous week's revised level. The previous week's level was revised up by 19,000 from 547,000 to 566,000. The 4-week moving average was 611,750, a decrease of 44,000 from the previous week's revised average. This is the lowest level for this average since March 14, 2020 when it was 225,500. The previous week's average was revised up by 4,750 from 651,000 to 655,750.This does not include the 121,749 initial claims for Pandemic Unemployment Assistance (PUA) that was down from 133,358 the previous week.
emphasis added
The following graph shows the 4-week moving average of weekly claims since 1971.
 Click on graph for larger image.
The dashed line on the graph is the current 4-week average. The four-week average of weekly unemployment claims decreased to 651,000.
The previous week was revised up.
Regular state continued claims decreased to 3,813,109 (SA) from 3,886,198 (SA) the previous week.
Note: There are an additional 6,974,068 receiving Pandemic Unemployment Assistance (PUA) that decreased from 7,309,604 the previous week (there are questions about these numbers). This is a special program for business owners, self-employed, independent contractors or gig workers not receiving other unemployment insurance. And an additional 5,192,711 receiving Pandemic Emergency Unemployment Compensation (PEUC) down from 5,605,935.
Weekly claims were higher than the consensus forecast.
BEA: Real GDP increased at 6.4% Annualized Rate in Q1
by Calculated Risk on 4/29/2021 08:33:00 AM
From the BEA: Gross Domestic Product, First Quarter 2021 (Advance Estimate)
Real gross domestic product (GDP) increased at an annual rate of 6.4 percent in the first quarter of 2021, according to the "advance" estimate released by the Bureau of Economic Analysis. In the fourth quarter of 2020, real GDP increased 4.3 percent. ...The advance Q1 GDP report, with 6.4% annualized growth, was slightly below expectations.
The increase in real GDP in the first quarter reflected increases in personal consumption expenditures (PCE), nonresidential fixed investment, federal government spending, residential fixed investment, and state and local government spending that were partly offset by decreases in private inventory investment and exports. Imports, which are a subtraction in the calculation of GDP, increased.
emphasis added
I'll have more later ...
Wednesday, April 28, 2021
Thursday: GDP, Unemployment Claims, Pending Home Sales
by Calculated Risk on 4/28/2021 09:00:00 PM
Thursday:
• At 8:30 AM ET, The initial weekly unemployment claims report will be released. The consensus is for a decrease to 525 thousand from 547 thousand last week.
• Also at 8:30 AM, Gross Domestic Product, 1st quarter 2021 (Advance estimate). The consensus is that real GDP increased 6.5% annualized in Q1, up from 4.3% in Q4.
• At 10:00 AM, Pending Home Sales Index for March. The consensus is for a 6.0% increase in the index.
April 28th COVID-19 Vaccinations, New Cases, Hospitalizations
by Calculated Risk on 4/28/2021 03:46:00 PM
Note: I'm looking forward to not posting this daily! I've been posting this data daily for over a year, and I'll stop once all three of these criteria are met:
1) 70% of the population over 18 has had at least one dose of vaccine, and
2) new cases are under 5,000 per day, and
3) hospitalizations are below 3,000.
According to the CDC, 234.6 million doses have been administered. 37.8% of the population over 18 is fully vaccinated, and 54.5% of the population over 18 has had at least one dose (140.8 million people over 18 have had at least one dose).
And check out COVID Act Now to see how each state is doing.
Almost 18,000 US deaths were reported so far in April due to COVID.
 Click on graph for larger image.
This graph shows the daily (columns) 7 day average (line) of positive tests reported.
Note: The ups and downs during the Winter surge were related to reporting delays due to the Thanksgiving and Christmas holidays.
This data is from the CDC.
 Click on graph for larger image.
This graph shows the daily (columns) 7 day average (line) of positive tests reported.
Note: The ups and downs during the Winter surge were related to reporting delays due to the Thanksgiving and Christmas holidays.
This data is from the CDC.
The 7-day average is 53,934, down from 55,080 yesterday, and down from the recent peak of 69,878 on April 13, 2021. This is the lowest since March 21st, but well above the post-summer surge low of 34,668.
The second graph shows the number of people hospitalized.
 This data is also from the CDC.
The CDC cautions that due to reporting delays, the area in grey will probably increase.
The second graph shows the number of people hospitalized.
 This data is also from the CDC.
The CDC cautions that due to reporting delays, the area in grey will probably increase.
The current 7-day average is 37,606, up from 37,092 reported yesterday, and well above the post-summer surge low of 23,000.
FOMC Statement: No Policy Change, Upgrade to Outlook
by Calculated Risk on 4/28/2021 02:05:00 PM
Fed Chair Powell press conference video here starting at 2:30 PM ET.
FOMC Statement:
The Federal Reserve is committed to using its full range of tools to support the U.S. economy in this challenging time, thereby promoting its maximum employment and price stability goals.
The COVID-19 pandemic is causing tremendous human and economic hardship across the United States and around the world. Amid progress on vaccinations and strong policy support, indicators of economic activity and employment have strengthened. The sectors most adversely affected by the pandemic remain weak but have shown improvement. Inflation has risen, largely reflecting transitory factors. Overall financial conditions remain accommodative, in part reflecting policy measures to support the economy and the flow of credit to U.S. households and businesses.
The path of the economy will depend significantly on the course of the virus, including progress on vaccinations. The ongoing public health crisis continues to weigh on the economy, and risks to the economic outlook remain.
The Committee seeks to achieve maximum employment and inflation at the rate of 2 percent over the longer run. With inflation running persistently below this longer-run goal, the Committee will aim to achieve inflation moderately above 2 percent for some time so that inflation averages 2 percent over time and longer‑term inflation expectations remain well anchored at 2 percent. The Committee expects to maintain an accommodative stance of monetary policy until these outcomes are achieved. The Committee decided to keep the target range for the federal funds rate at 0 to 1/4 percent and expects it will be appropriate to maintain this target range until labor market conditions have reached levels consistent with the Committee's assessments of maximum employment and inflation has risen to 2 percent and is on track to moderately exceed 2 percent for some time. In addition, the Federal Reserve will continue to increase its holdings of Treasury securities by at least $80 billion per month and of agency mortgage‑backed securities by at least $40 billion per month until substantial further progress has been made toward the Committee's maximum employment and price stability goals. These asset purchases help foster smooth market functioning and accommodative financial conditions, thereby supporting the flow of credit to households and businesses.
In assessing the appropriate stance of monetary policy, the Committee will continue to monitor the implications of incoming information for the economic outlook. The Committee would be prepared to adjust the stance of monetary policy as appropriate if risks emerge that could impede the attainment of the Committee's goals. The Committee's assessments will take into account a wide range of information, including readings on public health, labor market conditions, inflation pressures and inflation expectations, and financial and international developments.
Voting for the monetary policy action were Jerome H. Powell, Chair; John C. Williams, Vice Chair; Thomas I. Barkin; Raphael W. Bostic; Michelle W. Bowman; Lael Brainard; Richard H. Clarida; Mary C. Daly; Charles L. Evans; Randal K. Quarles; and Christopher J. Waller.
emphasis added
House Prices and Inventory
by Calculated Risk on 4/28/2021 09:30:00 AM
Watching existing home "for sale" inventory is very helpful. As an example, the increase in inventory in late 2005 helped me call the top for housing.
And the decrease in inventory eventually helped me correctly call the bottom for house prices in early 2012, see: The Housing Bottom is Here.
And in 2015, it appeared the inventory build in several markets was ending, and that boosted price increases.
In 2020, with the pandemic, inventory dropped to record lows, and prices really increased (record low mortgage rates and demographics were factors too).
I don't have a crystal ball, but watching inventory helps understand the housing market.
 Click on graph for larger image.
This graph below shows existing home months-of-supply (from the NAR) vs. the seasonally adjusted month-to-month price change in the Case-Shiller National Index (both since January 1999 through February 2021).
There is a clear relationship, and this is no surprise (but interesting to graph). If months-of-supply is high, prices decline. If months-of-supply is low, prices rise.
In February, months-of-supply was at 2.0 months, and the Case-Shiller National Index increased 1.1% month-over-month. The arrow points to the February dot.
In the existing home sales report released last week, the NAR reported months-of-supply at 2.1 months in March. There is a seasonal pattern to inventory, but this is just above the record low of 1.9 months for December 2020 and January 2021 - and prices are increasing sharply.
In the existing home sales report released last week, the NAR reported months-of-supply at 2.1 months in March. There is a seasonal pattern to inventory, but this is just above the record low of 1.9 months for December 2020 and January 2021 - and prices are increasing sharply.
MBA: Mortgage Applications Decrease in Latest Weekly Survey
by Calculated Risk on 4/28/2021 07:00:00 AM
From the MBA: Mortgage Applications Decrease in Latest MBA Weekly Survey
Mortgage applications decreased 2.5 percent from one week earlier, according to data from the Mortgage Bankers Association’s (MBA) Weekly Mortgage Applications Survey for the week ending April 23, 2021.
... The Refinance Index decreased 1 percent from the previous week and was 18 percent lower than the same week one year ago. The seasonally adjusted Purchase Index decreased 5 percent from one week earlier. The unadjusted Purchase Index decreased 4 percent compared with the previous week and was 34 percent higher than the same week one year ago.
“Mortgage applications decreased last week, even as mortgage rates dropped for the third week in a row. The 30-year fixed rate was down 3 basis points to 3.17 percent, which is still 32 basis points higher than the low reported in December 2020. Even with a few weeks of lower rates, most borrowers have likely already refinanced, which is why activity has decreased in seven of the last eight weeks,” said Joel Kan, MBA’s Associate Vice President of Economic and Industry Forecasting. “The purchase market’s recent slide comes despite a strengthening economy and labor market. Activity is still above year-ago levels, but accelerating home-price growth and low inventory has led to a decline in purchase applications in four of the last five weeks.”
...
The average contract interest rate for 30-year fixed-rate mortgages with conforming loan balances ($548,250 or less) decreased to 3.17 percent from 3.20 percent, with points decreasing to 0.30 from 0.36 (including the origination fee) for 80 percent loan-to-value ratio (LTV) loans.
emphasis added
 Click on graph for larger image.
The first graph shows the refinance index since 1990.
With low rates, the index remains elevated, but below recent levels since mortgage rates have moved up from the record lows.
The second graph shows the MBA mortgage purchase index
 According to the MBA, purchase activity is up 34% year-over-year unadjusted.
Note: Until the 2nd half of May, the MBA index will be up sharply year-over-year since purchase activity collapsed in late March 2020 in the early weeks of the pandemic.
Note: Red is a four-week average (blue is weekly).


