 RSS Feed
 by Calculated Risk on 5/27/2021 11:39:00 AM
Thursday, May 27, 2021
Hotels: Occupancy Rate Down 15% Compared to Same Week in 2019
Note: The year-over-year occupancy comparisons are easy, since occupancy declined sharply at the onset of the pandemic. However, occupancy is still down significantly from normal levels.
The occupancy rate is down 15.1% compared to the same week in 2019.
U.S. weekly hotel occupancy reached the 60% mark for the first time since the start of the pandemic, according to STR‘s latest data through May 22.The following graph shows the seasonal pattern for the hotel occupancy rate using the four week average.
May 16-22, 2021 (percentage change from comparable week in 2019*):
• Occupancy: 60.3% (-15.1%)
• Average daily rate (ADR): US$115.57 (-13.6%)
• Revenue per available room (RevPAR): US$69.69 (-26.6%)
ADR also reached its highest point of the pandemic but was still US$18 less than the corresponding week in 2019. RevPAR also hit a high point when compared to 2019.
emphasis added
 Click on graph for larger image.
The red line is for 2021, black is 2020, blue is the median, dashed purple is 2019, and dashed light blue is for 2009 (the worst year on record for hotels prior to 2020).
Occupancy is now above the horrible 2009 levels.
Note: Y-axis doesn't start at zero to better show the seasonal change.
Note: Y-axis doesn't start at zero to better show the seasonal change.
NAR: Pending Home Sales Decreased 4.4% in April
by Calculated Risk on 5/27/2021 10:03:00 AM
From the NAR: Pending Home Sales Drop 4.4% in April
Pending home sales took a step backward in April, according to the National Association of Realtors®. All four U.S. regions recorded year-over-year increases, but only the Midwest witnessed month-over-month gains in terms of pending home sales contract transactions.This was well below expectations of a 1.2% increase for this index. Note: Contract signings usually lead sales by about 45 to 60 days, so this would usually be for closed sales in May and June.
The Pending Home Sales Index (PHSI), a forward-looking indicator of home sales based on contract signings, fell 4.4% to 106.2 in April. Year-over-year, signings jumped 51.7% as last year's pandemic-related shutdowns slumped sales to an all-time low. An index of 100 is equal to the level of contract activity in 2001.
...
The Northeast PHSI declined 12.9% to 85.3 in April, a 96.5% jump from a year ago. In the Midwest, the index increased 3.5% to 101.1 last month, up 39.4% from April 2020.
Pending home sales transactions in the South fell 6.1% to an index of 128.9 in April, up 45.3% from April 2020. The index in the West decreased 2.6% in April to 92.0, up 57.3% from a year prior.
emphasis added
Weekly Initial Unemployment Claims decrease to 406,000
by Calculated Risk on 5/27/2021 08:40:00 AM
The DOL reported:
In the week ending May 22, the advance figure for seasonally adjusted initial claims was 406,000, a decrease of 38,000 from the previous week's unrevised level of 444,000. This is the lowest level for initial claims since March 14, 2020 when it was 256,000. The 4-week moving average was 458,750, a decrease of 46,000 from the previous week's unrevised average of 504,750. This is the lowest level for this average since March 14, 2020 when it was 225,500.This does not include the 93,546 initial claims for Pandemic Unemployment Assistance (PUA) that was down from 95,142 the previous week.
emphasis added
The following graph shows the 4-week moving average of weekly claims since 1971.
 Click on graph for larger image.
The dashed line on the graph is the current 4-week average. The four-week average of weekly unemployment claims decreased to 458,750.
The previous week was unrevised.
Regular state continued claims decreased to 3,642,000 (SA) from 3,738,000 (SA) the previous week.
Note: There are an additional 6,515,657 receiving Pandemic Unemployment Assistance (PUA) that decreased from 6,606,198 the previous week (there are questions about these numbers). This is a special program for business owners, self-employed, independent contractors or gig workers not receiving other unemployment insurance. And an additional 5,191,642 receiving Pandemic Emergency Unemployment Compensation (PEUC) up from 5,142,370.
Weekly claims were lower than the consensus forecast.
Q1 GDP Growth Unchanged at 6.4% Annual Rate
by Calculated Risk on 5/27/2021 08:33:00 AM
From the BEA: Gross Domestic Product, 1st Quarter 2021 (Second Estimate); Corporate Profits, 1st Quarter 2021 (Preliminary Estimate)
Real gross domestic product (GDP) increased at an annual rate of 6.4 percent in the first quarter of 2021 , according to the "second" estimate released by the Bureau of Economic Analysis. In the fourth quarter of 2020, real GDP increased 4.3 percent.Here is a Comparison of Second and Advance Estimates. PCE growth was revised up from 10.7% to 11.3%. Residential investment was revised up from 10.8% to 12.7%. This was slightly below the consensus forecast.
The GDP estimate released today is based on more complete source data than were available for the "advance" estimate issued last month. In the advance estimate, the increase in real GDP was also 6.4 percent. Upward revisions to consumer spending and nonresidential fixed investment were offset by downward revisions to exports and private inventory investment. Imports, which are a subtraction in the calculation of GDP, were revised up
emphasis added
Wednesday, May 26, 2021
Thursday: GDP, Unemployment Claims, Durable Goods, Pending Home Sales
by Calculated Risk on 5/26/2021 09:00:00 PM
Thursday:
• At 8:30 AM ET, The initial weekly unemployment claims report will be released. The consensus is for a decrease to 420 thousand from 444 thousand last week.
• Also at 8:30 AM, Gross Domestic Product, 1st quarter 2021 (Second estimate). The consensus is that real GDP increased 6.5% annualized in Q1, up from the advance estimate of 6.4%.
• Also at 8:30 AM, Durable Goods Orders for April from the Census Bureau. The consensus is for a 0.8% increase in durable goods orders.
• At 10:00 AM, Pending Home Sales Index for April. The consensus is for a 1.2% increase in the index.
• At 11:00 AM, the Kansas City Fed manufacturing survey for May.
May 26th COVID-19 New Cases, Vaccinations, Hospitalizations
by Calculated Risk on 5/26/2021 04:09:00 PM
The economy will pick up speed as more and more people get vaccinated!
According to the CDC, on Vaccinations. Total administered: 289,212,304, as of yesterday 287,788,872. Day: 1.42 million. (U.S. Capacity is around 4 million per day)
1) 61.8% of the population over 18 has had at least one dose (70% is the goal by July 4th).
2) 131.8 million Americans are fully vaccinated (160 million goal by July 4th)
Note: I'll stop posting this daily once all four of these criteria are met:
1) 70% of the population over 18 has had at least one dose of vaccine, and
2) new cases are under 5,000 per day, and
3) hospitalizations are below 3,000, and
4) average daily deaths under 50 (currently 435 per day).
And check out COVID Act Now to see how each state is doing.
Almost 13,000 US deaths were reported so far in May due to COVID.
 Click on graph for larger image.
This graph shows the daily (columns) 7 day average (line) of positive tests reported.
This data is from the CDC.
 Click on graph for larger image.
This graph shows the daily (columns) 7 day average (line) of positive tests reported.
This data is from the CDC.
The 7-day average is 22,139, down from 23,220 yesterday. This is the lowest since June 9, 2020.
The second graph shows the number of people hospitalized.
 This data is also from the CDC.
The CDC cautions that due to reporting delays, the area in grey will probably increase.
The current 7-day average is 22,810, down from 23,183 reported yesterday, and below the post-summer surge low.
The second graph shows the number of people hospitalized.
 This data is also from the CDC.
The CDC cautions that due to reporting delays, the area in grey will probably increase.
The current 7-day average is 22,810, down from 23,183 reported yesterday, and below the post-summer surge low.
House Prices and Inventory
by Calculated Risk on 5/26/2021 01:37:00 PM
Watching existing home "for sale" inventory is very helpful. As an example, the increase in inventory in late 2005 helped me call the top for housing.
And the decrease in inventory eventually helped me correctly call the bottom for house prices in early 2012, see: The Housing Bottom is Here.
And in 2015, it appeared the inventory build in several markets was ending, and that boosted price increases.
In 2020, with the pandemic, inventory dropped to record lows, and prices really increased (record low mortgage rates and demographics were factors too).
I don't have a crystal ball, but watching inventory helps understand the housing market.
 Click on graph for larger image.
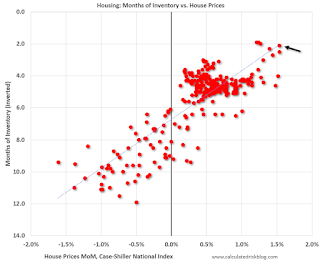
This graph below shows existing home months-of-supply (inverted, from the NAR) vs. the seasonally adjusted month-to-month price change in the Case-Shiller National Index (both since January 1999 through March 2021).
I don't have a crystal ball, but watching inventory helps understand the housing market.
 Click on graph for larger image.
This graph below shows existing home months-of-supply (inverted, from the NAR) vs. the seasonally adjusted month-to-month price change in the Case-Shiller National Index (both since January 1999 through March 2021).
There is a clear relationship, and this is no surprise (but interesting to graph). If months-of-supply is high, prices decline. If months-of-supply is very low (like now), prices rise quickly.
In March, the months-of-supply was at 2.1 months, and the Case-Shiller National Index (SA) increased 1.5% month-over-month (a month-over-month record). The black arrow points to the March dot.
In the April existing home sales report released last week, the NAR reported months-of-supply increased to 2.4 month in April. There is a seasonal pattern to inventory, but this is still very low - and prices are increasing sharply.
In the April existing home sales report released last week, the NAR reported months-of-supply increased to 2.4 month in April. There is a seasonal pattern to inventory, but this is still very low - and prices are increasing sharply.
Freddie Mac: Mortgage Serious Delinquency Rate decreased in April
by Calculated Risk on 5/26/2021 10:42:00 AM
Freddie Mac reported that the Single-Family serious delinquency rate in April was 2.15%, down from 2.34% in March. Freddie's rate is up year-over-year from 0.64% in April 2020.
Freddie's serious delinquency rate peaked in February 2010 at 4.20% following the housing bubble, and peaked at 3.17% in August 2020 during the pandemic.
These are mortgage loans that are "three monthly payments or more past due or in foreclosure".
 Click on graph for larger image
Mortgages in forbearance are being counted as delinquent in this monthly report, but they will not be reported to the credit bureaus.
This is very different from the increase in delinquencies following the housing bubble. Lending standards have been fairly solid over the last decade, and most of these homeowners have equity in their homes - and they will be able to restructure their loans once (if) they are employed.
Also - for multifamily - delinquencies were at 0.20%, up from 0.17% in March, and up more than double from 0.08% in April 2020.
New Home Prices
by Calculated Risk on 5/26/2021 10:21:00 AM
As part of the new home sales report released yesterday, the Census Bureau reported the number of homes sold by price and the average and median prices.
From the Census Bureau: "The median sales price of new houses sold in April 2021 was $372,400. The average sales price was $435,400."
The following graph shows the median and average new home prices.
 Click on graph for larger image.
During the housing bust, the builders had to build smaller and less expensive homes to compete with all the distressed sales. When housing started to recovery - with limited finished lots in recovering areas - builders moved to higher price points to maximize profits.
Then the average and median house prices mostly moved sideways since 2017 due to home builders offering more lower priced homes. Prices picked up during the pandemic, and really picked up recently.
The average price in April 2021 was $435,400, up 21% year-over-year. The median price was $372,400, up 20% year-over-year.
The second graph shows the percent of new homes sold by price.
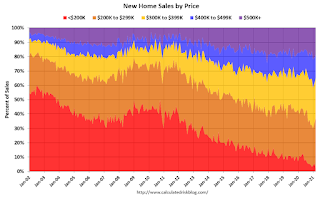 Very few new homes sold were under $200K in April 2021 (about 2.6% of all homes). This is down from 56% in 2002. In general, the under $200K bracket is going away.
The $400K and greater than $500K+ brackets increased significantly over the last decade. A majority of new homes (about 59% in April) in the U.S., are in the $200K to $400K range.
The average price in April 2021 was $435,400, up 21% year-over-year. The median price was $372,400, up 20% year-over-year.
The second graph shows the percent of new homes sold by price.
 Very few new homes sold were under $200K in April 2021 (about 2.6% of all homes). This is down from 56% in 2002. In general, the under $200K bracket is going away.
 The $400K and greater than $500K+ brackets increased significantly over the last decade. A majority of new homes (about 59% in April) in the U.S., are in the $200K to $400K range.
MBA: Mortgage Applications Decrease in Latest Weekly Survey
by Calculated Risk on 5/26/2021 07:00:00 AM
From the MBA: Mortgage Applications Decrease in Latest MBA Weekly Survey
Mortgage applications decreased 4.2 percent from one week earlier, according to data from the Mortgage Bankers Association’s (MBA) Weekly Mortgage Applications Survey for the week ending May 21, 2021.
... The Refinance Index decreased 7 percent from the previous week and was 9 percent lower than the same week one year ago. The seasonally adjusted Purchase Index increased 2 percent from one week earlier. The unadjusted Purchase Index increased 1 percent compared with the previous week and was 4 percent lower than the same week one year ago.
“Mortgage applications decreased last week as mortgage rates increased to 3.18 percent. Refinances dropped 7 percent as a result, driven by declines in both conventional and government refinance activity,” said Joel Kan, MBA’s Associate Vice President of Economic and Industry Forecasting. “Purchase applications increased for the second time in three weeks, rebounding after a rather weak April with mostly weekly declines. While purchase activity was around 4 percent lower than a year ago, the comparison is to last spring’s large upswing in activity as pandemic-related lockdowns lifted. Demand is robust throughout the country, but homebuyers continue to be held back by the lack of homes for sale and rapidly increasing home prices.”
...
The average contract interest rate for 30-year fixed-rate mortgages with conforming loan balances ($548,250 or less) increased to 3.18 percent from 3.15 percent, with points decreasing to 0.35 from 0.36 (including the origination fee) for 80 percent loan-to-value ratio (LTV) loans.
emphasis added
 Click on graph for larger image.
The first graph shows the refinance index since 1990.
With low rates, the index remains elevated, but below recent levels since mortgage rates have moved up from the record lows.
The second graph shows the MBA mortgage purchase index
 According to the MBA, purchase activity is down 4% year-over-year unadjusted.
Note: The year ago comparisons for the unadjusted purchase index are now more difficult since purchase activity picked up in late May 2020.
Note: Red is a four-week average (blue is weekly).


