 RSS Feed
 by Calculated Risk on 5/29/2021 08:11:00 AM
Saturday, May 29, 2021
Schedule for Week of May 30, 2021
The key report scheduled for this week is the May employment report.
Other key reports include the May ISM Manufacturing and Service surveys, and May Vehicle Sales.
All US markets will be closed in observance of Memorial Day.
8:00 AM: Corelogic House Price index for April.
10:00 AM: ISM Manufacturing Index for May. The consensus is for the ISM to be at 61.0, up from 60.7 in April. The employment index was at 55.1% in April, and the new orders index was at 64.3%.
10:00 AM: Construction Spending for April. The consensus is for a 0.6% increase in construction spending.
10:30 AM: Dallas Fed Survey of Manufacturing Activity for May. This is the last of the regional surveys for May.
 All day: Light vehicle sales for May. The consensus is for light vehicle sales to be 18.0 million SAAR in May, down from 18.5 million in April (Seasonally Adjusted Annual Rate).
Wards Auto is forecasting a decline in sales to 16.5 million SAAR.
This graph shows light vehicle sales since the BEA started keeping data in 1967. The dashed line is the sales rate for last month.
----- Wednesday, June 2nd -----
7:00 AM ET: The Mortgage Bankers Association (MBA) will release the results for the mortgage purchase applications index.
2:00 PM: the Federal Reserve Beige Book, an informal review by the Federal Reserve Banks of current economic conditions in their Districts.
----- Thursday, June 3rd -----
8:15 AM: The ADP Employment Report for May. This report is for private payrolls only (no government). The consensus is for 650,000 payroll jobs added in May, down from 742,000 in April.
8:30 AM: The initial weekly unemployment claims report will be released. The consensus is for a decrease to 395 thousand from 406 thousand last week.
10:00 AM: the ISM Services Index for May. The consensus is for a reading of 63.0, up from 62.7.
----- Friday, June 4th -----
7:00 AM: Speech, Fed Chair Jerome Powell, Central banks and climate change, At the Green Swan 2021 Global Virtual Conference
 8:30 AM: Employment Report for May. The consensus is for 650,000 jobs added, and for the unemployment rate to decrease to 5.9%.
There were 266,000 jobs added in April, and the unemployment rate was at 6.1%.
This graph shows the job losses from the start of the employment recession, in percentage terms.
The current employment recession was by far the worst recession since WWII in percentage terms, but currently is not as severe as the worst of the "Great Recession".
This graph shows light vehicle sales since the BEA started keeping data in 1967. The dashed line is the sales rate for last month.
7:00 AM ET: The Mortgage Bankers Association (MBA) will release the results for the mortgage purchase applications index.
2:00 PM: the Federal Reserve Beige Book, an informal review by the Federal Reserve Banks of current economic conditions in their Districts.
8:15 AM: The ADP Employment Report for May. This report is for private payrolls only (no government). The consensus is for 650,000 payroll jobs added in May, down from 742,000 in April.
8:30 AM: The initial weekly unemployment claims report will be released. The consensus is for a decrease to 395 thousand from 406 thousand last week.
10:00 AM: the ISM Services Index for May. The consensus is for a reading of 63.0, up from 62.7.
7:00 AM: Speech, Fed Chair Jerome Powell, Central banks and climate change, At the Green Swan 2021 Global Virtual Conference
 8:30 AM: Employment Report for May. The consensus is for 650,000 jobs added, and for the unemployment rate to decrease to 5.9%.
There were 266,000 jobs added in April, and the unemployment rate was at 6.1%.
This graph shows the job losses from the start of the employment recession, in percentage terms.
The current employment recession was by far the worst recession since WWII in percentage terms, but currently is not as severe as the worst of the "Great Recession".
Friday, May 28, 2021
Real Personal Income less Transfer Payments Above Previous Peak
by Calculated Risk on 5/28/2021 03:48:00 PM
Government transfer payments decreased sharply in April compared to March, but were still almost $1.4 trillion (on SAAR basis) above the February 2020 level (pre-pandemic). Most of the increase in transfer payments - compared to the levels prior to the crisis - is from unemployment insurance and "other" (includes direct payments).
This table shows the amount of unemployment insurance and "Other" transfer payments since February 2020 (pre-crisis level). The increase in "Other" was mostly due to parts of the relief acts including direct payments.
There was a large increase in "Other" in March due to the American Rescue Plan Act.
Note: Not in the table below, but Social Security payments haven't increased significantly since the pre-recession levels (from $1,065 billion SAAR in Jan 2020 to $1,108 billion SAAR in Apr 2021).
A key measure of the health of the economy (Used by NBER in recession dating) is Real Personal Income less Transfer payments.
 Click on graph for larger image.
This graph shows real personal income less transfer payments since 1990.
This measure of economic activity increased 0.5% in April, compared to March, and was up 0.3% compared to February 2020 (previous peak).
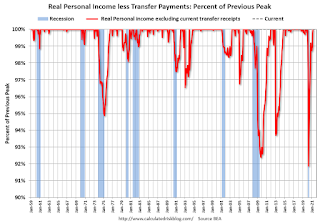 Another way to look at this data is as a percent of the previous peak.
Real personal income less transfer payments was off 8.1% in April 2020. That was a larger decline than the worst of the great recession.
Currently personal income less transfer payments are at a new peak.
This is the first of the key NBER measures - GDP, Employment, Industrial Production, Real Personal Income less Transfer Payments - that is above pre-recession levels. GDP will be above pre-recession levels in Q2.
| Selected Transfer Payments Billions of dollars, SAAR | ||
|---|---|---|
| Other | Unemployment Insurance | |
| Feb-20 | $506 | $28 |
| Mar-20 | $515 | $74 |
| Apr-20 | $3,379 | $493 |
| May-20 | $1,360 | $1,356 |
| Jun-20 | $758 | $1,405 |
| Jul-20 | $760 | $1,331 |
| Aug-20 | $692 | $636 |
| Sep-20 | $936 | $359 |
| Oct-20 | $732 | $304 |
| Nov-20 | $620 | $281 |
| Dec-20 | $654 | $304 |
| Jan-21 | $2,354 | $556 |
| Feb-21 | $777 | $535 |
| Mar-21 | $4,747 | $541 |
| Apr-21 | $1,400 | $495 |
A key measure of the health of the economy (Used by NBER in recession dating) is Real Personal Income less Transfer payments.
 Click on graph for larger image.
This graph shows real personal income less transfer payments since 1990.
This measure of economic activity increased 0.5% in April, compared to March, and was up 0.3% compared to February 2020 (previous peak).
 Another way to look at this data is as a percent of the previous peak.
Real personal income less transfer payments was off 8.1% in April 2020. That was a larger decline than the worst of the great recession.
Currently personal income less transfer payments are at a new peak.
This is the first of the key NBER measures - GDP, Employment, Industrial Production, Real Personal Income less Transfer Payments - that is above pre-recession levels. GDP will be above pre-recession levels in Q2.
May 28th COVID-19 New Cases, Vaccinations, Hospitalizations
by Calculated Risk on 5/28/2021 03:42:00 PM
This data is from the CDC.
According to the CDC, on Vaccinations.
Total doses administered: 292,099,778, as of yesterday 290,724,607. Day: 1.38 million.
| COVID Metrics | |||
|---|---|---|---|
| Current | Yesterday | Goal | |
| Percent over 18, One Dose | 62.2% | 62.0% | 70.0%1,2 |
| Fully Vaccinated (millions) | 133.5 | 132.8 | 1601 |
| New Cases per Day3 | 20,882 | 21,659 | 5,0002 |
| Hospitalized3 | 21,928 | 22,443 | 3,0002 |
| Deaths per Day3 | 453 | 437 | 502 |
| 1 America's Goal by July 4th, 2my goals to stop daily posts, 37 day average for Cases, Hospitalized, and Deaths | |||
KUDOS to the ten states that have already achieved the 70% goal: Vermont, Hawaii, Massachusetts, Connecticut, Maine, New Jersey, Rhode Island, New Mexico, Pennsylvania and New Hampshire.
Next up are Maryland at 69.6%, California at 69.3%, and Washington at 68.2%.
Fannie Mae: Mortgage Serious Delinquency Rate Decreased in April
by Calculated Risk on 5/28/2021 01:32:00 PM
Fannie Mae reported that the Single-Family Serious Delinquency decreased to 2.38% in April, from 2.58% in March. The serious delinquency rate is up from 0.70% in April 2020.
These are mortgage loans that are "three monthly payments or more past due or in foreclosure".
The Fannie Mae serious delinquency rate peaked in February 2010 at 5.59% following the housing bubble, and peaked at 3.32% in August 2020 during the pandemic.
 Click on graph for larger image
By vintage, for loans made in 2004 or earlier (2% of portfolio), 5.44% are seriously delinquent (down from 5.66% in March). For loans made in 2005 through 2008 (2% of portfolio), 9.33% are seriously delinquent (down from 9.65%), For recent loans, originated in 2009 through 2021 (96% of portfolio), 1.94% are seriously delinquent (down from 2.13%). So Fannie is still working through a few poor performing loans from the bubble years.
Mortgages in forbearance are counted as delinquent in this monthly report, but they will not be reported to the credit bureaus.
This is very different from the increase in delinquencies following the housing bubble. Lending standards have been fairly solid over the last decade, and most of these homeowners have equity in their homes - and they will be able to restructure their loans once they are employed.
Note: Freddie Mac reported earlier.
Q2 GDP Forecasts: Around 10%
by Calculated Risk on 5/28/2021 11:17:00 AM
From Merrill Lynch:
We continue to track 11% qoq saar after robust capex data this week [May 28 estimate]From Goldman Sachs:
emphasis added
We lowered our Q2 GDP tracking estimate by 0.5pp to +9.5% (qoq ar) to reflect the higher price deflator and the composition of the nominal spending revisions. [May 28 estimate]From the NY Fed Nowcasting Report
The New York Fed Staff Nowcast stands at 4.3% for 2021:Q2. [May 28 estimate]And from the Altanta Fed: GDPNow
The GDPNow model estimate for real GDP growth (seasonally adjusted annual rate) in the second quarter of 2021 is 9.3 percent on May 28, up from 9.1 percent on May 27. [May 28 estimate]
Black Knight: Number of Homeowners in COVID-19-Related Forbearance Plans Increased
by Calculated Risk on 5/28/2021 09:28:00 AM
Note: Both Black Knight and the MBA (Mortgage Bankers Association) are putting out weekly estimates of mortgages in forbearance.
This data is as of May 25th.
From Black Knight: Forbearance Volumes Increase Again, Moderate Opportunity for Additional Improvement in Early June
The country saw another week of forbearance increases this week, with volumes rising by another 16k (+0.73%). This marked the second consecutive week of increases after a sustained downward trend. Despite the raising volume, this is still only the third overall increase over the past 12 weeks. As of May 25, 2.2M (4.1% of) homeowners remain in COVID-19 related forbearance plans, including 2.4% of GSE, 7.3% of FHA/VA and 4.8% of portfolio/PLS loans.
Click on graph for larger image.
After seeing improvement accelerate as early forbearance entrants went through the 12-month review process in March and April, exit activity has since returned to more “normal” levels. Mid- to late-month increases in forbearance plan volumes like we’ve seen in the past two weeks have been very common during the recovery to-date.
Plan starts hit their highest level in nine weeks, primarily driven by elevated levels of restart activity. while new plans starts still remain low, they edged slightly upward, hitting their highest level in nine weeks as well.
...
Nearly 145k plans are still listed with May 2021 expirations, providing a moderate opportunity for additional improvements over the next two weeks and, more acutely, in early June. Another 780k plans are currently slated for review for extension/removal in June, the final quarterly review before early forbearance entrants begin to reach their 18-month plan expirations later this year.
June will mark the 15-month review point for many of the early forbearance entrants, so we will be watching exit velocity closely during that time.
emphasis added

Personal Income Decreased 13.1% in April, Spending increased 2.4%
by Calculated Risk on 5/28/2021 08:37:00 AM
The BEA released the Personal Income and Outlays report for April:
Personal income decreased $3.21 trillion (13.1 percent) in April according to estimates released today by the Bureau of Economic Analysis. Disposable personal income (DPI) decreased $3.22 trillion (14.6 percent) and personal consumption expenditures (PCE) increased $80.3 billion (0.5 percent).The April PCE price index increased 3.6 percent year-over-year and the April PCE price index, excluding food and energy, increased 3.1 percent year-over-year.
Real DPI decreased 15.1 percent in April and Real PCE decreased 0.1 percent; goods decreased 1.3 percent and services increased 0.6 percent. The PCE price index increased 0.6 percent. Excluding food and energy, the PCE price index increased 0.7 percent.
emphasis added
The following graph shows real Personal Consumption Expenditures (PCE) through April 2021 (2012 dollars). Note that the y-axis doesn't start at zero to better show the change.
 Click on graph for larger image.
The dashed red lines are the quarterly levels for real PCE.
Personal income was above expectations, and the increase in PCE was at expectations.
Thursday, May 27, 2021
Friday: Personal Income & Outlays
by Calculated Risk on 5/27/2021 09:03:00 PM
Friday:
• At 8:30 AM ET, Personal Income and Outlays, April 2021. The consensus is for a 14.8% decrease in personal income, and for a 0.5% increase in personal spending. And for the Core PCE price index to increase 0.6%.
• At 9:45 AM, Chicago Purchasing Managers Index for May.
• At 10:00 AM, University of Michigan's Consumer sentiment index (Final for May). The consensus is for a reading of 83.0.
Las Vegas Visitor Authority for April: No Convention Attendance, Visitor Traffic Down 27% Compared to 2019
by Calculated Risk on 5/27/2021 04:58:00 PM
From the Las Vegas Visitor Authority: April 2021 Las Vegas Visitor Statistics
Visitation continued to ramp up in April as the destination welcomed more than 2.5M visitors, up more than 15% MoM and down roughly ‐27% vs. pre‐COVID levels in Apr 2019.
Hotel occupancy increased to 65.6%, up 10.1 pts MoM, with Weekend occupancy improving to 83.5%, up 5.8 pts MoM and within 13 pts of Apr 2019 levels.
 Click on graph for larger image.
 The first graph shows visitor traffic for 2019 (blue), 2020 (orange) and 2021 (red).
Visitor traffic was down 27.3% compared to the same month in 2019.
Convention traffic was non-existent again in April, and was down 100% compared to April 2019.
There has been no convention traffic since March 2020.
I'll add a graph of convention traffic once conventions start to reopen.
Note: A convention is scheduled for early June (HT MS): "Informa Markets, organizers of the World of Concrete, has received approval from the Nevada Department of Business and Industry to move forward with its 2021 in-person edition. The event is scheduled to be held June 8-10, 2021 at the Las Vegas Convention Center."
May 27th COVID-19 New Cases, Vaccinations, Hospitalizations
by Calculated Risk on 5/27/2021 03:38:00 PM
I'm switching to a simple table to track progress.
| COVID Metrics (7 day average Cases, Hospitalized, Deaths) | |||
|---|---|---|---|
| Current | Yesterday | Goal | |
| Percent over 18, One Dose | 62.0% | 61.8% | 70.0%1,2 |
| Fully Vaccinated (millions) | 132.8 | 131.8 | 1601 |
| New Cases per Day | 21,627 | 22,139 | 5,0002 |
| Hospitalized | 22,443 | 22,810 | 3,0002 |
| Deaths per Day | 437 | 435 | 502 |
| 1 Biden Administration Goals, 2my goals | |||
This data is from the CDC.


