 RSS Feed
 by Calculated Risk on 6/04/2021 09:22:00 AM
Friday, June 04, 2021
Comments on May Employment Report
The headline jobs number in the April employment report was below expectations, however employment for the previous two months was revised up slightly.
Leisure and hospitality gained 292 thousand jobs. In March and April of 2020, leisure and hospitality lost 8.2 million jobs, and are now down 2.54 million jobs since February 2020. So leisure and hospitality has now added back almost 70% of the jobs lost in March and April 2020.
Construction employment declined 20 thousand in May, and State and Local education added 103 thousand jobs. Manufacturing added 23 thousand jobs.
Earlier: May Employment Report: 559 Thousand Jobs, 5.8% Unemployment Rate
In April, the year-over-year employment change was 11.900 million jobs. This turned positive in April due to the sharp jobs losses in April 2020.
Permanent Job Losers
 Click on graph for larger image.
This graph shows permanent job losers as a percent of the pre-recession peak in employment through the May report. (ht Joe Weisenthal at Bloomberg).
These jobs will likely be the hardest to recover.
This data is only available back to 1994, so there is only data for three recessions.
In May, the number of permanent job losers decreased to 3.234 million from 3.529 million in April.
Prime (25 to 54 Years Old) Participation
 Since the overall participation rate has declined due to cyclical (recession) and demographic (aging population, younger people staying in school) reasons, here is the employment-population ratio for the key working age group: 25 to 54 years old.
The prime working age will be key in the recovery.
The 25 to 54 participation rate was unchanged in May at 81.3% from 81.3% in April, and the 25 to 54 employment population ratio increased to 77.1% from 76.9% in April.
Part Time for Economic Reasons
 From the BLS report:
These workers are included in the alternate measure of labor underutilization (U-6) that decreased to 10.2% from 10.4% in April. This is down from the record high in April 22.9% for this measure since 1994.
Unemployed over 26 Weeks
 This graph shows the number of workers unemployed for 27 weeks or more.
According to the BLS, there are 3.752 million workers who have been unemployed for more than 26 weeks and still want a job, down from 4.183 million in April.
This does not include all the people that left the labor force. This will be a key measure to follow during the recovery.
Summary:
The headline monthly jobs number was below expectations, however the previous two months were revised up by 27,000 combined. The headline unemployment rate decreased to 5.8%, but the participation rate declined slightly.
This data is only available back to 1994, so there is only data for three recessions.
In May, the number of permanent job losers decreased to 3.234 million from 3.529 million in April.
Prime (25 to 54 Years Old) Participation
 Since the overall participation rate has declined due to cyclical (recession) and demographic (aging population, younger people staying in school) reasons, here is the employment-population ratio for the key working age group: 25 to 54 years old.
The prime working age will be key in the recovery.
The 25 to 54 participation rate was unchanged in May at 81.3% from 81.3% in April, and the 25 to 54 employment population ratio increased to 77.1% from 76.9% in April.
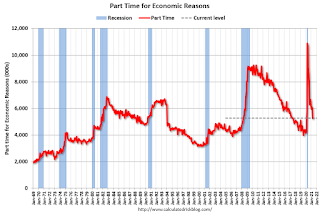
Part Time for Economic Reasons
 From the BLS report:
"The number of persons employed part time for economic reasons was essentially unchanged at 5.3 million in May but is 873,000 higher than in February 2020. These individuals, who would have preferred full-time employment, were working part time because their hours had been reduced or they were unable to find full-time jobs."The number of persons working part time for economic reasons increased slightly in May to 5.271 million from 5.243 million in April.
These workers are included in the alternate measure of labor underutilization (U-6) that decreased to 10.2% from 10.4% in April. This is down from the record high in April 22.9% for this measure since 1994.
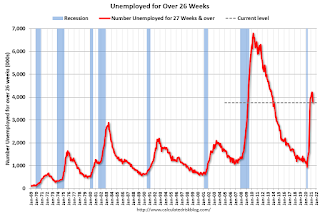
Unemployed over 26 Weeks
 This graph shows the number of workers unemployed for 27 weeks or more.
 According to the BLS, there are 3.752 million workers who have been unemployed for more than 26 weeks and still want a job, down from 4.183 million in April.
This does not include all the people that left the labor force. This will be a key measure to follow during the recovery.
Summary:
The headline monthly jobs number was below expectations, however the previous two months were revised up by 27,000 combined. The headline unemployment rate decreased to 5.8%, but the participation rate declined slightly.
There are still 7.6 million fewer jobs than in February 2020, and 3.2 million people have lost jobs permanently.
May Employment Report: 559 Thousand Jobs, 5.8% Unemployment Rate
by Calculated Risk on 6/04/2021 08:41:00 AM
From the BLS:
Total nonfarm payroll employment rose by 559,000 in May, and the unemployment rate declined by 0.3 percentage point to 5.8 percent, the U.S. Bureau of Labor Statistics reported today. Notable job gains occurred in leisure and hospitality, in public and private education, and in health care and social assistance.
...
The change in total nonfarm payroll employment for March was revised up by 15,000, from +770,000 to +785,000, and the change for April was revised up by 12,000, from +266,000 to +278,000. With these revisions, employment in March and April combined is 27,000 higher than previously reported.
emphasis added
 Click on graph for larger image.
The first graph shows the year-over-year change in total non-farm employment since 1968.
In May, the year-over-year change was 11.900 million jobs. This was up significantly - since employment collapsed in April 2020.
Total payrolls increased by 559 thousand in May. Private payrolls increased by 492 thousand.
Payrolls for March and April were revised up 27 thousand, combined.
 The second graph shows the job losses from the start of the employment recession, in percentage terms.
The current employment recession was by far the worst recession since WWII in percentage terms, but currently is not as severe as the worst of the "Great Recession".
The third graph shows the employment population ratio and the participation rate.
 The Labor Force Participation Rate decreased to 61.6% in May, from 61.7% in April. This is the percentage of the working age population in the labor force.
 The Employment-Population ratio increased to 58.0% from 57.9% (black line).
I'll post the 25 to 54 age group employment-population ratio graph later.
 The fourth graph shows the unemployment rate.
 The unemployment rate decreased in May to 5.8% from 6.1% in April.
This was below consensus expectations, however March and April were revised up by 27,000 combined.
I'll have more later ...
Black Knight: Number of Homeowners in COVID-19-Related Forbearance Plans Decreased
by Calculated Risk on 6/04/2021 08:16:00 AM
Note: Both Black Knight and the MBA (Mortgage Bankers Association) are putting out weekly estimates of mortgages in forbearance.
This data is as of June 1st.
From Black Knight: Forbearance Volumes Fall, Continuing Trend of Early-in-the-Month Improvement
Forbearance volumes fell by 71,000 (-3.2%) week-over-week, continuing the trend of early-in-the-month declines. Decreases were seen across all investor classes, with GSE forbearances falling by 26K (-3.8%), FHA/VA forbearances falling by 28K (-3.2%) and portfolio/PLS plans declining by 17K (-2.7%) over the past seven days.
With 65,000 plans still listed with May 2020 expirations, opportunity for an additional modest decline remains for next week as well. Some 700,000 plans are listed with June expirations, marking the final quarterly review for early forbearance entrants before they reach their 18-month expirations later this year.
Click on graph for larger image.
Plan starts saw their lowest weekly total since the onset of the pandemic, with both new forbearance starts and well as restarts both seeing noticeable declines this week. Another mark of the improvement seen this week: plan exits hit their highest level in four weeks, driven by plan expirations/reviews taking place at the end of May.
Given the large review volumes on the horizon, it will be worth keeping a close eye on exit activity in coming weeks – most acutely in the first week of July. As of June 1, 2.12 million (4.0% of) homeowners remain in pandemic-related forbearance plans, including 2.4% of GSE, 7.1% of FHA/VA and 4.7% of portfolio/PLS loans.
emphasis added

Thursday, June 03, 2021
Friday: Employment Report
by Calculated Risk on 6/03/2021 09:00:00 PM
My May Employment Preview
Goldman May Payrolls Preview
Friday:
• At 7:00 AM ET, Speech, Fed Chair Jerome Powell, Central banks and climate change, At the Green Swan 2021 Global Virtual Conference
• At 8:30 AM, Employment Report for May. The consensus is for 650,000 jobs added, and for the unemployment rate to decrease to 5.9%. There were 266,000 jobs added in April, and the unemployment rate was at 6.1%.
Denver Real Estate in May: Sales Up 49% YoY, Active Inventory Down 71%
by Calculated Risk on 6/03/2021 06:16:00 PM
Sales slumped in April and May 2020, so the year-over-year (YoY) increase is large. That will likely reverse in June and sales will be down YoY.
From the DMAR: Monthly Indicators, May 2021
Total Residential Units Sold in May 2021 were 5,322, up 48.7% from 3,578 in May 2020.
Active Residential Listings in May 2021 were 2,075, down from 2,594 last month, and down 71.1% from 7,170 in May 2020.
Inventory in Denver had been fairly steady over the last 6 or 7 years, but declined sharply in 2020. This is the lowest level of inventory for May on record.
Interesting - In May, half the homes listed were sold (under contract) within four days!
Goldman May Payrolls Preview
by Calculated Risk on 6/03/2021 04:25:00 PM
A few brief excerpts from a note by Goldman Sachs economist Spencer Hill:
We estimate nonfarm payrolls rose 750k in May (mom sa) ... Following the surprisingly weak April report, we believe the further easing of business restrictions more than offset a moderate drag from labor supply factors and seasonality. ... We estimate a three-tenths drop in the unemployment rate to 5.8% (consensus 5.9%), reflecting a strong household employment gain but a further rise in the participation rate.CR Note: The consensus is for 650 thousand jobs added, and for the unemployment rate to decrease to 5.9%.
emphasis added
June 3rd COVID-19 New Cases, Vaccinations, Hospitalizations
by Calculated Risk on 6/03/2021 03:58:00 PM
This data is from the CDC.
According to the CDC, on Vaccinations.
Total doses administered: 297,720,928, as of yesterday 296,912,892. Per Day: 0.81 million.
| COVID Metrics | |||
|---|---|---|---|
| Current | Yesterday | Goal | |
| Percent over 18, One Dose | 63.0% | 62.9% | ≥70.0%1,2 |
| Fully Vaccinated (millions) | 136.6 | 136.2 | ≥1601 |
| New Cases per Day3 | 14,349 | 15,643 | ≤5,0002 |
| Hospitalized3 | 19,289 | 19,674 | ≤3,0002 |
| Deaths per Day3 | 324 | 328 | ≤502 |
| 1 America's Goal by July 4th, 2my goals to stop daily posts, 37 day average for Cases, Hospitalized, and Deaths | |||
KUDOS to the residents of the twelve states that have already achieved the 70% goal: Vermont and Hawaii are over 80%, plus Massachusetts, Connecticut, Maine, New Jersey, Rhode Island, New Mexico, Pennsylvania, New Hampshire, Maryland and California are all over 70%.
Next up are Washington at 69.7%, D.C. at 68.5%, New York at 68.2%, Illinois at 67.8%, Minnesota at 67.6%, Virginia at 67.5%, Delaware at 66.8%, Colorado at 66.5% and Oregon at 66.2%.
May Employment Preview
by Calculated Risk on 6/03/2021 12:22:00 PM
On Friday at 8:30 AM ET, the BLS will release the employment report for May. The consensus is for 650 thousand jobs added, and for the unemployment rate to decrease to 5.9%.
Some analysts are being cautious this month after the disappointing April report.
 • First, currently there are still about 8.2 million fewer jobs than in February 2020 (before the pandemic).
This graph shows the job losses from the start of the employment recession, in percentage terms.
The current employment recession was by far the worst recession since WWII in percentage terms, but is now better than the worst of the "Great Recession".
• ADP Report: The ADP employment report showed a gain of 978,000 private sector jobs, well above the consensus estimate of 650,000 jobs added. The ADP report hasn't been very useful in predicting the BLS report, but this suggests the BLS report could be above expectations.
• ISM Surveys: Note that the ISM services are diffusion indexes based on the number of firms hiring (not the number of hires). The ISM® manufacturing employment index decreased in May to 50.9%, down from 55.1% last month. This would suggest approximately 15,000 manufacturing jobs lost in May. ADP showed 52,000 manufacturing jobs added.
The ISM® Services employment index decreased in May to 55.3%, from 58.8% last month. This would suggest over 200,000 service jobs added in April. ADP showed 850,000 service jobs added.
• Unemployment Claims: The weekly claims report showed a sharp decline in the number of initial unemployment claims during the reference week (include the 12th of the month) from 566,000 in April to 444,000 in May. This would usually suggest a pickup in hiring, although this might not be very useful right now. In general, weekly claims have been lower than expectations.
 • Permanent Job Losers: Something to watch in the employment report will be "Permanent job losers". While there has been a strong bounce back in total employment, from the shutdown in March and April 2020, permanent job losers had been flat over the last several months.
This graph shows permanent job losers as a percent of the pre-recession peak in employment through the April report.
This data is only available back to 1994, so there is only data for three recessions. In April, the number of permanent job losers increased slightly to 3.529 million from 3.432 million in March.
• Conclusion: The ISM surveys suggest a weaker than expected jobs report, but the ADP report and unemployment claims suggest a stronger than expected report.
As far as the pandemic, the number of daily cases during the reference week in May was around 35,000, down sharply from around 67,000 in April. And vaccinations continue to increase. These are strong positives for the job market.
So my guess is the report will be above the consensus.
May Vehicles Sales decreased to 16.99 Million SAAR
by Calculated Risk on 6/03/2021 10:11:00 AM
The BEA released their estimate of light vehicle sales for May this morning. The BEA estimates sales of 16.99 million SAAR in May 2021 (Seasonally Adjusted Annual Rate), down 9.5% from the April sales rate, and up 40% from May 2020.
This was below the consensus estimate of 18.0 million SAAR.
 Click on graph for larger image.
This graph shows light vehicle sales since 2006 from the BEA (blue) and the BEA's estimate for May (red).
The impact of COVID-19 was significant, and April 2020 was the worst month.
Since April 2020, sales have increased, and are now close to sales in 2019 (the year before the pandemic).
Sales-to-date are up 1.5% compared to the same period in 2019.
The second graph shows light vehicle sales since the BEA started keeping data in 1967.
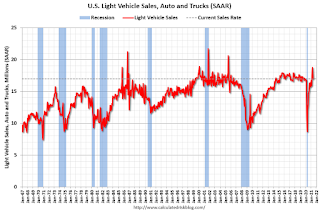 Note: dashed line is current estimated sales rate of 16.99 million SAAR.
The second graph shows light vehicle sales since the BEA started keeping data in 1967.
 Note: dashed line is current estimated sales rate of 16.99 million SAAR.
Sales in May were likely impacted by supply issues.
ISM® Services Index Increased to Record High 64.0% in May
by Calculated Risk on 6/03/2021 09:51:00 AM
(Posted with permission). The May ISM® Services index was at 64.0%, up from 62.7% last month. The employment index decreased to 55.3%, from 58.8%. Note: Above 50 indicates expansion, below 50 contraction.
From the Institute for Supply Management: May 2021 Services ISM® Report On Business®
Economic activity in the services sector grew in May for the 12th month in a row, say the nation’s purchasing and supply executives in the latest Services ISM® Report On Business®.The employment index decreased to 55.3% from 58.8% in April.
The report was issued today by Anthony Nieves, CPSM, C.P.M., A.P.P., CFPM, Chair of the Institute for Supply Management® (ISM®) Services Business Survey Committee: “The Services PMI® reached another all-time high in May, registering 64 percent, which is 1.3 percentage points higher than April’s reading of 62.7 percent. The previous record high was 63.7 percent in March. The May reading indicates the 12th straight month of growth for the services sector, which has expanded for all but two of the last 136 months.
“The Supplier Deliveries Index registered 70.4 percent, up 4.3 percentage points from April’s reading of 66.1 percent. (Supplier Deliveries is the only ISM® Report On Business® index that is inversed; a reading of above 50 percent indicates slower deliveries, which is typical as the economy improves and customer demand increases.) The Prices Index registered 80.6 percent, which is 3.8 percentage points higher than the April reading of 76.8 percent, indicating that prices increased in May, and at a faster rate. The last time the Prices Index was this elevated was when it registered 77.4 percent in July 2008; the all-time high is 83.5 percent in September 2005.
“According to the Services PMI®, all 18 services industries reported growth. The composite index indicated growth for the 12th consecutive month after a two-month contraction in April and May 2020. There was continued growth in the services sector in May. The rate of expansion is very strong, as businesses have reopened and production capacity has increased. However, some capacity constraints, material shortages, weather-related delays, and challenges in logistics and employment resources continue,” says Nieves.
emphasis added


