 RSS Feed
 by Calculated Risk on 6/22/2021 09:08:00 PM
Tuesday, June 22, 2021
Wednesday: New Home Sales
Wednesday:
• At 7:00 AM ET, The Mortgage Bankers Association (MBA) will release the results for the mortgage purchase applications index.
• At 10:00 AM, New Home Sales for May from the Census Bureau. The consensus is for 880 thousand SAAR, up from 863 thousand in April.
• During the day, The AIA's Architecture Billings Index for May (a leading indicator for commercial real estate).
June 22nd COVID-19 New Cases, Vaccinations, Hospitalizations
by Calculated Risk on 6/22/2021 07:02:00 PM
This data is from the CDC.
According to the CDC, on Vaccinations.
Total doses administered: 319,223,844, as of yesterday 318,576,441. Daily change: 0.65 million.
| COVID Metrics | ||||
|---|---|---|---|---|
| Today | Yesterday | Week Ago | Goal | |
| Percent over 18, One Dose | 65.5% | 65.4% | 64.6% | ≥70.0%1,2 |
| Fully Vaccinated (millions) | 150.4 | 150.0 | 145.8 | ≥1601 |
| New Cases per Day3,4 | 11,215 | 11,283 | 12,581 | ≤5,0002 |
| Hospitalized3 | 12,633 | 12,179 | 14,232 | ≤3,0002 |
| Deaths per Day3,4 | 300 | 273 | 310 | ≤502 |
| 1 America's Goal by July 4th, 2my goals to stop daily posts, 37 day average for Cases, Hospitalized, and Deaths 4Cases and Deaths updated Mon - Fri | ||||
KUDOS to the residents of the 16 states and D.C. that have already achieved the 70% goal: Vermont, Hawaii and Massachusetts are at 80%+, and Connecticut, New Jersey, Maine, Rhode Island, Pennsylvania, New Mexico, California, New Hampshire, Maryland, Washington, New York, Illinois, Virginia and D.C. are all over 70%.
Next up are Minnesota at 69.3%, Delaware at 69.1%, Colorado at 68.8%, Oregon at 68.8%, Wisconsin at 64.7%, Nebraska at 63.7%, and South Dakota at 63.6%.
 Click on graph for larger image.
This graph shows the daily (columns) and 7 day average (line) of positive tests reported.
This data is from the CDC.
MBA Survey: "Share of Mortgage Loans in Forbearance Decreases to 3.93%"
by Calculated Risk on 6/22/2021 04:00:00 PM
Note: This is as of June 13th.
From the MBA: Share of Mortgage Loans in Forbearance Decreases to 3.93%
The Mortgage Bankers Association’s (MBA) latest Forbearance and Call Volume Survey revealed that the total number of loans now in forbearance decreased by 11 basis points from 4.04% of servicers’ portfolio volume in the prior week to 3.93% as of June 13, 2021. According to MBA’s estimate, 2 million homeowners are in forbearance plans.
The share of Fannie Mae and Freddie Mac loans in forbearance decreased 4 basis points to 2.05%. Ginnie Mae loans in forbearance decreased 7 basis points to 5.15%, while the forbearance share for portfolio loans and private-label securities (PLS) decreased 35 basis points to 7.98%. The percentage of loans in forbearance for independent mortgage bank (IMB) servicers decreased 16 basis points to 4.05%, and the percentage of loans in forbearance for depository servicers declined 3 basis points to 4.16%.
“The share of loans in forbearance declined for the 16th straight week, with declines across almost every loan category,” said Mike Fratantoni, MBA’s Senior Vice President and Chief Economist. “New forbearance requests, at 4 basis points, remained at an extremely low level. More than 44 percent of borrowers who exited this week used a deferral plan, highlighting the importance of this option.”
Added Fratantoni, “As more homeowners reach the end of their forbearance term, we should continue to see the share in forbearance decline. The improving job market and strong housing market are providing support for those who do exit.”
emphasis added
 Click on graph for larger image.
This graph shows the percent of portfolio in forbearance by investor type over time. Most of the increase was in late March and early April 2020, and has trended down since then.
The MBA notes: "Total weekly forbearance requests as a percent of servicing portfolio volume (#) remained the same relative to the prior week at 0.04%."
Note: These deferral plans are very popular. Basically when the homeowner exits forbearance, they just go back to making their regular monthly payments, they are not charged interest on the missed payments, and the unpaid balanced is deferred until the end of the mortgage.
DOT: Vehicle Miles Driven Increased Sharply year-over-year in April
by Calculated Risk on 6/22/2021 01:00:00 PM
This will be something to watch as the economy recovers.
The Department of Transportation (DOT) reported:
Travel on all roads and streets changed by 54.6% (90.6 billion vehicle miles) for April 2021 as compared with April 2020. Travel for the month is estimated to be 256.5 billion vehicle miles.
The seasonally adjusted vehicle miles traveled for April 2021 is 248.6 billion miles, a 56.5% (89.7 billion vehicle miles) increase over April 2020. It also represents -4.7% decline (-12.3 billion vehicle miles) compared with March 2021.
Cumulative Travel for 2021 changed by ( billion vehicle miles). The cumulative estimate for the year is 947.5 billion vehicle miles of travel.
emphasis added
 Click on graph for larger image.
This graph shows the monthly total vehicle miles driven, seasonally adjusted.
Miles driven declined sharply in March 2020, and really collapsed in April 2020. After partially recovering fairly quickly, miles driven was mostly flat for 6+ months - but picked up in March, but fell back in April.
Comments on May Existing Home Sales
by Calculated Risk on 6/22/2021 10:34:00 AM
Earlier: NAR: Existing-Home Sales Decreased to 5.80 million in May
A few key points:
1) Existing home sales are getting close to pre-pandemic levels. Although seasonally adjusted (SA) sales for May were the highest since 2006, sales Not Seasonally Adjusted (NSA) in May 2021 were below the sales for May in 2017, 2018 and 2019.
Some of the increase over the previous ten months was probably related to record low mortgage rates, a move away from multi-family rentals, strong second home buying (to escape the high-density cities), a strong stock market and favorable demographics.
2) Inventory is very low, and was down 20.6% year-over-year (YoY) in May. Also, as housing economist Tom Lawler has noted, the local MLS data shows even a larger decline in active inventory (the NAR appears to include some pending sales in inventory). Lawler noted:
Months-of-supply at 2.5 months is still very low, but above the record low of 1.9 months set in December 2020 and January 2021. Inventory will be important to watch in 2021, see: Some thoughts on Housing Inventory
Also, the delay in the 2020 buying season pushed the seasonally adjusted number to very high levels over the winter. This means there are going to be some difficult comparisons in the second half of 2021!
2) Inventory is very low, and was down 20.6% year-over-year (YoY) in May. Also, as housing economist Tom Lawler has noted, the local MLS data shows even a larger decline in active inventory (the NAR appears to include some pending sales in inventory). Lawler noted:
"As I’ve noted before, the inventory measure in most publicly-released local realtor/MLS reports excludes listings with pending contracts, but that is not the case for many of the reports sent to the NAR (referred to as the “NAR Report!”), Since the middle of last Spring inventory measures excluding pending listings have fallen much more sharply than inventory measures including such listings, and this latter inventory measure understates the decline in the effective inventory of homes for sale over the last several months."
It seems likely that active inventory is down close to 50% year-over-year.
3) As usual, housing economist Tom Lawler's forecast was closer to the NAR report than the Consensus. The NAR reported 5.80 million SAAR, Lawler estimated the NAR would report 5.78 million SAAR, and the consensus was 5.72 million SAAR.
 Click on graph for larger image.
This graph shows existing home sales by month for 2020 and 2021.
The year-over-year comparison will be easy in June, and then difficult in the second half of the year.
The second graph shows existing home sales for each month, Not Seasonally Adjusted (NSA), since 2005.
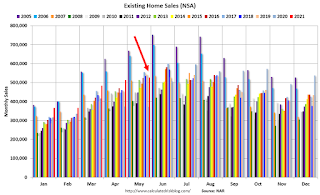 Sales NSA in May (528,000) were 41.9% above sales in May 2020 (372,000).
Although sales were up sharply from May 2020, this was below the sales NSA for May in 2017, 2018 and 2019.
NAR: Existing-Home Sales Decreased to 5.80 million in May
by Calculated Risk on 6/22/2021 10:12:00 AM
From the NAR: Existing-Home Sales Experience Slight Skid of 0.9% in May
Existing-home sales decreased for a fourth straight month in May, according to the National Association of Realtors®. Only one major U.S. region recorded a month-over-month increase, while the other three regions saw sales decline. However, each of the four areas again registered double-digit year-over-year gains.
Total existing-home sales, completed transactions that include single-family homes, townhomes, condominiums and co-ops, dropped 0.9% from April to a seasonally-adjusted annual rate of 5.80 million in May. Sales in total climbed year-over-year, up 44.6% from a year ago (4.01 million in May 2020).
...
Total housing inventory at the end of May amounted to 1.23 million units, up 7.0% from April's inventory and down 20.6% from one year ago (1.55 million). Unsold inventory sits at a 2.5-month supply at the present sales pace, marginally up from April's 2.4-month supply but down from 4.6-months in May 2020.
emphasis added
 Click on graph for larger image.
This graph shows existing home sales, on a Seasonally Adjusted Annual Rate (SAAR) basis since 1993.
Sales in May (5.80 million SAAR) were down 0.9% from last month, and were 44.6% above the May 2020 sales rate.
The second graph shows nationwide inventory for existing homes.
 According to the NAR, inventory increased to 1.23 million in May from 1.15 million in April. Headline inventory is not seasonally adjusted, and inventory usually decreases to the seasonal lows in December and January, and peaks in mid-to-late summer.
The last graph shows the year-over-year (YoY) change in reported existing home inventory and months-of-supply. Since inventory is not seasonally adjusted, it really helps to look at the YoY change. Note: Months-of-supply is based on the seasonally adjusted sales and not seasonally adjusted inventory.
 Inventory was down 20.6% year-over-year in May compared to May 2020.
 Months of supply increased to 2.5 months in May from 2.4 months in April.
This was slightly above the consensus forecast. I'll have more later.
Monday, June 21, 2021
Tuesday: Existing Home Sales, Richmond Fed Mfg, Fed Chair Powell
by Calculated Risk on 6/21/2021 09:00:00 PM
From Matthew Graham at Mortgage News Daily: No Easy Victories For Mortgage Rates
10yr yields may have hit their lowest levels in months in the wee hours of the morning and people may always perceive a bit too much correlation between 10yr yields and mortgage rates, but the latter didn't have quite the same success. To be fair, Treasuries ended up losing ground as the day progressed, but even so, they are nearer to their recent lows than mortgage rates. [30 year fixed 3.25%]Tuesday:
emphasis added
• At 10:00 AM ET, Existing Home Sales for May from the National Association of Realtors (NAR). The consensus is for 5.72 million SAAR, down from 5.85 million.
Housing economist Tom Lawler expects the NAR to report sales of 5.78 million SAAR for May.
• Also at 10:00 AM, Richmond Fed Survey of Manufacturing Activity for June.
• At 2:00 PM, Testimony, Fed Chair Jerome Powell, The Federal Reserve's Response to the Coronavirus Pandemic, Before the Select Subcommittee on Coronavirus Crisis, U.S. House of Representatives
June 21st COVID-19 New Cases, Vaccinations, Hospitalizations
by Calculated Risk on 6/21/2021 07:24:00 PM
This data is from the CDC.
According to the CDC, on Vaccinations.
Total doses administered: 318,576,441, as of yesterday 317,966,408. Daily change: 0.61 million.
| COVID Metrics | ||||
|---|---|---|---|---|
| Today | Yesterday | Week Ago | Goal | |
| Percent over 18, One Dose | 65.4% | 65.4% | 64.5% | ≥70.0%1,2 |
| Fully Vaccinated (millions) | 150.0 | 149.7 | 144.9 | ≥1601 |
| New Cases per Day3,4 | 10,351 | 10,067 | 12,581 | ≤5,0002 |
| Hospitalized3 | 12,179 | 12,879 | 13,944 | ≤3,0002 |
| Deaths per Day3,4 | 273 | 222 | 310 | ≤502 |
| 1 America's Goal by July 4th, 2my goals to stop daily posts, 37 day average for Cases, Hospitalized, and Deaths 4Cases and Deaths updated Mon - Fri | ||||
KUDOS to the residents of the 16 states and D.C. that have already achieved the 70% goal: Vermont, Hawaii and Massachusetts are at 80%+, and Connecticut, New Jersey, Maine, Rhode Island, Pennsylvania, New Mexico, California, New Hampshire, Maryland, Washington, New York, Illinois, Virginia and D.C. are all over 70%.
Next up are Minnesota at 69.2%, Delaware at 69.1%, Colorado at 68.8%, Oregon at 68.7%, Wisconsin at 64.7%, Nebraska at 63.4%, and South Dakota at 63.4%.
 Click on graph for larger image.
This graph shows the daily (columns) and 7 day average (line) of positive tests reported.
This data is from the CDC.
Housing: A Somewhat Similar Period
by Calculated Risk on 6/21/2021 12:48:00 PM
A period that is somewhat similar to the current housing market was in the late 1970s.
House prices increased 14.7% in 1977, 15.7% in 1978 and 13.9% in 1979 (Case-Shiller National Index).
Over the last 12 months, house prices have increased 13.2%.
And currently demographics are favorable for home buying with a large cohort moving into their 30s, just like in the late 70s, with the leading-edge boomers turning 31 in 1977.
But there are stark differences too.
First, inflation was very high in the late '70s, averaging close to 9% over those 3 years. Inflation over the last year was up 5.0%, but that was mostly over the last few months - and is likely transitory (inflation was embedded in the late '70s).
Another major difference is housing inventories are much lower today (a key reason why house prices have jumped). There are a number of reasons for the low levels of inventory, including investor buying houses and condos following the GFC (mostly in the 2010 to 2015 period), and houses taken off the market due to the pandemic. Both the pandemic and strong investor buying following the financial crisis are unique to the current housing market.
The '70s house price boom stopped in the early '80s, as the economy went into recession twice with the unemployment rate peaking at 10.8% in 1982 (higher than the peak following the financial crisis). This was directly related to the Volcker Fed raising rates to fight inflation.
House prices declined regionally in the early '80s, but just flattened out nationally. In real terms, national house prices fell about 10% over a three-year period in the early '80s - and didn't regain the earlier peak for almost 7 years.
Currently there is no recession on the horizon to slow house price gains, and it is unlikely the Fed will tighten aggressively any time soon.
Although there are some similarities to the late '70s, there are also obvious differences.
My guess is the key will be inventory. As long as inventory stays low, house prices will continue to increase rapidly. If inventories increase, house price gains will slow.
Housing Inventory June 21st Update: Inventory Increased Week-over-week
by Calculated Risk on 6/21/2021 10:57:00 AM
One of the key questions for 2021 is: Will inventory increase as the pandemic subsides, or will inventory decrease further in 2021?
Tracking inventory will be very important this year.
 Click on graph for larger image in graph gallery.
This inventory graph is courtesy of Altos Research.
As of June 18th, inventory was at 353 thousand (7 day average), compared to 690 thousand the same week a year ago. That is a decline of 48.8%.
A week ago, inventory was at 342 thousand, and was down 51.0% YoY.
Seasonally, inventory has bottomed. Inventory was about 15.3% above the low in early April.
Mike Simonsen discusses this data regularly on Youtube.


