by Calculated Risk on 7/09/2021 11:46:00 AM
Friday, July 09, 2021
AAR: June Rail Carloads down, Intermodal Up Compared to 2019
From the Association of American Railroads (AAR) Rail Time Indicators. Graphs and excerpts reprinted with permission.
U.S. rail volumes in June 2021 and Q2 2021 were consistent with an economy that’s growing but has more growing to do. Total U.S. carloads in June 2021 and Q2 2021 were up 19.1% and 23.8%, respectively, over the same periods in 2020 as easy comps led to big year-over-year percentage gains. That said, total carloads in Q2 2021 were the most for any quarter since Q4 2019.
...
On the intermodal side, U.S. originations in Q2 2021 were the most ever for a quarter, and intermodal volume in the first six months of 2021 were the most ever for the first six months of a year.
emphasis added
 Click on graph for larger image.
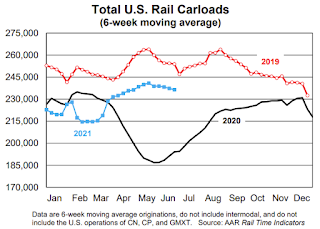
This graph from the Rail Time Indicators report shows the six week average of U.S. Carloads in 2019, 2020 and 2021:
Total originated carloads were 1.18 million in June 2021, up 19.1% (188,164 carloads) over June 2020 and down 5.5% from June 2019.
...
Carloads excluding coal were up 14.1% in June 2021 over June 2020 and down 4.3% from June 2019.
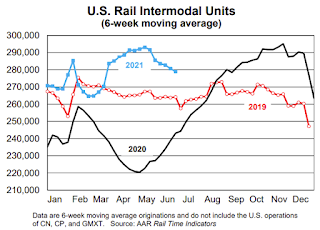
 The second graph shows the six week average of U.S. intermodal in 2019, 2020 and 2021: (using intermodal or shipping containers):
U.S. intermodal originations, which are not included in carloads, rose 10.9% in June 2021 over June 2020, their 11th straight year-over-year gain. In June, intermodal averaged 277,349 containers and trailers per week, the second most for June on record (behind June 2018).
Hotels: Occupancy Rate Down Slightly Compared to Same Week in 2019
by Calculated Risk on 7/09/2021 10:01:00 AM
Note: The year-over-year occupancy comparisons are easy, since occupancy declined sharply at the onset of the pandemic. So STR is comparing to the same week in 2019.
The occupancy rate is down 0.1% compared to the same week in 2019 (easy comparison due to the timing of July 4th). Leisure (weekend) occupancy has recovered, but weekday (more business) is still down.
U.S. hotel occupancy dipped while average daily rate (ADR) was up from previous weeks and the comparable period in 2019, according to STR‘s latest data through July 3.The following graph shows the seasonal pattern for the hotel occupancy rate using the four week average.
June 27 through July 3, 2021 (percentage change from comparable week in 2019*):
• Occupancy: 65.4% (-0.1%)
• Average daily rate (ADR): US$135.35 (+5.8%)
• Revenue per available room (RevPAR): US$88.51 (+5.7%)
While occupancy was down because of the holiday week, overall comparisons were more favorable because of low performance during the corresponding week from 2019. That week in 2019 was lower due to the 4th of July falling on a Thursday.
emphasis added
 Click on graph for larger image.
The red line is for 2021, black is 2020, blue is the median, dashed purple is 2019, and dashed light blue is for 2009 (the worst year on record for hotels prior to 2020).
Note: Y-axis doesn't start at zero to better show the seasonal change.
Black Knight: Number of Homeowners in COVID-19-Related Forbearance Plans Decreased Sharply
by Calculated Risk on 7/09/2021 08:06:00 AM
Note: Both Black Knight and the MBA (Mortgage Bankers Association) are putting out weekly estimates of mortgages in forbearance.
This data is as of July 6th.
From Andy Walden at Black Knight: Significant Improvement in Active Forbearances
In our last post, we mentioned that last week’s minor reduction in forbearance plans had “set us up nicely for what could be a larger improvement next week as some 218,000 plans were still scheduled for review by Wednesday, June 30.”
Well, that larger improvement arrived this week.
Since last Tuesday, the overall number of active plans has dropped by 189,000, pushing the population of homeowners in forbearance down below 2 million for the first time early in April of last year.
The decline, as mentioned above, was driven by the large volume of early entrants reaching their 15-month quarterly review, and significant declines were seen across all investor classes.
Click on graph for larger image.
Loans held in bank portfolios and private label securities led the way with a 78,000 reduction in plans, while FHA/VA and GSE forbearance volumes dropped by 67,000 and 44,000 respectively.
All in all, that puts us down 254,000 (-12%) from the same time last month.
Nearly two thirds of the more than 325,000 plans reviewed for extension or removal over the prior week resulted in exits. That’s the highest weekly exit rate in more than six months and the highest weekly removal volume since the first wave of plans went through their 12-month reviews a few months ago.
Forbearance plan starts also continue to fall, with both new and repeat starts down this week for a total of fewer than 26,000, a new pandemic-era low.
As of July 6, 1.86 million (3.5% of) homeowners remain in COVID-19 related forbearance plans including 2.2% of GSE, 6.8% of FHA/VA and 4.6% of Portfolio/PLS loans. Another 400,000 plans are scheduled to be reviewed for extension/removal over the next 30 days.
emphasis added
Thursday, July 08, 2021
North Texas Real Estate in June: Sales Down Slightly YoY, Inventory Down 50% YoY
by Calculated Risk on 7/08/2021 05:52:00 PM
Note: Remember, sales were weak in April and May last year. I'm posting data for many local markets around the U.S. The story is the same everywhere ... inventory is very low.
From the NTREIS for North Texas (including Dallas/Ft. Worth):
Single Family Homes sold in June 2021 were 11,554, down 2.9% from 11,896 in June 2020.
Combined, sales were down slightly year-over-year.
Single Family Active Listings in June 2021 were 8,603, down 50.0% from 17,222 in June 2020.
Combined, active listings declined 49.8% year-over-year.
Although down sharply year-over-year, active inventory was up 19.9% compared to last month.
July 8th COVID-19 New Cases, Vaccinations, Hospitalizations
by Calculated Risk on 7/08/2021 04:32:00 PM
According to the CDC, on Vaccinations.
Total doses administered: 332,345,797, as of a week ago 328,152,304. Average doses last week: 0.60 million per day.
| COVID Metrics | ||||
|---|---|---|---|---|
| Today | Yesterday | Week Ago | Goal | |
| Percent over 18, One Dose | 67.3% | 67.2% | 66.7% | ≥70.0%1,2 |
| Fully Vaccinated (millions) | 158.3 | 157.9 | 155.9 | ≥1601 |
| New Cases per Day3🚩 | 14,884 | 14,341 | 12,832 | ≤5,0002 |
| Hospitalized3🚩 | 12,419 | 11,418 | 11,948 | ≤3,0002 |
| Deaths per Day3 | 153 | 127 | 205 | ≤502 |
| 1 America's Short Term Goals, 2my goals to stop daily posts, 37 day average for Cases, Hospitalized, and Deaths 🚩 Increasing week-over-week for Cases, Hospitalized, and Deaths | ||||
KUDOS to the residents of the 20 states and D.C. that have already achieved the 70% goal: Vermont, Hawaii and Massachusetts are at 80%+, and Connecticut, Maine, New Jersey, Rhode Island, Pennsylvania, New Mexico, Maryland, California, Washington, New Hampshire, New York, Illinois, Virginia, Delaware, Minnesota, Colorado, Oregon and D.C. are all over 70%.
Next up are Wisconsin at 65.8%, Nebraska at 65.6%, Florida at 65.3%, Utah at 64.8%, South Dakota at 64.5%, and Iowa at 64.1%.
 Click on graph for larger image.
This graph shows the daily (columns) and 7 day average (line) of positive tests reported.
This data is from the CDC.
New Hampshire Real Estate in June: Sales Up 6% YoY, Inventory Down 31% YoY
by Calculated Risk on 7/08/2021 03:46:00 PM
Note: Remember sales were weak in April and May 2020 due to the pandemic. I'm tracking data for many local markets around the U.S. I think it is especially important to watch inventory this year.
From the New Hampshire Realtors for the entire state:
Inventory in June was up 27.9% from last month.
NMHC: Rent Payment Tracker Shows Households Paying Rent Decreased Slightly YoY in Early July
by Calculated Risk on 7/08/2021 12:52:00 PM
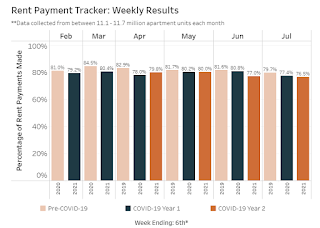
The National Multifamily Housing Council (NMHC)’s Rent Payment Tracker found 76.5 percent of apartment households made a full or partial rent payment by July 6 in its survey of 11.7 million units of professionally managed apartment units across the country.
This is a 0.9 percentage point decrease from the share who paid rent through July 6, 2020 and compares to 79.7 percent that had been paid by July 6, 2019. This data encompasses a wide variety of market-rate rental properties across the United States, which can vary by size, type and average rental price.
emphasis added
 Click on graph for larger image.
This graph from the NMHC Rent Payment Tracker shows the percent of household making full or partial rent payments by the 6th of the month compared to 2019 and to the first COVID year.
This is mostly for large, professionally managed properties.
The second graph shows full month payments through June compared to the same month the prior year.

Leading Index for Commercial Real Estate "Loses Steam In June"
by Calculated Risk on 7/08/2021 11:24:00 AM
From Dodge Data Analytics: Dodge Momentum Index Loses Steam In June
Following six months of consecutive gains, the Dodge Momentum Index fell to 165.8 (2000=100) in June, down 5% from the revised May reading of 175.1. The Momentum Index, issued by Dodge Data & Analytics, is a monthly measure of the first (or initial) report for nonresidential building projects in planning, which have been shown to lead construction spending for nonresidential buildings by a full year.
The decline in June was the result of losses in both institutional planning, which fell 7%, and commercial planning, which lost 4%.
Uncertain demand for some building types (such as retail and hotels), higher material prices, and continued labor shortages are weighing down new project planning. Even with June’s decline, however, the Momentum Index remains near a 13-year high and well above last year. Compared to a year earlier, both commercial and institutional planning were significantly higher than in June 2020 (39% and 46% respectively). Overall, the Momentum Index was 41% higher.
emphasis added
 Click on graph for larger image.
This graph shows the Dodge Momentum Index since 2002. The index was at 165.8 in June, down from 175.1 in May.
According to Dodge, this index leads "construction spending for nonresidential buildings by a full year". This index suggests a decline in Commercial Real Estate construction through most of 2021, but a pickup towards the end of the year, and growth in 2022 (even with the decline in the June index).
Weekly Initial Unemployment Claims increase to 373,000
by Calculated Risk on 7/08/2021 08:35:00 AM
The DOL reported:
In the week ending July 3, the advance figure for seasonally adjusted initial claims was 373,000, an increase of 2,000 from the previous week's revised level. The previous week's level was revised up by 7,000 from 364,000 to 371,000. The 4-week moving average was 394,500, a decrease of 250 from the previous week's revised average. This is the lowest level for this average since March 14, 2020 when it was 225,500. The previous week's average was revised up by 2,000 from 392,750 to 394,750This does not include the 99,001 initial claims for Pandemic Unemployment Assistance (PUA) that was down from 114,186 the previous week.
emphasis added
The following graph shows the 4-week moving average of weekly claims since 1971.
 Click on graph for larger image.
The dashed line on the graph is the current 4-week average. The four-week average of weekly unemployment claims increased to 392,750.
The previous week was revised up.
Regular state continued claims decreased to 3,339,000 (SA) from 3,484,000 (SA) the previous week.
Note: There are an additional 5,824,831 receiving Pandemic Unemployment Assistance (PUA) that decreased from 5,935,630 the previous week (there are questions about these numbers). This is a special program for business owners, self-employed, independent contractors or gig workers not receiving other unemployment insurance. And an additional 4,908,107 receiving Pandemic Emergency Unemployment Compensation (PEUC) down from 5,261,991.
Weekly claims were higher than the consensus forecast.
Wednesday, July 07, 2021
Northwest Real Estate in June: Sales up 31% YoY, Inventory down 34% YoY
by Calculated Risk on 7/07/2021 05:27:00 PM
The Northwest Multiple Listing Service reported Market offers hope for homebuyers, but Northwest MLS brokers say it may be temporary
Homebuyers may find some good news in the latest report from Northwest Multiple Listing Service (NWMLS). The number of active listings at the end of June, 6,358, reached the highest level since November when buyers could choose from 6,505 properties. The volume of new listings added last month was the highest number in 17 months (13,111 last month versus 14,689 at the end of November 2019).The press release is for the Northwest MLS area. There were 10,923 closed sales in June 2021, up 31.4% from 8,312 sales in June 2020. Active inventory for the Northwest is down 34.3%.
"Homebuyers will be happy to hear that between May and June the number of listings in King, Pierce, and Snohomish counties rose, giving them more homes to choose from and possibly easing the pressure just a little," remarked Matthew Gardner, chief economist at Windermere Real Estate.
For the tri-county area, total active listings of single family homes and condominiums increased 14.5% from May. System-wide, the report covering all 26 counties served by Northwest MLS shows month-to-month inventory improved 14.9%.
...
The latest report from Northwest MLS shows a year-over-year (YOY) drop in active listings of more than 34%, with only about two weeks (0.58 months) of supply available areawide. Last month marked the first time since July 2020 that the year-over-year decline fell below 40%.
...
Brokers reported 10,923 completed transactions during June, a 31.4% increase from twelve months ago, and up 16.5% from May's total of 9,374. Prices on last month's sales, which includes single family homes and condominiums, rose nearly 27% from a year ago, from $465,000 to $589,000.
emphasis added
In King County, sales were up 45.6% year-over-year, and active inventory was down 35.0% year-over-year.
In Seattle, sales were up 58.3% year-over-year, and inventory was down 14.9% year-over-year. (inventory in Seattle was extremely low before the pandemic). This puts the months-of-supply in Seattle at just 0.86 months.


