by Calculated Risk on 7/12/2021 10:16:00 AM
Monday, July 12, 2021
Black Knight Mortgage Monitor for May; Highest Annual Home Price Increase on Record
Black Knight released their Mortgage Monitor report for May today. According to Black Knight, 4.73% of mortgage were delinquent in May, up from 4.66% of mortgages in April, and down from 7.76% in May 2020. Black Knight also reported that 0.28% of mortgages were in the foreclosure process, down from 0.38% a year ago.
This gives a total of 5.01% delinquent or in foreclosure.
Press Release: Black Knight: Home Prices Surge Nearly 18% Annually as May Sees Greatest Single-Month Acceleration on Record; eMBS Securities Issuance Data Suggests Borrower Behavior Changing in Response
Today, the Data & Analytics division of Black Knight, Inc. released its latest Mortgage Monitor Report, based upon the company’s industry-leading mortgage, real estate and public records datasets. This month’s report looks at the continued, unprecedented levels of home price growth, and the impact that growth is having on mortgage lending and borrower behavior. According to Black Knight Data & Analytics President Ben Graboske, home price appreciation continues to break records, with ramifications that stretch across the real estate and mortgage markets.
“The Black Knight HPI shows home prices in May up nearly 18% from the same time last year,” said Graboske. “Frankly, home values are appreciating at rates we’ve simply never seen before, as low interest rates, ultra-scarce inventory and increasingly competitive homebuyers combine to create a truly unprecedented market.
“Indeed, the rate of growth has been accelerating by more than 2% in each of the past two months, and May’s 2.1% rise marked the sharpest monthly jump on record. Single-family home prices are up more than 18% from last May – also a record. And the growth has been widespread – home price appreciation accelerated in each of the nation’s 100 largest metros in May, with even the slowest appreciating metro area now seeing at least 10% annual growth. Data from our Collateral Analytics Group suggests even further acceleration may be on tap, as the median sales price of single-family homes in the first three weeks of June was already up 25% year-over-year.
emphasis added
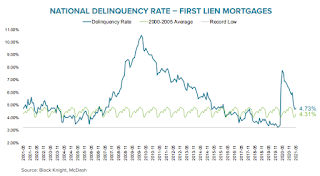 Click on graph for larger image.
Here is a graph on delinquencies from Black Knight:
• May’s mortgage delinquency increase is only the second since the pandemic recovery began last June and – like the first – appears to be calendar related and likely temporary
• It is expected that delinquencies will continue to slowly normalize through the remainder of Q2 and into Q3, though full normalization will likely take longer still
• Early-stage delinquencies (30 or 60 days past due) rose by 110K in May, while the number of seriously delinquent mortgages (90+ days but not yet in foreclosure) improved for the ninth consecutive month
 And on monthly payments (affordability) from Black Knight:
 • Skyrocketing prices are beginning to take a toll on affordability; it now requires $191 (+18%) more in monthly P&I payments to purchase the average priced home than it did at the start of the yearThere is much more in the mortgage monitor.
• Factoring income into the equation, it now requires 21.3% of the median household income to make the monthly payment on the average priced home purchase assuming a 20% down payment
• Even with the average 30-year interest rate hovering at just over 3%, that payment-to-income ratio is up from 18.1% at the beginning of 2021
• In areas like Los Angeles, the ratio has climbed as high as 46.5%, an unsettling number for buyers hoping to make the leap into homeownership
Seven High Frequency Indicators for the Economy
by Calculated Risk on 7/12/2021 08:25:00 AM
These indicators are mostly for travel and entertainment. It will interesting to watch these sectors recover as the pandemic subsides.
The TSA is providing daily travel numbers.
This data is as of July 11th.
 Click on graph for larger image.
This data shows the 7-day average of daily total traveler throughput from the TSA for 2019 (Light Blue), 2020 (Blue) and 2021 (Red).
The dashed line is the percent of 2019 for the seven day average.
The 7-day average is down 20.9% from the same day in 2019 (79.1% of 2019). (Dashed line)
There was a slow increase from the bottom - and TSA data has picked up in 2021.
The second graph shows the 7-day average of the year-over-year change in diners as tabulated by OpenTable for the US and several selected cities.
 Thanks to OpenTable for providing this restaurant data:
This data is updated through July 10th, 2021.
This data is "a sample of restaurants on the OpenTable network across all channels: online reservations, phone reservations, and walk-ins. For year-over-year comparisons by day, we compare to the same day of the week from the same week in the previous year."
Note that this data is for "only the restaurants that have chosen to reopen in a given market". Since some restaurants have not reopened, the actual year-over-year decline is worse than shown.
Dining picked up during the holidays, then slumped with the huge winter surge in cases. Dining is generally picking up, but was down 15% in the US (7-day average compared to 2019). Florida and Texas are above 2019 levels.
 This data shows domestic box office for each week and the median for the years 2016 through 2019 (dashed light blue).
 Note that the data is usually noisy week-to-week and depends on when blockbusters are released.
Movie ticket sales were at $115 million last week, down about 61% from the median for the week.
 This graph shows the seasonal pattern for the hotel occupancy rate using the four week average.
 The red line is for 2021, black is 2020, blue is the median, dashed purple is 2019, and dashed light blue is for 2009 (the worst year on record for hotels prior to 2020).
Occupancy is now above the horrible 2009 levels and weekend occupancy (leisure) has been solid.
This data is through July 3rd. Hotel occupancy is currently down slightly compared to same week in 2019 (a timing issue with July 4th helped)). Note: Occupancy was up year-over-year, since occupancy declined sharply at the onset of the pandemic. However, the 4-week average occupancy is still down from normal levels.
Notes: Y-axis doesn't start at zero to better show the seasonal change.
 This graph, based on weekly data from the U.S. Energy Information Administration (EIA), shows gasoline supplied compared to the same week of 2019.
Blue is for 2020. Red is for 2021.
As of July 2nd, gasoline supplied was up 2.9% compared to the same week in 2019.
This is the second week this year when gasoline supplied was up compared to the same week in 2019.
This graph is from Apple mobility. From Apple: "This data is generated by counting the number of requests made to Apple Maps for directions in select countries/regions, sub-regions, and cities." This is just a general guide - people that regularly commute probably don't ask for directions.
There is also some great data on mobility from the Dallas Fed Mobility and Engagement Index. However the index is set "relative to its weekday-specific average over January–February", and is not seasonally adjusted, so we can't tell if an increase in mobility is due to recovery or just the normal increase in the Spring and Summer.
 This data is through July 9th for the United States and several selected cities.
The graph is the running 7-day average to remove the impact of weekends.
IMPORTANT: All data is relative to January 13, 2020. This data is NOT Seasonally Adjusted. People walk and drive more when the weather is nice, so I'm just using the transit data.
According to the Apple data directions requests, public transit in the 7 day average for the US is at 97% of the January 2020 level and moving up.
Here is some interesting data on New York subway usage (HT BR).
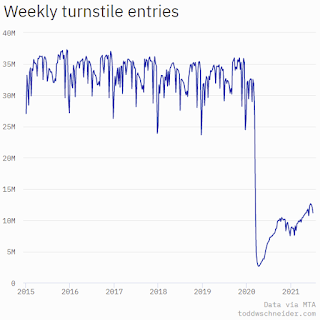 This graph is from Todd W Schneider. This is weekly data since 2015.
 This data is through Friday, July 9th.
Schneider has graphs for each borough, and links to all the data sources.
He notes: "Data updates weekly from the MTA’s public turnstile data, usually on Saturday mornings".
Sunday, July 11, 2021
Sunday Night Futures
by Calculated Risk on 7/11/2021 09:28:00 PM
Weekend:
• Schedule for Week of July 11, 2021
Monday:
• No major economic releases scheduled.
From CNBC: Pre-Market Data and Bloomberg futures S&P 500 and DOW futures are unchanged (fair value).
Oil prices were down over the last week with WTI futures at $74.68 per barrel and Brent at $75.58 per barrel. A year ago, WTI was at $41, and Brent was at $43 - so WTI oil prices are UP about 80% year-over-year (oil prices collapsed at the beginning of the pandemic).
Here is a graph from Gasbuddy.com for nationwide gasoline prices. Nationally prices are at $3.14 per gallon. A year ago prices were at $2.20 per gallon, so gasoline prices are up $0.94 per gallon year-over-year.
July 11th COVID-19 New Cases, Vaccinations, Hospitalizations
by Calculated Risk on 7/11/2021 03:48:00 PM
Congratulations to the residents of Connecticut on joining the 80% club! Well done. Go for 90%!!!
According to the CDC, on Vaccinations.
Total doses administered: 334,151,648, as of a week ago 330,604,253. Average doses last week: 0.59 million per day.
| COVID Metrics | ||||
|---|---|---|---|---|
| Today | Yesterday | Week Ago | Goal | |
| Percent over 18, One Dose | 67.6% | 67.5% | 67.1% | ≥70.0%1,2 |
| Fully Vaccinated (millions) | 159.3 | 159.0 | 157.3 | ≥1601 |
| New Cases per Day3🚩 | 17,736 | 16,209 | 13,624 | ≤5,0002 |
| Hospitalized3🚩 | 13,273 | 13,270 | 11,904 | ≤3,0002 |
| Deaths per Day3 | 183 | 166 | 184 | ≤502 |
| 1 America's Short Term Goals, 2my goals to stop daily posts, 37 day average for Cases, Hospitalized, and Deaths 🚩 Increasing week-over-week for Cases, Hospitalized, and Deaths | ||||
KUDOS to the residents of the 20 states and D.C. that have already achieved the 70% goal: Vermont, Hawaii, Massachusetts and Connecticut are at 80%+, and Maine, New Mexico, New Jersey, Rhode Island, Pennsylvania, California, Maryland, Washington, New Hampshire, New York, Illinois, Virginia, Delaware, Minnesota, Oregon, Colorado and D.C. are all over 70%.
Next up are Wisconsin at 66.0%, Florida at 65.7%, Nebraska at 65.6%, Utah at 65.0%, South Dakota at 64.7%, and Iowa at 64.3%.
 Click on graph for larger image.
This graph shows the daily (columns) and 7 day average (line) of hospitalizations reported.
This data is from the CDC.
Atlanta Real Estate in June: Sales Up 10% YoY, Inventory Down 56% YoY
by Calculated Risk on 7/11/2021 08:11:00 AM
Note: I'm tracking data for many local markets around the U.S. I think it is especially important to watch inventory this year.
From the GAMLS for Atlanta:
Total Residential Units Sold in June 2021 were 10,035, up 7.8% from 9,310 in June 2020.
Active Residential Listings in June 2021 were 7,787, down 55.8% from 17,596 in June 2020. Inventory was up 3.4% from last month.
Months of Supply was 0.88 Months in June 2021, compared to 2.31 Months in June 2020.

This graph from the Georgia MLS shows inventory in Atlanta over the last several years - and the sharp decline in inventory at the start of the pandemic.
Inventory in Atlanta in June was 11.8% above the record low in April 2021.
Saturday, July 10, 2021
July 10th COVID-19 New Cases, Vaccinations, Hospitalizations
by Calculated Risk on 7/10/2021 05:12:00 PM
According to the CDC, on Vaccinations.
Total doses administered: 333,565,404, as of a week ago 329,970,551. Average doses last week: 0.51 million per day.
| COVID Metrics | ||||
|---|---|---|---|---|
| Today | Yesterday | Week Ago | Goal | |
| Percent over 18, One Dose | 67.5% | 67.4% | 67.0% | ≥70.0%1,2 |
| Fully Vaccinated (millions) | 159.0 | 158.3 | 157.0 | ≥1601 |
| New Cases per Day3🚩 | 17,736 | 16,209 | 13,624 | ≤5,0002 |
| Hospitalized3🚩 | 13,270 | 12,703 | 12,125 | ≤3,0002 |
| Deaths per Day3 | 183 | 166 | 184 | ≤502 |
| 1 America's Short Term Goals, 2my goals to stop daily posts, 37 day average for Cases, Hospitalized, and Deaths 🚩 Increasing week-over-week for Cases, Hospitalized, and Deaths | ||||
KUDOS to the residents of the 20 states and D.C. that have already achieved the 70% goal: Vermont, Hawaii and Massachusetts are at 80%+, and Connecticut, Maine, New Mexico, New Jersey, Rhode Island, Pennsylvania, California, Maryland, Washington, New Hampshire, New York, Illinois, Virginia, Delaware, Minnesota, Oregon, Colorado and D.C. are all over 70%.
Next up are Wisconsin at 65.9%, Nebraska at 65.6%, Florida at 65.5%, Utah at 65.0%, South Dakota at 64.7%, and Iowa at 64.3%.
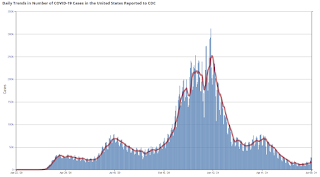 Click on graph for larger image.
This graph shows the daily (columns) and 7 day average (line) of positive tests reported.
The 7-day average cases is the highest since the end of May.
This data is from the CDC.
Schedule for Week of July 11, 2021
by Calculated Risk on 7/10/2021 07:50:00 AM
The key reports this week are June CPI and retail sales.
For manufacturing, the June Industrial Production report and the July New York and Philly Fed manufacturing surveys will be released.
Fed Chair Jerome Powell testifies to Congress on Wednesday and Thursday.
No major economic releases scheduled.
6:00 AM ET: NFIB Small Business Optimism Index for June.
8:30 AM: The Consumer Price Index for June from the BLS. The consensus is for a 0.5% increase in CPI, and a 0.4% increase in core CPI.
7:00 AM ET: The Mortgage Bankers Association (MBA) will release the results for the mortgage purchase applications index.
8:30 AM: The Producer Price Index for June from the BLS. The consensus is for a 0.5% increase in PPI, and a 0.5% increase in core PPI.
12:00 PM: Testimony, Fed Chair Jerome Powell, Semiannual Monetary Policy Report to the Congress, Before the U.S. House Committee on Financial Services
2:00 PM: the Federal Reserve Beige Book, an informal review by the Federal Reserve Banks of current economic conditions in their Districts.
8:30 AM: The initial weekly unemployment claims report will be released. The consensus is for a decrease to 350 thousand from 373 thousand last week.
8:30 AM: The New York Fed Empire State manufacturing survey for July. The consensus is for a reading of 18.7, up from 17.4.
8:30 AM: the Philly Fed manufacturing survey for July. The consensus is for a reading of 28.0, down from 30.7.
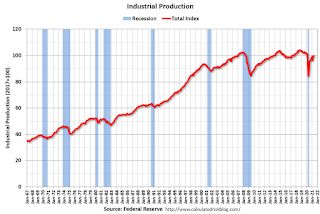 9:15 AM: The Fed will release Industrial Production and Capacity Utilization for June.
This graph shows industrial production since 1967.
The consensus is for a 0.7% increase in Industrial Production, and for Capacity Utilization to increase to 75.6%.
9:30 AM: Testimony, Fed Chair Jerome Powell, Semiannual Monetary Policy Report to the Congress, Before the Committee on Banking, Housing, and Urban Affairs, U.S. Senate
 8:30 AM: Retail sales for June is scheduled to be released. The consensus is for 0.4% decrease in retail sales.
This graph shows retail sales since 1992. This is monthly retail sales and food service, seasonally adjusted (total and ex-gasoline).
Retail sales ex-gasoline were down 1.5% in May.
10:00 AM: University of Michigan's Consumer sentiment index (Preliminary for July).
10:00 AM: State Employment and Unemployment (Monthly) for June 2020
Friday, July 09, 2021
Portland Real Estate in June: Sales Up 28% YoY, Inventory Down 34% YoY
by Calculated Risk on 7/09/2021 04:17:00 PM
Note: Remember sales were weak in April and May 2020 due to the pandemic. I'm tracking data for many local markets around the U.S. I think it is especially important to watch inventory this year.
For Portland, OR:
Closed sales in June 2021 were 3,477, up 28.3% from 2,709 in June 2020.
Active Residential Listings in June 2021 were 2,722, down 33.8% from 4,109 in June 2020.
Inventory in June was up 16.4% from last month.
Months of Supply was 0.8 Months in June 2021, compared to 1.5 Months in June 2020.
July 9th COVID-19 New Cases, Vaccinations, Hospitalizations
by Calculated Risk on 7/09/2021 02:55:00 PM
According to the CDC, on Vaccinations.
Total doses administered: 332,966,409, as of a week ago 328,809,470. Average doses last week: 0.59 million per day.
| COVID Metrics | ||||
|---|---|---|---|---|
| Today | Yesterday | Week Ago | Goal | |
| Percent over 18, One Dose | 67.4% | 67.3% | 66.8% | ≥70.0%1,2 |
| Fully Vaccinated (millions) | 158.6 | 158.3 | 156.3 | ≥1601 |
| New Cases per Day3🚩 | 16,100 | 14,888 | 13,242 | ≤5,0002 |
| Hospitalized3🚩 | 12,703 | 12,419 | 12,015 | ≤3,0002 |
| Deaths per Day3 | 165 | 153 | 195 | ≤502 |
| 1 America's Short Term Goals, 2my goals to stop daily posts, 37 day average for Cases, Hospitalized, and Deaths 🚩 Increasing week-over-week for Cases, Hospitalized, and Deaths | ||||
KUDOS to the residents of the 20 states and D.C. that have already achieved the 70% goal: Vermont, Hawaii and Massachusetts are at 80%+, and Connecticut, Maine, New Mexico, New Jersey, Rhode Island, Pennsylvania, California, Maryland, Washington, New Hampshire, New York, Illinois, Virginia, Delaware, Minnesota, Oregon, Colorado and D.C. are all over 70%.
Next up are Wisconsin at 65.9%, Nebraska at 65.6%, Florida at 65.4%, Utah at 64.9%, South Dakota at 64.6%, and Iowa at 64.2%.
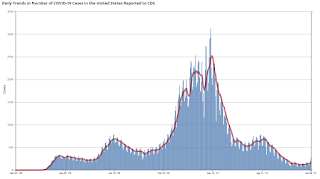 Click on graph for larger image.
This graph shows the daily (columns) and 7 day average (line) of positive tests reported.
The 7-day average cases is the highest since the end of May.
This data is from the CDC.
Q2 GDP Forecasts: Around 9%
by Calculated Risk on 7/09/2021 01:30:00 PM
From BofA:
We continue to track 2Q GDP growth of 9.5% qoq saar. [July 9 estimate]From Goldman Sachs:
emphasis added
We left our Q2 GDP tracking estimate unchanged at +8.5% (qoq ar). [July 9 estimate]From the NY Fed Nowcasting Report
The New York Fed Staff Nowcast stands at 3.2% for 2021:Q2 and 3.8% for 2021:Q3. [July 9 estimate]And from the Altanta Fed: GDPNow
The GDPNow model estimate for real GDP growth (seasonally adjusted annual rate) in the second quarter of 2021 is 7.9 percent on July 9, up from 7.8 percent on July 2. [July 9 estimate]


