by Calculated Risk on 8/01/2021 07:29:00 PM
Sunday, August 01, 2021
Monday: ISM Mfg, Construction Spending
Weekend:
• Schedule for Week of August 1, 2021
• A Few Comments on Inflation
Monday:
• At 10:00 AM ET, ISM Manufacturing Index for July. The consensus is for the ISM to be at 60.9, up from 60.6 in June. The employment index was at 49.9% in June, and the new orders index was at 66.0%.
• Also at 10:00 AM, Construction Spending for June. The consensus is for a 0.4% increase in construction spending.
• At 2:00 PM, Senior Loan Officer Opinion Survey on Bank Lending Practices for July.
From CNBC: Pre-Market Data and Bloomberg futures S&P 500 are up 19 and DOW futures are up 135 (fair value).
Oil prices were up over the last week with WTI futures at $73.85 per barrel and Brent at $75.26 per barrel. A year ago, WTI was at $40, and Brent was at $43 - so WTI oil prices are UP about 80% year-over-year (oil prices collapsed at the beginning of the pandemic).
Here is a graph from Gasbuddy.com for nationwide gasoline prices. Nationally prices are at $3.16 per gallon. A year ago prices were at $2.18 per gallon, so gasoline prices are up $0.98 per gallon year-over-year.
A Few Comments on Inflation
by Calculated Risk on 8/01/2021 04:22:00 PM
I haven't commented much on inflation because I do not consider inflation a serious economic problem.
“Inflation is not going to be transitory,” the chief economic adviser at Allianz SE said in an interview on Bloomberg TV’s The Open show ... “I have a whole list of companies that have announced price increases, that have told us they expect further price increases, and that they expect them to stick,” El-Erian said.First, transitory doesn't mean that price increases won't "stick". It means that year-over-year (YoY) inflation will decline back to the Fed's target of 2%.
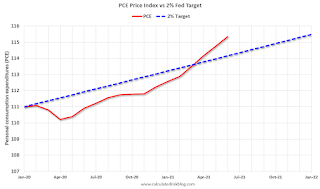
The first graph shows the PCE price index since January 2020 (before the pandemic), and the dashed blue line is the Fed's target of 2%.
 Click on graph for larger image.
As I've mentioned before, there was some deflation at the beginning of the pandemic, and this has increased the YoY change (base effect). There is some transitory inflation from supply chain issues, and surging rents will probably push up Owners Equivalent Rent (OER) over the next year.
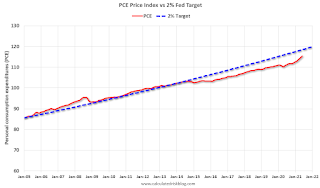 The second graph is from January 2005 (just an arbitrary date).
This shows that inflation has been below target for years. If we were doing price targeting (we aren't) we would be looking for more price increases.
The graphs for core PCE inflation show the same pattern.
The question is not will some prices "stick", but rather will YoY inflation ease back towards the Fed's target? Or will inflation stay at the current 4.0% (PCE YoY in June)?
My sense is inflation will ease back towards the Fed's target.
August 1st COVID-19, New Cases, Hospitalizations, Vaccinations
by Calculated Risk on 8/01/2021 04:16:00 PM
Note: Cases and Deaths not updated on Sundays.
According to the CDC, on Vaccinations.
Total doses administered: 346,456,669, as of a week ago 341,818,968. Average doses last week: 0.66 million per day.
| COVID Metrics | ||||
|---|---|---|---|---|
| Today | Yesterday | Week Ago | Goal | |
| Percent over 18, One Dose | 69.9% | 69.7% | 69.0% | ≥70.0%1,2 |
| Fully Vaccinated✅ (millions) | 164.8 | 164.4 | 163.0 | ≥1601 |
| New Cases per Day3🚩 | 72,493 | 67,556 | 50,333 | ≤5,0002 |
| Hospitalized3🚩 | 35,457 | 34,810 | 25,141 | ≤3,0002 |
| Deaths per Day3🚩 | 308 | 277 | 245 | ≤502 |
| 1 America's Short Term Goals, 2my goals to stop daily posts, 37 day average for Cases, Hospitalized, and Deaths 🚩 Increasing 7 day average week-over-week for Cases, Hospitalized, and Deaths ✅ Goal met (even if late). | ||||
KUDOS to the residents of the 20 states and D.C. that have achieved the 70% goal (percent over 18 with at least one dose): Vermont, Hawaii, Massachusetts and Connecticut are at 80%+, and Maine, New Mexico, New Jersey, Rhode Island, Pennsylvania, California, Maryland, Washington, New Hampshire, New York, Illinois, Virginia, Delaware, Minnesota, Oregon, Colorado and D.C. are all over 70%.
Next up are Florida at 69.0%, Utah at 68.0%, Nebraska at 67.5%, Wisconsin at 67.4%, Kansas at 66.5%, South Dakota at 66.4%, Iowa at 65.7%, and Nevada at 65.7%.
 Click on graph for larger image.
This graph shows the daily (columns) and 7 day average (line) of hospitalizations reported.
Saturday, July 31, 2021
July 31st COVID-19, New Cases, Hospitalizations, Vaccinations; Already 2nd Worst Wave for Cases
by Calculated Risk on 7/31/2021 05:42:00 PM
According to the CDC, on Vaccinations.
Total doses administered: 345,640,466, as of a week ago 341,039,972. Average doses last week: 0.66 million per day.
| COVID Metrics | ||||
|---|---|---|---|---|
| Today | Yesterday | Week Ago | Goal | |
| Percent over 18, One Dose | 69.7% | 69.4% | 68.8% | ≥70.0%1,2 |
| Fully Vaccinated✅ (millions) | 164.4 | 163.9 | 162.7 | ≥1601 |
| New Cases per Day3🚩 | 72,493 | 67,556 | 50,333 | ≤5,0002 |
| Hospitalized3🚩 | 34,769 | 33,084 | 23,822 | ≤3,0002 |
| Deaths per Day3🚩 | 308 | 277 | 245 | ≤502 |
| 1 America's Short Term Goals, 2my goals to stop daily posts, 37 day average for Cases, Hospitalized, and Deaths 🚩 Increasing 7 day average week-over-week for Cases, Hospitalized, and Deaths ✅ Goal met (even if late). | ||||
KUDOS to the residents of the 20 states and D.C. that have achieved the 70% goal (percent over 18 with at least one dose): Vermont, Hawaii, Massachusetts and Connecticut are at 80%+, and Maine, New Mexico, New Jersey, Rhode Island, Pennsylvania, California, Maryland, Washington, New Hampshire, New York, Illinois, Virginia, Delaware, Minnesota, Oregon, Colorado and D.C. are all over 70%.
Next up are Florida at 68.7%, Utah at 68.0%, Wisconsin at 67.3%, Nebraska at 67.3%, South Dakota at 66.3%, Kansas at 66.3%, Iowa at 65.7%, and Nevada at 65.5%.
 Click on graph for larger image.
This graph shows the daily (columns) and 7 day average (line) of positive tests reported.
Schedule for Week of August 1, 2021
by Calculated Risk on 7/31/2021 08:11:00 AM
The key report this week is the July employment report.
Other key reports include ISM manufacturing and services indexes, July vehicle sales, and the Trade deficit for June.
10:00 AM: ISM Manufacturing Index for July. The consensus is for the ISM to be at 60.9, up from 60.6 in June. The employment index was at 49.9% in June, and the new orders index was at 66.0%.
10:00 AM: Construction Spending for June. The consensus is for a 0.4% increase in construction spending.
2:00 PM: Senior Loan Officer Opinion Survey on Bank Lending Practices for July.
8:00 AM ET: Corelogic House Price index for June
 All Day: Light vehicle sales for July from the BEA. The consensus is for light vehicle sales to be 15.7 million SAAR in July, up from 15.4 million in June (Seasonally Adjusted Annual Rate).
This graph shows light vehicle sales since the BEA started keeping data in 1967. The dashed line is the sales rate for last month.
11:00 AM: NY Fed: Q2 Quarterly Report on Household Debt and Credit
7:00 AM ET: The Mortgage Bankers Association (MBA) will release the results for the mortgage purchase applications index.
8:15 AM: The ADP Employment Report for July. This report is for private payrolls only (no government). The consensus is for 675 thousand payroll jobs added in July, down from 692 thousand added in June.
10:00 AM: the ISM Services Index for July. The consensus is for a reading of 60.4, up from 60.1.
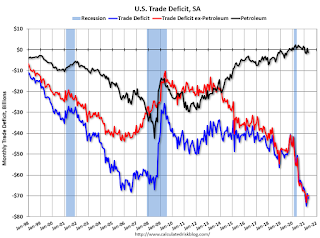 8:30 AM: Trade Balance report for June from the Census Bureau.
 This graph shows the U.S. trade deficit, with and without petroleum, through the most recent report. The blue line is the total deficit, and the black line is the petroleum deficit, and the red line is the trade deficit ex-petroleum products.
The consensus is the trade deficit to be $73.9 billion. The U.S. trade deficit was at $71.2 Billion the previous month.
8:30 AM: The initial weekly unemployment claims report will be released. The consensus is for a decrease to 390 thousand from 400 thousand last week.
 8:30 AM: Employment Report for July. The consensus is for 900,000 jobs added, and for the unemployment rate to decrease to 5.7%.
There were 850,000 jobs added in June, and the unemployment rate was at 5.9%.
This graph shows the job losses from the start of the employment recession, in percentage terms.
The current employment recession was by far the worst recession since WWII in percentage terms, but currently is not as severe as the worst of the "Great Recession".
Friday, July 30, 2021
Fannie Mae: Mortgage Serious Delinquency Rate Decreased in June
by Calculated Risk on 7/30/2021 04:10:00 PM
Fannie Mae reported that the Single-Family Serious Delinquency decreased to 2.08% in June, from 2.24% in May. The serious delinquency rate is down from 2.65% in June 2020.
These are mortgage loans that are "three monthly payments or more past due or in foreclosure".
The Fannie Mae serious delinquency rate peaked in February 2010 at 5.59% following the housing bubble, and peaked at 3.32% in August 2020 during the pandemic.
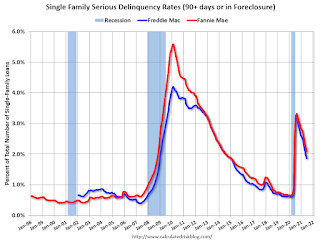
By vintage, for loans made in 2004 or earlier (1% of portfolio), 5.04% are seriously delinquent (down from 5.27% in May). For loans made in 2005 through 2008 (2% of portfolio), 8.75% are seriously delinquent (down from 9.09%), For recent loans, originated in 2009 through 2021 (97% of portfolio), 1.69% are seriously delinquent (down from 1.82%). So Fannie is still working through a few poor performing loans from the bubble years.
Mortgages in forbearance are counted as delinquent in this monthly report, but they will not be reported to the credit bureaus.
This is very different from the increase in delinquencies following the housing bubble. Lending standards have been fairly solid over the last decade, and most of these homeowners have equity in their homes - and they will be able to restructure their loans once they are employed.
Note: Freddie Mac reported earlier.
July 30th COVID-19, New Cases, Hospitalizations, Vaccinations
by Calculated Risk on 7/30/2021 03:36:00 PM
According to the CDC, on Vaccinations.
Total doses administered: 344,928,514, as of a week ago 340,363,922. Average doses last week: 0.65 million per day.
| COVID Metrics | ||||
|---|---|---|---|---|
| Today | Yesterday | Week Ago | Goal | |
| Percent over 18, One Dose | 69.6% | 69.4% | 68.7% | ≥70.0%1,2 |
| Fully Vaccinated✅ (millions) | 164.2 | 163.9 | 162.4 | ≥1601 |
| New Cases per Day3🚩 | 67,080 | 65,476 | 46,828 | ≤5,0002 |
| Hospitalized3🚩 | 32,876 | 31,245 | 22,602 | ≤3,0002 |
| Deaths per Day3🚩 | 275 | 277 | 248 | ≤502 |
| 1 America's Short Term Goals, 2my goals to stop daily posts, 37 day average for Cases, Hospitalized, and Deaths 🚩 Increasing 7 day average week-over-week for Cases, Hospitalized, and Deaths ✅ Goal met (even if late). | ||||
KUDOS to the residents of the 20 states and D.C. that have achieved the 70% goal (percent over 18 with at least one dose): Vermont, Hawaii, Massachusetts and Connecticut are at 80%+, and Maine, New Mexico, New Jersey, Rhode Island, Pennsylvania, California, Maryland, Washington, New Hampshire, New York, Illinois, Virginia, Delaware, Minnesota, Oregon, Colorado and D.C. are all over 70%.
Next up are Florida at 68.5%, Utah at 67.7%, Wisconsin at 67.2%, Nebraska at 67.2%, South Dakota at 66.2%, Kansas at 66.2%, Iowa at 65.6%, and Nevada at 65.4%.
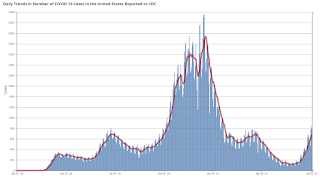 Click on graph for larger image.
This graph shows the daily (columns) and 7 day average (line) of positive tests reported.
Initial Q3 GDP Forecasts: 6% to 9% Range
by Calculated Risk on 7/30/2021 01:28:00 PM
From BofA:
We maintain our 2H forecast but adjust the composition, taking up inventories but taking down consumption (reflecting virus headwinds) and residential investment. (7.0% in Q3 qoq ar and 6.0% in Q4) [July 30 estimate]From Goldman Sachs:
emphasis added
Following today’s data and yesterday’s GDP report, we are launching our Q3 GDP tracking estimate at +9.0% (qoq ar), 0.5pp above our previous forecast, and are also boosting our Q4 forecast by 0.5pp to +5.5%. [July 30 estimate]From the NY Fed Nowcasting Report
The New York Fed Staff Nowcast stands at 4.2% for 2021:Q3. [July 30 estimate]And from the Altanta Fed: GDPNow
The initial GDPNow model estimate for real GDP growth (seasonally adjusted annual rate) in the third quarter of 2021 is 6.1 percent on July 30. [July 30 estimate]
Q2 2021 GDP Details on Residential and Commercial Real Estate
by Calculated Risk on 7/30/2021 11:41:00 AM
The BEA released the underlying details for the Q2 advance GDP report today.
The BEA reported that investment in non-residential structures decreased at a 7.0% annual pace in Q2. Note that weakness in non-residential structures started in 2019, before the pandemic.
Investment in petroleum and natural gas structures increased sharply in Q2 compared to Q1, and was up 46% year-over-year. However, investment in petroleum and natural gas structures is still down over 60% from the peak in 2014.

The first graph shows investment in offices, malls and lodging as a percent of GDP.
Investment in offices (blue) decreased in Q2, and was down 9.0% year-over-year.
Investment in multimerchandise shopping structures (malls) peaked in 2007 and was down about 19% year-over-year in Q2 - and at a record low as a percent of GDP. The vacancy rate for malls is still very high, so investment will probably stay low for some time.
Lodging investment increased slightly in Q2 compared to Q1, but lodging investment was down 19% year-over-year.
 The second graph is for Residential investment components as a percent of GDP. According to the Bureau of Economic Analysis, RI includes new single family structures, multifamily structures, home improvement, Brokers’ commissions and other ownership transfer costs, and a few minor categories (dormitories, manufactured homes).
Even though investment in single family structures has increased from the bottom, single family investment is just approaching normal levels as a percent of GDP.
Investment in single family structures was $405 billion (SAAR) (about 1.8% of GDP), and up 45% year-over-year.
Investment in multi-family structures increased in Q2.
Investment in home improvement was at a $331 billion Seasonally Adjusted Annual Rate (SAAR) in Q2 (about 1.5% of GDP). Home improvement spending has been strong during the pandemic.
Black Knight: Number of Homeowners in COVID-19-Related Forbearance Plans Increased Slightly
by Calculated Risk on 7/30/2021 10:07:00 AM
Note: Both Black Knight and the MBA (Mortgage Bankers Association) are putting out weekly estimates of mortgages in forbearance.
This data is as of July 27th.
From Andy Walden at Black Knight: Forbearances See Weekly Rise
After the last couple of weeks of volumes remaining flat, we did see some movement in the number of active forbearance plans this past week. According to our McDash Flash daily Forbearance Tracker data, the total number of active plans is up by 31,000 since last Tuesday.
Such upward movement late in the month has been relatively common in the recovery to date. Plan removals are clustered early in the month, which tends to lead to some degree of restart activity as the month progresses.
Despite this increase, there are still 163,000 (-7.9%) fewer plans than at the same time last month. As of July 27, 1.9 million borrowers remain in COVID-19 forbearance plans, making up 3.6% of all active mortgages and 2.0% of GSE, 6.3% of FHA/VA and 4.4% of Portfolio/PLS loans.
Click on graph for larger image.
Forbearances rose most significantly among loans held in bank portfolios or private label securities – which were up 35,000 for the week – with FHA/VA mortgages seeing a slight uptick in plans as well (+1,000). The 5,000-plan decline among GSE loans offset just a small share of the total weekly rise.
There are still some 179,000 plans are still scheduled to be reviewed for extension/removal in July, which provides some substantial opportunity for improvement next week.
While still low, new forbearance plan starts hit their highest weekly level since late March, with restart activity also remaining elevated. Roughly 2/3 of all starts over the past week were restarts. Removal volumes were the lowest since late May given the low volume of review activity at this time of month.
emphasis added


