 RSS Feed
 by Calculated Risk on 8/09/2021 08:18:00 AM
Monday, August 09, 2021
Seven High Frequency Indicators for the Economy
These indicators are mostly for travel and entertainment. It will interesting to watch these sectors recover as the pandemic subsides.
The TSA is providing daily travel numbers.
This data is as of August 8th.
 Click on graph for larger image.
This data shows the 7-day average of daily total traveler throughput from the TSA for 2019 (Light Blue), 2020 (Blue) and 2021 (Red).
The dashed line is the percent of 2019 for the seven day average.
The 7-day average is down 21.7% from the same day in 2019 (78.3% of 2019). (Dashed line)
There was a slow increase from the bottom starting in May 2020 - and then TSA data picked up in 2021 - but the dashed line has mostly sideways over the last six weeks.
The second graph shows the 7-day average of the year-over-year change in diners as tabulated by OpenTable for the US and several selected cities.
IMPORTANT: OpenTable notes: "we’ve updated the data including downloadable dataset from January 1, 2021 onward to compare seated diners from 2021 to 2019, as opposed to year over year." Thanks!
 Thanks to OpenTable for providing this restaurant data:
This data is updated through August 7, 2021.
This data is "a sample of restaurants on the OpenTable network across all channels: online reservations, phone reservations, and walk-ins. For year-over-year comparisons by day, we compare to the same day of the week from the same week in the previous year."
Note that this data is for "only the restaurants that have chosen to reopen in a given market". Since some restaurants have not reopened, the actual year-over-year decline is worse than shown.
Dining picked up during the holidays, then slumped with the huge winter surge in cases. Dining was generally picking up, but has moved sideways or down recently. The 7-day average for the US is down 9% compared to 2019.
----- Movie Tickets: Box Office Mojo -----
 This data shows domestic box office for each week and the median for the years 2016 through 2019 (dashed light blue).
 Thanks to OpenTable for providing this restaurant data:
This data is updated through August 7, 2021.
This data is "a sample of restaurants on the OpenTable network across all channels: online reservations, phone reservations, and walk-ins. For year-over-year comparisons by day, we compare to the same day of the week from the same week in the previous year."
Note that this data is for "only the restaurants that have chosen to reopen in a given market". Since some restaurants have not reopened, the actual year-over-year decline is worse than shown.
Dining picked up during the holidays, then slumped with the huge winter surge in cases. Dining was generally picking up, but has moved sideways or down recently. The 7-day average for the US is down 9% compared to 2019.
 This data shows domestic box office for each week and the median for the years 2016 through 2019 (dashed light blue).
 Blue is 2020 and Red is 2021.
The data is from BoxOfficeMojo through August 5th.
Note that the data is usually noisy week-to-week and depends on when blockbusters are released.
Movie ticket sales were at $119 million last week, down about 47% from the median for the week.
Note that the data is usually noisy week-to-week and depends on when blockbusters are released.
Movie ticket sales were at $119 million last week, down about 47% from the median for the week.
 This graph shows the seasonal pattern for the hotel occupancy rate using the four week average.
 The red line is for 2021, black is 2020, blue is the median, dashed purple is 2019, and dashed light blue is for 2009 (the worst year on record for hotels prior to 2020).
Occupancy is well above the horrible 2009 levels. With solid leisure travel, the Summer months have had decent occupancy - but it is uncertain what will happen in the Fall with business travel.
This data is through July 31st. The occupancy rate is down 6.2% compared to the same week in 2019. Note: Occupancy was up year-over-year, since occupancy declined sharply at the onset of the pandemic.
Notes: Y-axis doesn't start at zero to better show the seasonal change.
 This graph, based on weekly data from the U.S. Energy Information Administration (EIA), shows gasoline supplied compared to the same week of 2019.
Blue is for 2020. Red is for 2021.
As of July 30th, gasoline supplied was up 1.3% compared to the same week in 2019.
This is the 4th week so far this year when gasoline supplied was up compared to the same week in 2019.
This graph is from Apple mobility. From Apple: "This data is generated by counting the number of requests made to Apple Maps for directions in select countries/regions, sub-regions, and cities." This is just a general guide - people that regularly commute probably don't ask for directions.
There is also some great data on mobility from the Dallas Fed Mobility and Engagement Index. However the index is set "relative to its weekday-specific average over January–February", and is not seasonally adjusted, so we can't tell if an increase in mobility is due to recovery or just the normal increase in the Spring and Summer.
 This data is through August 7th for the United States and several selected cities.
The graph is the running 7-day average to remove the impact of weekends.
IMPORTANT: All data is relative to January 13, 2020. This data is NOT Seasonally Adjusted. People walk and drive more when the weather is nice, so I'm just using the transit data.
According to the Apple data directions requests, public transit in the 7 day average for the US is at 99.8% of the January 2020 level.
Strangely, New York City is doing well by this metric, but subway usage in NYC is down sharply (next graph). I'd put much more weight on subway usage!
----- New York City Subway Usage -----
Here is some interesting data on New York subway usage (HT BR).
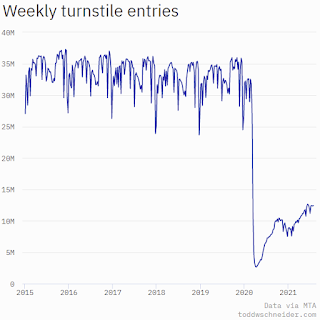 This graph is from Todd W Schneider. This is weekly data since 2015.
Here is some interesting data on New York subway usage (HT BR).
 This graph is from Todd W Schneider. This is weekly data since 2015.
 Most weeks are between 30 and 35 million entries, and currently there are over 12 million subway turnstile entries per week - and generally increasing.
This data is through Friday, August 6th.
Schneider has graphs for each borough, and links to all the data sources.
He notes: "Data updates weekly from the MTA’s public turnstile data, usually on Saturday mornings".
This data is through Friday, August 6th.
Schneider has graphs for each borough, and links to all the data sources.
He notes: "Data updates weekly from the MTA’s public turnstile data, usually on Saturday mornings".
Sunday, August 08, 2021
Monday: Job Openings
by Calculated Risk on 8/08/2021 06:07:00 PM
Weekend:
• Schedule for Week of August 8, 2021
Monday:
• At 10:00 AM ET, Job Openings and Labor Turnover Survey for June from the BLS.
From CNBC: Pre-Market Data and Bloomberg futures S&P 500 and DOW futures are mostly unchanged (fair value).
Oil prices were down over the last week with WTI futures at $68.28 per barrel and Brent at $70.70 per barrel. A year ago, WTI was at $41, and Brent was at $44 - so WTI oil prices are UP about 65% year-over-year (oil prices collapsed at the beginning of the pandemic).
Here is a graph from Gasbuddy.com for nationwide gasoline prices. Nationally prices are at $3.18 per gallon. A year ago prices were at $2.17 per gallon, so gasoline prices are up $1.01 per gallon year-over-year.
August 8th COVID-19: 7-Day Average Hospitalizations Over 50,000
by Calculated Risk on 8/08/2021 03:18:00 PM
Note: Cases and Deaths are not updated on Sundays.
The 7-day average cases is the highest since February 10th.
The 7-day average hospitalizations is the highest since February 25th.
The 7-day average deaths is the highest since May 27th.
This data is from the CDC.
According to the CDC, on Vaccinations.
Total doses administered: 351,400,930, as of a week ago 346,456,669. Average doses last week: 0.71 million per day.
| COVID Metrics | ||||
|---|---|---|---|---|
| Today | Yesterday | Week Ago | Goal | |
| Percent over 18, One Dose✅ | 71.0% | 70.6% | 69.9% | ≥70.0%1,2 |
| Fully Vaccinated✅ (millions) | 166.5 | 165.9 | 164.8 | ≥1601 |
| New Cases per Day3🚩 | 99,727 | 96,781 | 75,712 | ≤5,0002 |
| Hospitalized3🚩 | 50,502 | 49,620 | 36,952 | ≤3,0002 |
| Deaths per Day3🚩 | 454 | 424 | 302 | ≤502 |
| 1 America's Short Term Goals, 2my goals to stop daily posts, 37 day average for Cases, Hospitalized, and Deaths 🚩 Increasing 7 day average week-over-week for Cases, Hospitalized, and Deaths ✅ Short term goal met (even if late). | ||||
KUDOS to the residents of the 21 states and D.C. that have achieved the 70% goal (percent over 18 with at least one dose): Vermont, Hawaii, Massachusetts, Connecticut, Maine, New Jersey and New Mexico are at 80%+, and Rhode Island, Pennsylvania, California, Maryland, Washington, New Hampshire, New York, Illinois, Virginia, Delaware, Minnesota, Oregon, Colorado, Florida and D.C. are all over 70%.
Next up are Utah at 69.0%, Nebraska at 68.2%, Wisconsin at 68.2%, Kansas at 67.5%, South Dakota at 67.2%, Nevada at 66.9%, Texas at 66.5%, and Iowa at 66.4%.
 Click on graph for larger image.
This graph shows the daily (columns) and 7 day average (line) of hospitalizations reported.
This data is from the CDC.
Leading Index for Commercial Real Estate "Pulls Back in July"
by Calculated Risk on 8/08/2021 08:15:00 AM
From Dodge Data Analytics: Dodge Momentum Index Pulls Back in July
The Dodge Momentum Index fell to 155.8 (2000=100) in July, a 6% decline from the revised June reading of 164.9. The Momentum Index, issued by Dodge Data & Analytics, is a monthly measure of the first (or initial) report for nonresidential building projects in planning, which have been shown to lead construction spending for nonresidential buildings by a full year.
Both components of the Momentum Index fell in July. Commercial planning fell 3%, while institutional planning dropped 9%.
The Momentum Index posted strong gains through much of the winter and spring as the economy and building markets began to stabilize following the recession. While the economy has continued its forward progress through the summer, the Index has regressed somewhat as higher material prices and shortages of skilled labor continue to exert a strong influence over the construction sector. Despite the declines in June and July, the Momentum Index remains near levels last seen in 2018. Compared to a year earlier, the Momentum Index was 25% higher than in July 2020 — institutional planning was up 27% and commercial planning was 25% higher than last year.
emphasis added
 Click on graph for larger image.
This graph shows the Dodge Momentum Index since 2002. The index was at 155.8 in June, down from 164.9 in June.
According to Dodge, this index leads "construction spending for nonresidential buildings by a full year". This index suggests a decline in Commercial Real Estate construction through most of 2021, but a pickup towards the end of the year, and growth in 2022 (even with the decline in the July index).
Saturday, August 07, 2021
August 7th COVID-19: 125,000 New Cases Reported Today
by Calculated Risk on 8/07/2021 05:12:00 PM
Congratulations to the residents of New Mexico on joining the 80% club! Go for 90%!!! (80% of adults have had at least one shot).
The 7-day average cases is the highest since February 10th.
The 7-day average hospitalizations is the highest since February 26th.
The 7-day average deaths is the highest since May 27th.
This data is from the CDC.
According to the CDC, on Vaccinations.
Total doses administered: 350,627,188, as of a week ago 345,640,466. Average doses last week: 0.71 million per day.
| COVID Metrics | ||||
|---|---|---|---|---|
| Today | Yesterday | Week Ago | Goal | |
| Percent over 18, One Dose✅ | 70.8% | 70.6% | 69.7% | ≥70.0%1,2 |
| Fully Vaccinated✅ (millions) | 166.2 | 165.9 | 164.4 | ≥1601 |
| New Cases per Day3🚩 | 99,727 | 96,781 | 75,712 | ≤5,0002 |
| Hospitalized3🚩 | 49,588 | 47,388 | 35,013 | ≤3,0002 |
| Deaths per Day3🚩 | 454 | 424 | 302 | ≤502 |
| 1 America's Short Term Goals, 2my goals to stop daily posts, 37 day average for Cases, Hospitalized, and Deaths 🚩 Increasing 7 day average week-over-week for Cases, Hospitalized, and Deaths ✅ Short term goal met (even if late). | ||||
KUDOS to the residents of the 21 states and D.C. that have achieved the 70% goal (percent over 18 with at least one dose): Vermont, Hawaii, Massachusetts, Connecticut, Maine, New Jersey and New Mexico are at 80%+, and Rhode Island, Pennsylvania, California, Maryland, Washington, New Hampshire, New York, Illinois, Virginia, Delaware, Minnesota, Oregon, Colorado, Florida and D.C. are all over 70%.
Next up are Utah at 69.0%, Nebraska at 68.2%, Wisconsin at 68.0%, Kansas at 67.4%, South Dakota at 67.2%, Nevada at 66.7%, and Iowa at 66.4%.
 Click on graph for larger image.
This graph shows the daily (columns) and 7 day average (line) of positive tests reported.
This data is from the CDC.
Schedule for Week of August 8, 2021
by Calculated Risk on 8/07/2021 08:05:00 AM
The key report this week is July CPI.
 10:00 AM ET: Job Openings and Labor Turnover Survey for June from the BLS.
 This graph shows job openings (yellow line), hires (purple), Layoff, Discharges and other (red column), and Quits (light blue column) from the JOLTS.
Jobs openings increased in May to 9.209 million from 9.193 million in April.
The number of job openings (yellow) were up 69% year-over-year, and Quits were up 63% year-over-year.
6:00 AM ET: NFIB Small Business Optimism Index for July.
12:00 PM: MBA Q2 National Delinquency Survey
7:00 AM ET: The Mortgage Bankers Association (MBA) will release the results for the mortgage purchase applications index.
8:30 AM: The Consumer Price Index for July from the BLS. The consensus is for a 0.5% increase in CPI, and a 0.4% increase in core CPI.
8:30 AM: The initial weekly unemployment claims report will be released. The consensus is for a decrease to 370 thousand from 385 thousand last week.
8:30 AM: The Producer Price Index for July from the BLS. The consensus is for a 0.6% increase in PPI, and a 0.5% increase in core PPI.
10:00 AM: University of Michigan's Consumer sentiment index (Preliminary for August).
Friday, August 06, 2021
August 6th COVID-19: 2nd Worst Wave Continues to Increase
by Calculated Risk on 8/06/2021 08:23:00 PM
Congratulations to the residents of Florida on joining the 70% club! Go for 80%!!! (70% of adults have had at least one shot).
The 7-day average cases is the highest since February 11th.
The 7-day average hospitalizations is the highest since March 1st. (Not updated today).
The 7-day average deaths is the highest since May 30th.
This data is from the CDC.
According to the CDC, on Vaccinations.
Total doses administered: 349,787,479, as of a week ago 344,928,514. Average doses last week: 0.69 million per day.
| COVID Metrics | ||||
|---|---|---|---|---|
| Today | Yesterday | Week Ago | Goal | |
| Percent over 18, One Dose✅ | 70.6% | 70.4% | 69.6% | ≥70.0%1,2 |
| Fully Vaccinated✅ (millions) | 165.9 | 165.6 | 164.2 | ≥1601 |
| New Cases per Day3🚩 | 96,511 | 92,517 | 70,486 | ≤5,0002 |
| Hospitalized3🚩 | 44,865 | 43,037 | 31,331 | ≤3,0002 |
| Deaths per Day3🚩 | 424 | 377 | 276 | ≤502 |
| 1 America's Short Term Goals, 2my goals to stop daily posts, 37 day average for Cases, Hospitalized, and Deaths 🚩 Increasing 7 day average week-over-week for Cases, Hospitalized, and Deaths ✅ Short term goal met (even if late). | ||||
KUDOS to the residents of the 21 states and D.C. that have achieved the 70% goal (percent over 18 with at least one dose): Vermont, Hawaii, Massachusetts, Connecticut, Maine and New Jersey are at 80%+, and New Mexico, Rhode Island, Pennsylvania, California, Maryland, Washington, New Hampshire, New York, Illinois, Virginia, Delaware, Minnesota, Oregon, Colorado, Florida and D.C. are all over 70%.
Next up are Utah at 68.5%, Nebraska at 68.1%, Wisconsin at 67.9%, Kansas at 67.2%, South Dakota at 67.0%, Nevada at 66.6%, and Iowa at 66.3%.
 Click on graph for larger image.
This graph shows the daily (columns) and 7 day average (line) of positive tests reported.
This data is from the CDC.
Las Vegas Real Estate in July: Sales up 5% YoY, Inventory down 43% YoY
by Calculated Risk on 8/06/2021 05:52:00 PM
The Las Vegas Realtors reported Southern Nevada home prices eclipse $400,000 mark; LVR housing statistics for July 2021
A report released Friday by Las Vegas REALTORS® (LVR) shows local home prices passing the $400,000 mark for the first time while demand continues to outpace supply.1) Overall sales (single family and condos) were up 5.0% year-over-year from 4,025 in July 2020 to 4,225 in July 2021.
...
LVR reported a total of 4,225 existing local homes, condos and townhomes sold during July. Compared to one year ago, July sales were up 0.8% for homes and up 24.7% for condos and townhomes. So far this year, local home sales are on pace to exceed last year’s total and surpass the last post-recession high of 38,153 in 2011.
…
By the end of July, LVR reported 3,007 single-family homes listed for sale without any sort of offer. Although down 37.4% from the same time last year, Martinez noted the number of homes listed without offers actually increased for the fifth straight month – “indicators of the market fighting with all its might to normalize, but consumer consumption continues to remain strong.” For condos and townhomes, the 662 properties listed without offers in July were more than were listed during the previous month, though that inventory is still down 58.1% from the same time last year.
...
With eviction and foreclosure bans still in place, the number of so-called distressed sales remains near historically low levels. LVR reported that short sales and foreclosures combined accounted for just 0.3% of all existing local property sales in July. That compares to 1.2% of all sales one year ago, 2.0% two years ago, 2.9% three years ago and 6.4% four years ago.
emphasis added
2) Active inventory (single-family and condos) is down 42.6% from a year ago, from a total of 6,387 in July 2020 to 3,669 in July 2021. And months of inventory is extremely low.
3) Active inventory is up 21.1% from the previous month (June 2021), and up 56% from the all time low in February 2021 (2,352 single family and condos active listings).
AAR: July Rail Carloads down, Intermodal Down Compared to 2019
by Calculated Risk on 8/06/2021 02:08:00 PM
From the Association of American Railroads (AAR) Rail Time Indicators. Graphs and excerpts reprinted with permission.
U.S. rail traffic in July 2021 was up over July 2020, but for most commodity categories the percentage increase was significantly lower than in other recent months, both because of more difficult comparisons and because various external factors have led to a recent deceleration in rail volumes. In July, total U.S. carloads were up 6.6% over July 2020 and down 13.3% from July 2019.
emphasis added
 Click on graph for larger image.
This graph from the Rail Time Indicators report shows the six week average of U.S. Carloads in 2019, 2020 and 2021:
U.S. railroads originated 904,670 total carloads in July 2021, up 6.6% over July 2020 and down 13.3% from July 2019. The 6.6% is the smallest year-over-year gain for total carloads in four months. Total carloads averaged 226,168 per week in July 2021, which is the smallest weekly average for any month since February 2021 and the smallest weekly average for July — other than July 2020 — since our records begin in 1988.
 The second graph shows the six week average (not monthly) of U.S. intermodal in 2019, 2020 and 2021: (using intermodal or shipping containers):
U.S. intermodal originations were up 1.5% in July 2021 over July 2020 but were down 1.9% from July 2019. ...
The carload categories that caused the biggest problems for U.S. rail volumes in July 2021 were motor vehicles and grain.
Homebuilder Comments in July: “The frenzy is over, but things are still strong"
by Calculated Risk on 8/06/2021 12:08:00 PM
Some twitter comments from Rick Palacios Jr., Director of Research at John Burns Real Estate Consulting:
Analyzing July new home trends from our just published monthly builder survey. Top 3 themes: 1) Frenzy phase for housing is over, but still solid demand. 2) Fewer builders restricting sales. 3) Hitting price ceilings in more markets. Commentary from across the country to follow.
#Austin builder: “Builders are starting to offer incentives again to drive traffic and sales.”
#Dallas builder: “We have hit price ceilings in the majority of our submarkets.”
#Denver builder: “Already seeing prices flatten. Little buyer urgency in the market right now. Some is seasonal but feeling like the market is tapped out in pricing. Market is still very healthy but has lost its frenetic pace. Feels healthier and a bit more balanced.”
#SanDiego builder: “The frenzy is over, but things are still strong. However, you can feel the difference.”
#RiversideSanBernardino builder: “It doesn't feel like we're done with price appreciation. It feels more like a decline in the rate of increases. Prices have now reached a point where it is getting harder to qualify people.”
#Atlanta builder: “Major pause in the market w/on-line activity, which is 1/4 normal, w/leads way down & sales significantly down. Very little inventory to sell, mixed w/first 'seasonality' in almost 2 years. White hot frenzy from January to May of this year is clearly over."
#Charlotte builder: “No sales in June because we did not allow any and we had maximum that could be sold in July. Need to give production and design time to catch up on our backlog.”
#RaleighDurham builder: “The market can’t maintain its trajectory. If it does, local and long-term residents will be completely priced out of the market.”
#Greensboro builder: “We continue to experience delays in construction that stop our cycle build time, which limits our inventory and frustrates buyers, sellers, and trades.”
#Wilmington builder: “Just starting to put specs on the market again but trickling out based on stage of construction. Not preselling. Getting some price resistance now, but not backing off our price.”
#Nashville builder: “Starting to feel price hesitation, especially from first-time homebuyers and in outer shoulder markets.”
#Chicago builder: “We have seen a slowdown in overall activity in the last few weeks. Pace of sales is still good but not what it was, and seeing more price reductions than we have in the past.”
#Jacksonville builder: “Sales have definitely slowed down which is expected in July. The sales we are seeing are mostly from out-of-town buyers who don't have the sticker shock like the "locals" do. I do believe we've peaked as far as pricing is concerned."
#Naples builder: “We continue to have a sales moratorium in Southwest Florida. This most likely will last another 60 days before we can release any new homes. We need to spend this time to catch up on our backlog.”
#WashingtonDC builder: “There is a pronounced slowdown due to communities selling out faster than expected, limitations on sales, particularly townhomes and condominiums, and the lack of affordable first time buyer products.”
#Harrisburg builder: “Sales have decreased due to not having enough available lots ready in this market.”
#Provo builder: “Cancellations aren’t a concern - see some buyers' remorse after quick contracts. We are able to rewrite cancelled homes with another new buyer quickly.”
#Reno builder: “Sales are tapering due to reduced starts, driven in part by labor & material shortages. Seeing traffic slowing (seasonal slowdown, people traveling, taking vacations & school starts in a few weeks) which contributes to tapering sales.”
#Oakland builder: “We continue to be temporarily sold out at all of our communities and have long waiting lists.”
#Seattle builder: “Seeing a small correction as more inventory becomes available. Suspect we'll find the market & pricing remain flat with some incentives on move-in ready homes.”


