by Calculated Risk on 8/15/2021 03:03:00 PM
Sunday, August 15, 2021
August 15th COVID-19: 2nd Worst Wave Continues
Note: Cases and Deaths are not updated on Sundays.
The 7-day average deaths is the highest since May 14th.
According to the CDC, on Vaccinations.
Total doses administered: 356,433,665, as of a week ago 351,400,930. Average doses last week: 0.72 million per day.
| COVID Metrics | ||||
|---|---|---|---|---|
| Today | Yesterday | Week Ago | Goal | |
| Percent fully Vaccinated | 50.7% | 50.6% | 50.2% | ≥70.0%1 |
| Fully Vaccinated (millions) | 168.4 | 168.1 | 166.5 | ≥2321 |
| New Cases per Day3🚩 | 119,523 | 117,301 | 103,422 | ≤5,0002 |
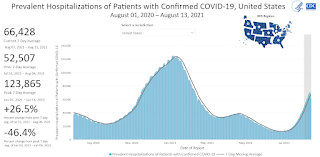
| Hospitalized3🚩 | 66,428 | 66,206 | 52,507 | ≤3,0002 |
| Deaths per Day3🚩 | 544 | 511 | 449 | ≤502 |
| 1 Minimum to achieve "herd immunity" (estimated between 70% and 85%). 2my goals to stop daily posts, 37 day average for Cases, Currently Hospitalized, and Deaths 🚩 Increasing 7 day average week-over-week for Cases, Hospitalized, and Deaths ✅ Goal met. | ||||
IMPORTANT: For "herd immunity" most experts believe we need 70% to 85% of the total population fully vaccinated (or already had COVID).
The following 19 states have between 50% and 59.9% fully vaccinated: New Jersey at 59.7%, New Hampshire, Washington, New York State, New Mexico, Oregon, District of Columbia, Virginia, Colorado, Minnesota, Hawaii, California, Delaware, Pennsylvania, Wisconsin, Iowa, Nebraska and Florida at 50.3%.
Next up (total population, fully vaccinated according to CDC) are Illinois at 49.7%, Michigan at 49.6%, South Dakota at 47.9, Ohio at 47.3%, Kentucky at 46.7%, Arizona at 46.4%, Kansas at 46.4%, Alaska at 46.2%, Utah at 45.8%, and Nevada at 45.8%.
 Click on graph for larger image.
This graph shows the daily (columns) and 7 day average (line) of hospitalizations reported. Note that the shaded area will probably be revised up.
Memphis Real Estate in July: Sales Up 21% YoY, Inventory Down 14% YoY
by Calculated Risk on 8/15/2021 11:31:00 AM
I'm tracking data for many local markets around the U.S. I think it is especially important to watch inventory this year.
From the Memphis Area Association of REALTORS®:
Closed sales (existing Single and condo) in July 2021 were 2,300, up 20.9% from 1,903 in July 2020.
Active Listings in July 2021 were 2,514, down 14.4% from 2,938 in July 2020.
Inventory in July was up 12.1% from the previous month, and up 27.2% from the record low in February 2021.
Nashville Real Estate in July: Sales Down 8% YoY, Inventory Down 43% YoY
by Calculated Risk on 8/15/2021 11:18:00 AM
I'm tracking data for many local markets around the U.S. I think it is especially important to watch inventory this year.
From the Greater Nashville REALTORS®:
Closed sales (single and condo) in July 2021 were 4,089, down 7.8% from 4,433 in July 2020.
Active Listings in July 2021 were 4,105, down 43.0% from 7,199 in July 2020.
Inventory in July was up 21.6% from the previous month, and up 30.0% from the record low in May 2021.
Albuquerque Real Estate in July: Sales Down 11% YoY, Inventory Down 40% YoY
by Calculated Risk on 8/15/2021 09:45:00 AM
I'm tracking data for many local markets around the U.S. I think it is especially important to watch inventory this year.
From the Greater Albuquerque Association of REALTORS®:
Closed sales (attached and detached) in July 2021 were 1,443, down 10.6% from 1,614 in July 2020.
Active Listings in July 2021 were 1,062, down 40.1% from 1,772 in July 2020.
Months of Supply (detached) was 0.8 Months in July 2021, compared to 1.5 Months in July 2020.
Inventory in July was down 4.5% from the previous month, and up 13.6% from the record low in March 2021.
Saturday, August 14, 2021
August 14th COVID-19: Over 70,000 Hospitalized Today, Over 800 Deaths
by Calculated Risk on 8/14/2021 06:19:00 PM
Experts currently think we need somewhere between 70% and 85% of the total population fully vaccinated to achieve "herd immunity". Vermont has the highest percentage of fully vaccinated at 67.0% - so there is a long way to go.
The 7-day average deaths is the highest since May 14th.
According to the CDC, on Vaccinations.
Total doses administered: 355,768,825, as of a week ago 350,627,188. Average doses last week: 0.73 million per day.
| COVID Metrics | ||||
|---|---|---|---|---|
| Today | Yesterday | Week Ago | Goal | |
| Percent fully Vaccinated | 50.6% | 50.5% | 50.2% | ≥70.0%1 |
| Fully Vaccinated (millions) | 168.1 | 167.7 | 166.8 | ≥2321 |
| New Cases per Day3🚩 | 119,523 | 117,301 | 103,422 | ≤5,0002 |
| Hospitalized3🚩 | 66,063 | 64,381 | 50,101 | ≤3,0002 |
| Deaths per Day3🚩 | 544 | 511 | 449 | ≤502 |
| 1 Minimum to achieve "herd immunity" (estimated between 70% and 85%). 2my goals to stop daily posts, 37 day average for Cases, Hospitalized, and Deaths 🚩 Increasing 7 day average week-over-week for Cases, Hospitalized, and Deaths ✅ Goal met. | ||||
KUDOS to the residents of the 5 states that have achieved 60% of population fully vaccinated: Vermont, Massachusetts, Maine, Connecticut, and Rhode Island.
The following states have between 50% and 59.9% fully vaccinated: Maryland, New Jersey, New Hampshire, Washington, New York State, New Mexico, Oregon, District of Columbia, Virginia, Colorado, Minnesota, Hawaii, California, Delaware, Pennsylvania, Wisconsin, Iowa, Nebraska and Florida at 50.2%.
Next up are Illinois at 49.6%, Michigan at 49.5%, South Dakota at 47.8, Ohio at 47.2%, Kentucky at 46.7%, Arizona at 46.3%, Kansas at 46.3%, Alaska at 46.2%, Utah at 45.8%, and Nevada at 45.7%.
 Click on graph for larger image.
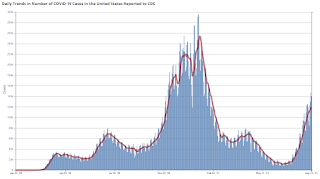
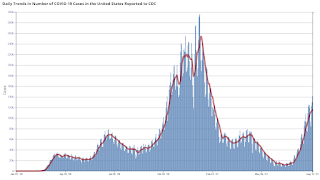
This graph shows the daily (columns) and 7 day average (line) of positive tests reported.
Jacksonville Real Estate in July: Sales Down 16% YoY, Inventory Down 40% YoY
by Calculated Risk on 8/14/2021 09:52:00 AM
I'm tracking data for many local markets around the U.S. I think it is especially important to watch inventory this year.
From the Northeast Florida Association of REALTORS®:
Closed sales (attached and detached) in July 2021 were 3,149, down 16.2% from 3,759 in July 2020.
Active Listings in July 2021 were 4,668, down 40.6% from 7,852 in July 2020.
Months of Supply was 1.4 Months in July 2021, compared to 2.8 Months in July 2020.
Inventory in July was up 1.8% from the previous month, and up 7.1% from the record low in May 2021.
Schedule for Week of August 15, 2021
by Calculated Risk on 8/14/2021 08:11:00 AM
The key reports this week are July Housing Starts and Retail sales.
For manufacturing, the Industrial Production report will be released.
The BLS will release the preliminary employment benchmark revision.
8:30 AM: The New York Fed Empire State manufacturing survey for August. The consensus is for a reading of 29.0, down from 43.0.
 8:30 AM: Retail sales for July is scheduled to be released. The consensus is for 0.2% decrease in retail sales.
This graph shows retail sales since 1992. This is monthly retail sales and food service, seasonally adjusted (total and ex-gasoline)
 9:15 AM: The Fed will release Industrial Production and Capacity Utilization for July.
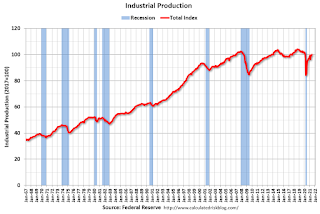
This graph shows industrial production since 1967.
The consensus is for a 0.5% increase in Industrial Production, and for Capacity Utilization to increase to 75.7%.
10:00 AM: The August NAHB homebuilder survey. The consensus is for a reading of 80, unchanged from 80. Any number above 50 indicates that more builders view sales conditions as good than poor.
12:00 PM: MBA Q2 National Delinquency Survey (expected)
1:30 PM: Fed Chair Powell speaks: Conversation with the Chair: A Virtual Teacher Town Hall Meeting
7:00 AM ET: The Mortgage Bankers Association (MBA) will release the results for the mortgage purchase applications index.
 8:30 AM ET: Housing Starts for July.
 This graph shows single and total housing starts since 1968.
The consensus is for 1.602 million SAAR, down from 1.643 million SAAR in June.
10:00 AM: the Bureau of Labor Statistics (BLS) will release the preliminary estimate of the upcoming annual benchmark revision.
During the day: The AIA's Architecture Billings Index for July (a leading indicator for commercial real estate).
2:00 PM: FOMC Minutes, July 27-28, 2021
8:30 AM: The initial weekly unemployment claims report will be released. The consensus is for a decrease to 360 thousand from 375 thousand last week.
8:30 AM: the Philly Fed manufacturing survey for August. The consensus is for a reading of 25.0, up from 21.9.
10:00 AM: State Employment and Unemployment (Monthly) for July 2021
Friday, August 13, 2021
August 13th COVID-19: Over 140,000 New Cases Reported Today
by Calculated Risk on 8/13/2021 05:30:00 PM
Congratulations to the residents of California and Pennsylvania on joining the 80% club! Go for 90%!!! (80% of adults have had at least one shot).
The 7-day average deaths is the highest since May 19th.
According to the CDC, on Vaccinations.
Total doses administered: 354,777,950, as of a week ago 349,787,479. Average doses last week: 0.71 million per day.
| COVID Metrics | ||||
|---|---|---|---|---|
| Today | Yesterday | Week Ago | Goal | |
| Percent over 18, One Dose✅ | 71.6% | 71.5% | 70.6% | ≥70.0%1,2 |
| Fully Vaccinated✅ (millions) | 167.7 | 167.4 | 165.9 | ≥1601 |
| New Cases per Day3🚩 | 116,508 | 114,208 | 100,981 | ≤5,0002 |
| Hospitalized3🚩 | 64,231 | 62,117 | 47,709 | ≤3,0002 |
| Deaths per Day3🚩 | 514 | 491 | 424 | ≤502 |
| 1 America's Short Term Goals, 2my goals to stop daily posts, 37 day average for Cases, Hospitalized, and Deaths 🚩 Increasing 7 day average week-over-week for Cases, Hospitalized, and Deaths ✅ Short term goal met (even if late). | ||||
KUDOS to the residents of the 21 states and D.C. that have achieved the 70% goal (percent over 18 with at least one dose): Vermont, Hawaii, Massachusetts, Connecticut, Maine, New Jersey, New Mexico, Rhode Island, Pennsylvania, California are at 80%+, Maryland, Washington, New Hampshire, New York, Illinois, Virginia, Delaware, Minnesota, Oregon, Colorado, Florida and D.C. are all over 70%.
Next up are Utah at 69.7%, Nebraska at 68.9%, Wisconsin at 68.6%, Kansas at 68.1%, South Dakota at 67.8%, Nevada at 67.6%, Texas at 67.5%, and Iowa at 67.1%.
 Click on graph for larger image.
This graph shows the daily (columns) and 7 day average (line) of positive tests reported.
Santa Clara Real Estate in July: Sales Up 29% YoY, Inventory Down 7% YoY
by Calculated Risk on 8/13/2021 01:04:00 PM
I'm tracking data for many local markets around the U.S. I think it is especially important to watch inventory this year.
From the Santa Clara Realtors (includes San Jose):
Closed sales (single family and condos) in July 2021 were 1,783, up 29.4% from 1,378.
in July 2020.
Active Listings in July 2021 were 1,820, down 6.7% from 1,9501 in July 2020. (1estimate)
Inventory in July was up 3.0% from the previous month, and up 58.4% from the record low in December 2020.
Early Q3 GDP Forecasts: Around 6% to 7% with "Significant downside risk"
by Calculated Risk on 8/13/2021 11:16:00 AM
From BofA:
We look for growth of 7.0% qoq SAAR in 3Q ... We forecast retail sales fell by 2.3% mom in July, reflecting cooling service demand on Delta concerns and weaker online spend from the pull forward in the timing of Prime day. This poses significant downside risk to our 3Q GDP forecast; if we are correct, 3Q GDP tracking could fall to 3%. [August 13 estimate]From the NY Fed Nowcasting Report
emphasis added
The New York Fed Staff Nowcast stands at 3.8% for 2021:Q3. [August 13 estimate]And from the Altanta Fed: GDPNow
The GDPNow model estimate for real GDP growth (seasonally adjusted annual rate) in the third quarter of 2021 is 6.0 percent on August 6, down from 6.1 percent on August 5. [August 6 estimate]


