by Calculated Risk on 8/19/2021 03:33:00 PM
Thursday, August 19, 2021
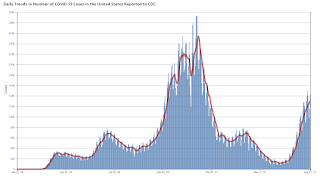
August 19th COVID-19: Over 1,000 Deaths, Over 75,000 Hospitalized, Almost 160,000 Cases Reported Today
The 7-day average deaths is the highest since April 24th.
Total doses administered: 359,623,380, as of a week ago 353,859,894. Average doses last week: 0.82 million per day.
| COVID Metrics | ||||
|---|---|---|---|---|
| Today | Yesterday | Week Ago | Goal | |
| Percent fully Vaccinated | 51.1% | 51.0% | 50.4% | ≥70.0%1 |
| Fully Vaccinated (millions) | 169.6 | 169.2 | 167.4 | ≥2321 |
| New Cases per Day3🚩 | 133,055 | 130,562 | 116,740 | ≤5,0002 |
| Hospitalized3🚩 | 76,077 | 74,755 | 62,230 | ≤3,0002 |
| Deaths per Day3🚩 | 640 | 586 | 578 | ≤502 |
| 1 Minimum to achieve "herd immunity" (estimated between 70% and 85%). 2my goals to stop daily posts, 37 day average for Cases, Currently Hospitalized, and Deaths 🚩 Increasing 7 day average week-over-week for Cases, Hospitalized, and Deaths ✅ Goal met. | ||||
IMPORTANT: For "herd immunity" most experts believe we need 70% to 85% of the total population fully vaccinated (or already had COVID).
The following 17 states and D.C. have between 50% and 59.9% fully vaccinated: New Hampshire at 59.1%, Washington, New York State, New Mexico, Oregon, District of Columbia, Virginia, Colorado, Minnesota, California, Hawaii, Delaware, Pennsylvania, Wisconsin, Florida, Nebraska, Iowa and Illinois at 50.1%.
Next up (total population, fully vaccinated according to CDC) are Michigan at 49.7%, South Dakota at 48.2%, Ohio at 47.5%, Kentucky at 47.1%, Kansas at 46.8%, Arizona at 46.6%, Alaska at 46.5%, Utah at 46.3%, and Nevada at 46.3%.
 Click on graph for larger image.
This graph shows the daily (columns) and 7 day average (line) of positive tests reported.
Central Texas (Austin) Real Estate in July: Sales Down 9% YoY, Inventory Down 24% YoY
by Calculated Risk on 8/19/2021 02:26:00 PM
Note: I'm tracking data for many local markets around the U.S. I think it is especially important to watch inventory this year.
For the Austin-Round Rock area: Central Texas Housing Market Report; July 2021
Residential home sales decreased across the Austin-Round Rock Metropolitan Statistical Area (MSA) for the first time since May 2020, according to the Austin Board of REALTORS® July 2021 Central Texas Housing Report. Despite the dip, the five-county MSA was just 445 homes shy of breaking the all-time home sales record set in July 2020.Closed sales in July 2021 were 4,041, down 9.9% from 4,486 in July 2020.
Active Listings in July 2021 were 3,294, down 38.0% from 5,309 in July 2020.
Inventory in July was up 45% from last month, and up 174% from the all time low in March 2021.
Phoenix Real Estate in July: Sales Down 15% YoY, Active Inventory Down 16% YoY
by Calculated Risk on 8/19/2021 12:46:00 PM
Note: I'm tracking data for many local markets around the U.S. I think it is especially important to watch inventory this year.
The Arizona Regional Multiple Listing Service (ARMLS) reports ("Stats Report"):
1) Overall sales were at 8,715 in July, down 15.4% from 10,303 in July 2020.
2) Active inventory was at 6,746, down 15.8% from 8,010 in July 2020.
3) Months of supply decreased to 1.24 in July from 1.26 in July 2020. This is low.
Inventory in July was up 15.0% from last month, and up 63% from the record low in February 2021.
Rhode Island Real Estate in July: Sales Down 9% YoY, Inventory Down 24% YoY
by Calculated Risk on 8/19/2021 11:59:00 AM
Note: I'm tracking data for many local markets around the U.S. I think it is especially important to watch inventory this year.
For for the entire state of Rhode Island:
Closed sales (single family and condos) in July 2021 were 1,305, down 9.3% from 1,439 in July 2020.
Active Listings (single family and condos) in July 2021 were 2,110, down 24.0% from 2,775 in July 2020.
Inventory in July was up 6.3% from last month, and up 84.6% from the all time low in May 2021.
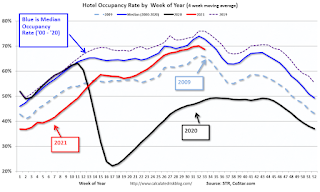
Hotels: Occupancy Rate Down 8% Compared to Same Week in 2019; "Leisure demand wanes"
by Calculated Risk on 8/19/2021 11:33:00 AM
Note: The year-over-year occupancy comparisons are easy, since occupancy declined sharply at the onset of the pandemic. So STR is comparing to the same week in 2019.
The occupancy rate is down 8.3% compared to the same week in 2019.
U.S. hotel occupancy and average daily rate (ADR) dipped from previous weeks, according to STR‘s latest data through August 14.The following graph shows the seasonal pattern for the hotel occupancy rate using the four week average.
August 8-14, 2021 (percentage change from comparable week in 2019*):
• Occupancy: 65.7% (-8.4%)
• Average daily rate (ADR): $139.18 (+5.9%)
• Revenue per available room (RevPAR): $91.45 (-3.0%)
While the metrics were down week over week, comparisons with 2019 remained consistent, which is further evidence of seasonality in the data as more schools return to class and leisure demand wanes. Concern around COVID-19 cases also persists.
...
*Due to the steep, pandemic-driven performance declines of 2020, STR is measuring recovery against comparable time periods from 2019.
emphasis added
 Click on graph for larger image.
The red line is for 2021, black is 2020, blue is the median, dashed purple is 2019, and dashed light blue is for 2009 (the worst year on record for hotels prior to 2020).
Note: Y-axis doesn't start at zero to better show the seasonal change.
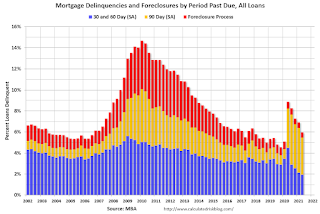
MBA: "Mortgage Delinquencies Decrease in the Second Quarter of 2021"
by Calculated Risk on 8/19/2021 10:39:00 AM
From the MBA: Mortgage Delinquencies Decrease in the Second Quarter of 2021
The delinquency rate for mortgage loans on one-to-four-unit residential properties decreased to a seasonally adjusted rate of 5.47 percent of all loans outstanding at the end of the second quarter of 2021, according to the Mortgage Bankers Association's (MBA) National Delinquency Survey.
For the purposes of the survey, MBA asks servicers to report loans in forbearance as delinquent if the payment was not made based on the original terms of the mortgage. The delinquency rate was down 91 basis points from the first quarter of 2021 and down 275 basis points from one year ago.
"Mortgage delinquencies across all loan types - conventional, FHA, and VA - reached their lowest levels since the first quarter of 2020," said Marina Walsh, CMB, MBA's Vice President of Industry Analysis. "The drop in the delinquency rate for FHA loans and VA loans was the largest quarterly decline for both in the history of MBA's survey dating back to 1979."
...
Walsh added, "Much of the second-quarter improvement can be traced to later-stage delinquent loans - those 90 days or past due, but not in foreclosure. In fact, the 90-day delinquency rate dropped by 72 basis points, which is another record decline in the survey. It appears that borrowers in later stages of delinquency are recovering due to several factors, including improved employment and other economic conditions, the availability of home retention workout options after forbearance, and a strong housing market that is bringing additional alternatives to distressed homeowners."
Walsh noted that foreclosure moratoria were still in place through the second quarter, resulting in the lowest foreclosure inventory recorded since 1981.
"Once the foreclosure moratoria lift, and forbearance plans expire over the course of the next several months, we expect many homeowners to take advantage of available workout options to avoid the foreclosure process," said Walsh.
emphasis added
 Click on graph for larger image.
This graph shows the percent of loans delinquent by days past due. Overall delinquencies decreased in Q2.
From the MBA:
Compared to the first quarter of 2021, the seasonally adjusted mortgage delinquency rate decreased for all loans outstanding. By stage, the 30-day delinquency rate decreased 5 basis points to 1.41 percent and the 60-day delinquency rate decreased 15 basis points to 0.52 percent, both at their lowest levels in the history of the survey. The 90-day delinquency bucket decreased 72 basis points to 3.53 percent.This sharp increase last year in the 90-day bucket was due to loans in forbearance (included as delinquent, but not reported to the credit bureaus).
...
The delinquency rate includes loans that are at least one payment past due but does not include loans in the process of foreclosure. The percentage of loans in the foreclosure process at the end of the second quarter was 0.51 percent, down 3 basis points from the first quarter of 2021 and 17 basis points lower than one year ago. This is the lowest foreclosure inventory rate since the fourth quarter of 1981. The percentage of loans on which foreclosure actions were started in the second quarter remained unchanged from last quarter at 0.04 percent.
The percent of loans in the foreclosure process declined further, and was at the lowest level since 1981.
Weekly Initial Unemployment Claims decrease to 348,000
by Calculated Risk on 8/19/2021 08:35:00 AM
The DOL reported:
In the week ending August 14, the advance figure for seasonally adjusted initial claims was 348,000, a decrease of 29,000 from the previous week's revised level. This is the lowest level for initial claims since March 14, 2020 when it was 256,000. The previous week's level was revised up by 2,000 from 375,000 to 377,000. The 4-week moving average was 377,750, a decrease of 19,000 from the previous week's revised average. This is the lowest level for this average since March 14, 2020 when it was 225,500. The previous week's average was revised up by 500 from 396,250 to 396,750.This does not include the 109,379 initial claims for Pandemic Unemployment Assistance (PUA) that was up from 103,847 the previous week.
emphasis added
The following graph shows the 4-week moving average of weekly claims since 1971.
 Click on graph for larger image.
The dashed line on the graph is the current 4-week average. The four-week average of weekly unemployment claims decreased to 377,750.
The previous week was revised up.
Regular state continued claims decreased to 2,820,000 (SA) from 2,899,000 (SA) the previous week.
Note: There are an additional 4,877,668 receiving Pandemic Unemployment Assistance (PUA) that increased from 4,820,787 the previous week (there are questions about these numbers). This is a special program for business owners, self-employed, independent contractors or gig workers not receiving other unemployment insurance. And an additional 3,786,488 receiving Pandemic Emergency Unemployment Compensation (PEUC) down from 3,852,569.
Weekly claims were below the consensus forecast.
Wednesday, August 18, 2021
Thursday: Unemployment Claims, Philly Fed Mfg
by Calculated Risk on 8/18/2021 09:00:00 PM
Thursday:
• At 8:30 AM ET, The initial weekly unemployment claims report will be released. The consensus is for a decrease to 360 thousand from 375 thousand last week.
• Also at 8:30 AM, the Philly Fed manufacturing survey for August. The consensus is for a reading of 25.0, up from 21.9.
August 18th COVID-19: Average Daily Deaths have Tripled Since Low in July
by Calculated Risk on 8/18/2021 05:32:00 PM
The 7-day average deaths is the highest since May 13th.
According to the CDC, on Vaccinations.
Total doses administered: 358,599,835, as of a week ago 353,205,544. Average doses last week: 0.77 million per day.
| COVID Metrics | ||||
|---|---|---|---|---|
| Today | Yesterday | Week Ago | Goal | |
| Percent fully Vaccinated | 51.0% | 50.9% | 50.3% | ≥70.0%1 |
| Fully Vaccinated (millions) | 169.2 | 168.9 | 167.1 | ≥2321 |
| New Cases per Day3🚩 | 130,121 | 128,508 | 114,963 | ≤5,0002 |
| Hospitalized3🚩 | 74,602 | 73,099 | 59,800 | ≤3,0002 |
| Deaths per Day3🚩 | 554 | 534 | 520 | ≤502 |
| 1 Minimum to achieve "herd immunity" (estimated between 70% and 85%). 2my goals to stop daily posts, 37 day average for Cases, Currently Hospitalized, and Deaths 🚩 Increasing 7 day average week-over-week for Cases, Hospitalized, and Deaths ✅ Goal met. | ||||
IMPORTANT: For "herd immunity" most experts believe we need 70% to 85% of the total population fully vaccinated (or already had COVID).
The following 18 states and D.C. have between 50% and 59.9% fully vaccinated: New Jersey at 59.9%, New Hampshire, Washington, New York State, New Mexico, Oregon, District of Columbia, Virginia, Colorado, Minnesota, California, Hawaii, Delaware, Pennsylvania, Wisconsin, Florida, Nebraska, Iowa and Illinois at 50.0%.
Next up (total population, fully vaccinated according to CDC) are Michigan at 49.7%, South Dakota at 48.1, Ohio at 47.5%, Kentucky at 47.0%, Kansas at 46.7%, Arizona at 46.6%, Alaska at 46.4%, Utah at 46.2%, and Nevada at 46.1%.
 Click on graph for larger image.
This graph shows the daily (columns) and 7 day average (line) of positive tests reported.
Lawler: Early Read on Existing Home Sales in July
by Calculated Risk on 8/18/2021 03:33:00 PM
From housing economist Tom Lawler (see important comments on inventory):
Based on publicly-available local realtor/MLS reports released across the country through today, I project that existing home sales as estimated by the National Association of Realtors ran at a seasonally adjusted annual rate of 5.86 million in July, unchanged from June’s preliminary pace and down 0.7% from last July’s seasonally adjusted pace. Unadjusted sales should show a larger YOY decline, reflecting this July’s lower business day count compared to last July.
Local realtor reports, as well as reports from national inventory trackers, suggest that while the inventory of existing homes for sale remained low last month, inventories on the month increased by substantially more than the seasonal norm, and the YOY decline in July was significantly less than in June. What this means for the NAR’s inventory estimate for July, however, is unclear As I’ve noted before, the inventory measure in most publicly-released local realtor/MLS reports excludes listings with pending contracts, but that is not the case for most of the reports sent to the NAR (referred to as the “NAR Report!”), Since the middle of last Spring inventory measures excluding pending listings have fallen much more sharply than inventory measures including such listings, and this latter inventory measure understates the decline in the effective inventory of homes for sale over the last several months. Having said that, however, it is clear that seasonally adjusted inventories have been trending higher over the past several months.
Finally, local realtor/MLS reports suggest the median existing single-family home sales price last month was up by about 16.1% from last July.
CR Note: The National Association of Realtors (NAR) is scheduled to release July existing home sales on Monday, August 23, 2021 at 10:00 AM ET. The consensus is for 5.84 million SAAR.


