by Calculated Risk on 8/25/2021 06:20:00 PM
Wednesday, August 25, 2021
Thursday: GDP, Unemployment Claims
Thursday:
• At 8:30 AM ET, Gross Domestic Product, 2nd quarter 2021 (second estimate). The consensus is that real GDP increased 6.7% annualized in Q2, up from the advance estimate of 6.5% in Q2.
• At 8:30 AM, The initial weekly unemployment claims report will be released. The consensus is for a increase slightly to 350 thousand from 348 thousand last week.
• At 11:00 AM, the Kansas City Fed manufacturing survey for August.
• Thursday through Saturday, Jackson Hole Economic Policy Symposium, Macroeconomic Policy in an Uneven Economy
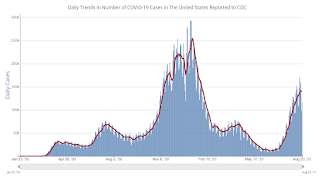
August 25th COVID-19: 7-Day Average New Cases Highest Since January
by Calculated Risk on 8/25/2021 04:16:00 PM
The 7-day average deaths is the highest since March 17th.
| COVID Metrics | ||||
|---|---|---|---|---|
| Today | Yesterday | Week Ago | Goal | |
| Percent fully Vaccinated | 51.7% | 51.6% | 51.0% | ≥70.0%1 |
| Fully Vaccinated (millions) | 171.8 | 171.4 | 169.2 | ≥2321 |
| New Cases per Day3🚩 | 142,029 | 141,091 | 134,091 | ≤5,0002 |
| Hospitalized3🚩 | 85,611 | 85,004 | 75,544 | ≤3,0002 |
| Deaths per Day3🚩 | 809 | 765 | 659 | ≤502 |
| 1 Minimum to achieve "herd immunity" (estimated between 70% and 85%). 2my goals to stop daily posts, 37 day average for Cases, Currently Hospitalized, and Deaths 🚩 Increasing 7 day average week-over-week for Cases, Hospitalized, and Deaths ✅ Goal met. | ||||
IMPORTANT: For "herd immunity" most experts believe we need 70% to 85% of the total population fully vaccinated (or already had COVID).
The following 17 states and D.C. have between 50% and 59.9% fully vaccinated: Washington at 59.6%, New Hampshire, New York State, New Mexico, Oregon, District of Columbia, Virginia, Colorado, Minnesota, California, Hawaii, Delaware, Pennsylvania, Wisconsin, Florida, Nebraska, Iowa, Illinois, and Michigan at 50.1%.
Next up (total population, fully vaccinated according to CDC) are South Dakota at 48.7%, Ohio at 47.9%, Kentucky at 47.8%, Kansas at 47.5%, Arizona at 47.3%, Utah at 47.2%, Nevada at 47.0%, and Alaska at 46.8%.
 Click on graph for larger image.
This graph shows the daily (columns) and 7 day average (line) of positive tests reported.
Philly Fed: State Coincident Indexes Increased in 46 States in July
by Calculated Risk on 8/25/2021 11:34:00 AM
From the Philly Fed:
The Federal Reserve Bank of Philadelphia has released the coincident indexes for the 50 states for July 2021. Over the past three months, the indexes increased in 48 states, decreased in one state, and remained stable in one, for a three-month diffusion index of 94. Additionally, in the past month, the indexes increased in 46 states, decreased in one state, and remained stable in three, for a one-month diffusion index of 90. For comparison purposes, the Philadelphia Fed has also developed a similar coincident index for the entire United States. The Philadelphia Fed’s U.S. index increased 1.9 percent over the past three months and 0.8 percent in July.Note: These are coincident indexes constructed from state employment data. An explanation from the Philly Fed:
emphasis added
The coincident indexes combine four state-level indicators to summarize current economic conditions in a single statistic. The four state-level variables in each coincident index are nonfarm payroll employment, average hours worked in manufacturing by production workers, the unemployment rate, and wage and salary disbursements deflated by the consumer price index (U.S. city average). The trend for each state’s index is set to the trend of its gross domestic product (GDP), so long-term growth in the state’s index matches long-term growth in its GDP.
 Click on map for larger image.
Here is a map of the three month change in the Philly Fed state coincident indicators. This map was all red during the worst of the Pandemic and also at the worst of the Great Recession.
The map is almost all positive on a three month basis.
Source: Philly Fed.
 And here is a graph is of the number of states with one month increasing activity according to the Philly Fed.
 In July, 48 states had increasing activity including minor increases.
REALTORS® Confidence Index Survey July 2021: "Demand is cooling in a moderately strong market"
by Calculated Risk on 8/25/2021 10:11:00 AM
Some interesting information from the REALTORS® Confidence Index Survey July 2021
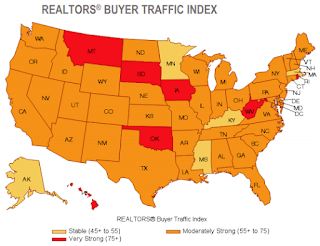
Several metrics indicate that demand is cooling in a moderately strong market. With limited supply in the market, homes typically sold within 17 days (22 days one year ago). The REALTORS® Buyer Traffic Index decreased further from 71 in June to 64 in July (moderately strong conditions) while the REALTORS® Seller Traffic Index remains below 50 which is “weak” traffic compared to the level one year ago. On average, a home sold had more than 4 offers, for which remains unchanged from last month’s survey. REALTORS® expect home prices in the next three months to increase nearly 2% from one year ago compared to 4% outlook in last month’s survey. Respondents expect sales in the next three months to decrease 1% from last year’s sales level compared to the 1% outlook in last month’s survey.
emphasis added
 Click on graph for larger image.
This map, from the July NAR report, shows buyer traffic is mostly "moderately strong" just about everywhere.
This is less demand than last month, and significantly less than a few months ago.
As the NAR noted: "demand is cooling in a moderately strong market".
 The second map is from the April report.
In April, buyer traffic was very strong just about everywhere.
There has also been a shift in seller traffic, with more traffic in many states (compare map from April on page 3 to the map from July also on page 3).
MBA: Mortgage Applications Increase in Latest Weekly Survey
by Calculated Risk on 8/25/2021 07:00:00 AM
From the MBA: Mortgage Applications Increase in Latest MBA Weekly Survey
Mortgage applications increased 1.6 percent from one week earlier, according to data from the Mortgage Bankers Association’s (MBA) Weekly Mortgage Applications Survey for the week ending August 20, 2021.
... The Refinance Index increased 1 percent from the previous week and was 3 percent higher than the same week one year ago. The seasonally adjusted Purchase Index increased 3 percent from one week earlier. The unadjusted Purchase Index increased 1 percent compared with the previous week and was 16 percent lower than the same week one year ago.
“Treasury yields fell last week, as investors continue to anxiously monitor if the rise in COVID-19 cases in several states starts to dampen economic activity. Mortgage rates slightly declined as a result, with the 30-year fixed rate decreasing for the first time in three weeks. Lower rates led to an increase in refinance applications, with government loan applications jumping 10 percent to the highest level since May 2021,” said Joel Kan, MBA’s Associate Vice President of Economic and Industry Forecasting. “Purchase applications for both conventional and government loans also increased. The purchase index was at its highest level since early July, despite still continuing to lag 2020’s pace. There was also some easing in average loan sizes, which is potentially a sign that more first-time buyers looking for lower-priced homes are being helped by the recent uptick in for-sale inventory for both newly built homes and existing homes.”
...
The average contract interest rate for 30-year fixed-rate mortgages with conforming loan balances ($548,250 or less) decreased to 3.03 percent from 3.06 percent, with points decreasing to 0.29 from 0.34 (including the origination fee) for 80 percent loan-to-value ratio (LTV) loans. The effective rate decreased from last week.
emphasis added
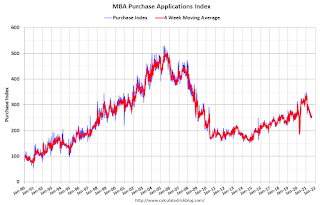
 Click on graph for larger image.
The first graph shows the refinance index since 1990.
With low rates, the index remains elevated.
The second graph shows the MBA mortgage purchase index
 According to the MBA, purchase activity is down 16% year-over-year unadjusted.
Note: The year ago comparisons for the unadjusted purchase index are now difficult since purchase activity picked up in late May 2020.
Note: Red is a four-week average (blue is weekly).
Tuesday, August 24, 2021
August Vehicle Sales Forecast: "Light-Vehicle Sales to Continue Downward Spiral"
by Calculated Risk on 8/24/2021 05:53:00 PM
From WardsAuto: JAugust U.S. Light-Vehicle Sales to Continue Downward Spiral (pay content)
Low inventories and supply issues (microchips) are impacting sales.

This graph shows actual sales from the BEA (Blue), and Wards forecast for August (Red).
The Wards forecast of 14.1 million SAAR, would be down about 4% from last month, and down 7.5% from a year ago (sales were recovering in July 2020 from the depths of the pandemic).
Alabama Real Estate in July: Sales Down 1% YoY, Inventory Down 29% YoY
by Calculated Risk on 8/24/2021 04:07:00 PM
Note: I'm tracking data for many local markets around the U.S. I think it is especially important to watch inventory this year.
Here is a summary post for many markets: Existing Home Inventory in July: Local Markets
For the entire state of Alabama:
Closed sales in July 2021 were 7,601, down 1.5% from 7,714 in July 2020.
Active Listings in July 2021 were 11,146, down 29.3% from 15,772 in July 2020.
Months of Supply was 1.5 Months in July 2021, compared to 2.0 Months in July 2020.
Inventory in July was up 12.0% from last month, and up 19.0% from the record low in May 2021.
August 24th COVID-19: Cases Might be Peaking
by Calculated Risk on 8/24/2021 03:56:00 PM
The 7-day average deaths is the highest since March 20th.
| COVID Metrics | ||||
|---|---|---|---|---|
| Today | Yesterday | Week Ago | Goal | |
| Percent fully Vaccinated | 51.6% | 51.5% | 50.9% | ≥70.0%1 |
| Fully Vaccinated (millions) | 171.4 | 171.1 | 168.9 | ≥2321 |
| New Cases per Day3🚩 | 141,091 | 140,189 | 132,499 | ≤5,0002 |
| Hospitalized3🚩 | 84,456 | 83,549 | 73,593 | ≤3,0002 |
| Deaths per Day3🚩 | 775 | 756 | 652 | ≤502 |
| 1 Minimum to achieve "herd immunity" (estimated between 70% and 85%). 2my goals to stop daily posts, 37 day average for Cases, Currently Hospitalized, and Deaths 🚩 Increasing 7 day average week-over-week for Cases, Hospitalized, and Deaths ✅ Goal met. | ||||
IMPORTANT: For "herd immunity" most experts believe we need 70% to 85% of the total population fully vaccinated (or already had COVID).
The following 17 states and D.C. have between 50% and 59.9% fully vaccinated: Washington at 59.5%, New Hampshire, New York State, New Mexico, Oregon, District of Columbia, Virginia, Colorado, Minnesota, California, Hawaii, Delaware, Pennsylvania, Wisconsin, Florida, Nebraska, Iowa, Illinois, and Michigan at 50.0%.
Next up (total population, fully vaccinated according to CDC) are South Dakota at 48.4%, Ohio at 47.9%, Kentucky at 47.7%, Kansas at 47.4%, Arizona at 47.2%, Nevada at 46.9%, Utah at 46.9%, and Alaska at 46.8%.
 Click on graph for larger image.
This graph shows the daily (columns) and 7 day average (line) of positive tests reported.
New Home Prices
by Calculated Risk on 8/24/2021 01:02:00 PM
As part of the new home sales report released this morning, the Census Bureau reported the number of homes sold by price and the average and median prices.
From the Census Bureau: "The median sales price of new houses sold in July 2021 was $390,500. The average sales price was $446,000."
The following graph shows the median and average new home prices.

During the housing bust, the builders had to build smaller and less expensive homes to compete with all the distressed sales. When housing started to recovery - with limited finished lots in recovering areas - builders moved to higher price points to maximize profits.
The average price in July 2021 was a record $446,00, up 18% year-over-year. The median price was a record $390,500, up 18% year-over-year.
The second graph shows the percent of new homes sold by price.
 Very few new homes sold were under $200K in July 2021 (about 1.6% of all homes). This is down from 56% in 2002. In general, the under $200K bracket is going away.
 The $400K and greater than $500K+ brackets increased significantly over the last decade.
A few Comments on July New Home Sales
by Calculated Risk on 8/24/2021 11:13:00 AM
New home sales for July were reported at 708,000 on a seasonally adjusted annual rate basis (SAAR). Sales for the previous three months were revised up, combined.
This was somewhat above consensus expectations for July, but still down 27.2% year-over-year - since sales increased sharply following the early months of the pandemic. The new home sales rate is now slightly below the pre-pandemic level of around 740 thousand (the three months previous to pandemic).
 Click on graph for larger image.
This graph shows new home sales for 2020 and 2021 by month (Seasonally Adjusted Annual Rate).
The year-over-year comparisons were easy in the first half of 2021 - especially in March and April.
However, sales will likely be down year-over-year for the remainder of 2021 - since the selling season was delayed in 2020.
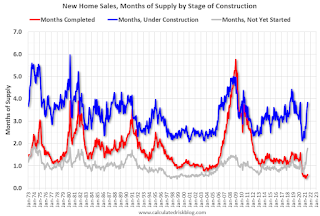
And on inventory: note that completed inventory (3rd graph in previous post) is near record lows, but inventory under construction is closer to normal.
 This graph shows the months of supply by stage of construction.
The inventory of completed homes for sale was at 36 thousand in July, just above the record low of 33 thousand in March, April and May 2021. That is about 0.6 months of completed supply (just above the record low).


