 RSS Feed
 by Calculated Risk on 9/03/2021 08:41:00 AM
Friday, September 03, 2021
August Employment Report: 235 Thousand Jobs, 5.2% Unemployment Rate
From the BLS:
Total nonfarm payroll employment rose by 235,000 in August, and the unemployment rate declined by 0.2 percentage point to 5.2 percent, the U.S. Bureau of Labor Statistics reported today. So far this year, monthly job growth has averaged 586,000. In August, notable job gains occurred in professional and business services, transportation and warehousing, private education, manufacturing, and other services. Employment in retail trade declined over the month.
...
The change in total nonfarm payroll employment for June was revised up by 24,000, from +938,000 to +962,000, and the change for July was revised up by 110,000, from +943,000 to +1,053,000. With these revisions, employment in June and July combined is 134,000 higher than previously reported.
emphasis added
 Click on graph for larger image.
The first graph shows the year-over-year change in total non-farm employment since 1968.
In August, the year-over-year change was 6.041 million jobs. This was up significantly year-over-year.
Total payrolls increased by 235 thousand in August. Private payrolls increased by 243 thousand.
Payrolls for June and July were revised up 134 thousand, combined.
 The second graph shows the job losses from the start of the employment recession, in percentage terms.
The current employment recession was by far the worst recession since WWII in percentage terms, but currently is not as severe as the worst of the "Great Recession".
The third graph shows the employment population ratio and the participation rate.
 The Labor Force Participation Rate was unchanged at 61.7% in August, from 61.7% in July. This is the percentage of the working age population in the labor force.
 The Employment-Population ratio increased to 58.5% from 58.4% (black line).
I'll post the 25 to 54 age group employment-population ratio graph later.
 The fourth graph shows the unemployment rate.
 The unemployment rate decreased in August to 5.2% from 5.4% in July.
This was well below consensus expectations, however June and July were revised up by 134,000 combined.
I'll have more later ...
Thursday, September 02, 2021
Friday: Employment Report
by Calculated Risk on 9/02/2021 09:00:00 PM
My August Employment Preview
A few brief excerpts from a note by Goldman Sachs economist Spencer Hill:
We estimate nonfarm payrolls rose 500k in August, below consensus of +725k. ... we expect the reopening of schools to boost job growth by around 150k in tomorrow’s report. ... We estimate a two-tenths drop in the unemployment rate to 5.2% ... reflecting a firm household employment gain and a stable participation rate.Friday:
emphasis added
• At 8:30 AM ET, Employment Report for August. The consensus is for 728 thousand jobs added, and for the unemployment rate to decrease to 5.2%.
• At 10:00 AM, ISM Services Index for August.
Real House Prices, Price-to-Rent Ratio and Price-to-Median Income in June
by Calculated Risk on 9/02/2021 03:48:00 PM
New newsletter article: Real House Prices, Price-to-Rent Ratio and Price-to-Median Income in June
I've started a newsletter focused solely on real estate. This newsletter will be ad free.
This newsletter will usually be published several times a week, and will provide more in-depth analysis of the housing market.
The blog will continue as always!
You can subscribe at https://calculatedrisk.substack.com/ (Currently all content is available for free, but please subscribe).
You can subscribe at https://calculatedrisk.substack.com/ (Currently all content is available for free, but please subscribe).
September 2nd COVID-19: New Cases Still Increasing, Deaths Averaging Over 1,000 per Day
by Calculated Risk on 9/02/2021 03:01:00 PM
The CDC is the source for all data.
According to the CDC, on Vaccinations. Total doses administered: 372,116,617, as of a week ago 365,767,674. Average doses last week: 0.91 million per day.
| COVID Metrics | ||||
|---|---|---|---|---|
| Today | Week Ago | Goal | ||
| Percent fully Vaccinated | 52.7% | 51.9% | ≥70.0%1 | |
| Fully Vaccinated (millions) | 175.0 | 172.2 | ≥2321 | |
| New Cases per Day3🚩 | 153,245 | 146,086 | ≤5,0002 | |
| Hospitalized3🚩 | 91,590 | 87,966 | ≤3,0002 | |
| Deaths per Day3🚩 | 1,046 | 1,009 | ≤502 | |
| 1 Minimum to achieve "herd immunity" (estimated between 70% and 85%). 2my goals to stop daily posts, 37 day average for Cases, Currently Hospitalized, and Deaths 🚩 Increasing 7 day average week-over-week for Cases, Hospitalized, and Deaths ✅ Goal met. | ||||
IMPORTANT: For "herd immunity" most experts believe we need 70% to 85% of the total population fully vaccinated (or already had COVID).
KUDOS to the residents of the 10 states that have achieved 60% of total population fully vaccinated: Vermont at 68.0%, Massachusetts, Maine, Connecticut, Rhode Island, Maryland. New Jersey, Washington, New York, New Mexico at 60.2%.
The following 14 states and D.C. have between 50% and 59.9% fully vaccinated: New Hampshire at 59.8%, Oregon, District of Columbia, Virginia, Colorado, Minnesota, California, Hawaii, Delaware, Pennsylvania, Wisconsin, Florida, Nebraska, Iowa, Illinois, and Michigan at 50.6%.
Next up (total population, fully vaccinated according to CDC) are South Dakota at 49.4%, Kentucky at 48.8%, Ohio at 48.5%, Kansas at 48.5%, Arizona at 48.1%, Nevada at 48.1%, Utah at 47.8%, Texas at 47.8% and Alaska at 47.4%.
 Click on graph for larger image.
This graph shows the daily (columns) and 7 day average (line) of positive tests reported.
August Employment Preview
by Calculated Risk on 9/02/2021 02:09:00 PM
On Friday at 8:30 AM ET, the BLS will release the employment report for August. The consensus is for 728 thousand jobs added, and for the unemployment rate to decrease to 5.2%.
 Click on graph for larger image.
• First, currently there are still about 5.7 million fewer jobs than in February 2020 (before the pandemic).
This graph shows the job losses from the start of the employment recession, in percentage terms.
The current employment recession was by far the worst recession since WWII in percentage terms, but is now better than the worst of the "Great Recession".
• ADP Report: The ADP employment report showed a gain of 374,000 private sector jobs, well below the consensus estimate of 638,000 jobs added. The ADP report hasn't been very useful in predicting the BLS report, but this suggests the BLS report could be below expectations.
• ISM Surveys: Note that the ISM services are diffusion indexes based on the number of firms hiring (not the number of hires). The ISM® manufacturing employment index decreased in August to 49.0%, down from 52.9% last month. This would suggest a decline in manufacturing employment of around 25,000 jobs in August. ADP showed 6,000 manufacturing jobs added.
The ISM® Services employment index will be released tomorrow.
• Unemployment Claims: The weekly claims report showed a decrease in the number of initial unemployment claims during the reference week (include the 12th of the month) from 424,000 in July to 349,000 in August. This would usually suggest fewer layoffs in August than in July, although this might not be very useful right now. In general, weekly claims have been close to expectations in August.
 • Permanent Job Losers: Something to watch in the employment report will be "Permanent job losers". While there has been a strong bounce back in total employment, from the shutdown in March and April 2020, permanent job losers hasn't increased as sharply.
This graph shows permanent job losers as a percent of the pre-recession peak in employment through the June report.
This data is only available back to 1994, so there is only data for three recessions. In July, the number of permanent job losers decreased to 2.930 million from 3.187 million in June. These jobs will likely be the hardest to recover.
• IMPORTANT: The employment report will probably show another increase in state and local government education hiring. Usually in August, about 250 thousand educators are hired as the school year starts in some areas. This year, it seems likely more educators will be hired in August, and this could boost overall employment by a couple hundred thousand in the August report.
• Conclusion: The data suggests a weaker than expected report in August. However, there are some seasonal factors that will boost the BLS report (especially related to education).
As far as the pandemic, the number of daily cases during the reference week in August was around 125,000, up sharply from around 24,000 in July. Although vaccinations continue to increase, this increase in cases is a negative for the job market.
So my guess is the report will be below the consensus.
Hotels: Occupancy Rate Down 8% Compared to Same Week in 2019
by Calculated Risk on 9/02/2021 12:22:00 PM
Note: The year-over-year occupancy comparisons are easy, since occupancy declined sharply at the onset of the pandemic. So STR is comparing to the same week in 2019.
The occupancy rate is down 8.4% compared to the same week in 2019.
U.S. hotel performance continued to decline from previous weeks, according to STR‘s latest data through August 28.The following graph shows the seasonal pattern for the hotel occupancy rate using the four week average.
August 22-28, 2021 (percentage change from comparable week in 2019*):
• Occupancy: 61.0% (-8.4%)
• Average daily rate (ADR): $131.91 (+3.2%)
• Revenue per available room (RevPAR): $80.53 (-5.5%)
Performance continues to reflect seasonality as well as the pandemic situation. Additionally, while data for August 27-28 showed a preliminary demand shift in the Gulf region, the impact of Hurricane Ida is expected to be more significant in future weeks of data.
...
*Due to the steep, pandemic-driven performance declines of 2020, STR is measuring recovery against comparable time periods from 2019.
emphasis added
 Click on graph for larger image.
The red line is for 2021, black is 2020, blue is the median, dashed purple is 2019, and dashed light blue is for 2009 (the worst year on record for hotels prior to 2020).
Occupancy is above the horrible 2009 levels and weekend occupancy (leisure) has been solid - but, according to STR, occupancy is declining due to both seasonal factors and the "pandemic situation".
Note: Y-axis doesn't start at zero to better show the seasonal change.
Note: Y-axis doesn't start at zero to better show the seasonal change.
With solid leisure travel, the Summer months had decent occupancy - but it is uncertain what will happen in the Fall with business travel - especially with the sharp increase in COVID pandemic cases and hospitalizations.
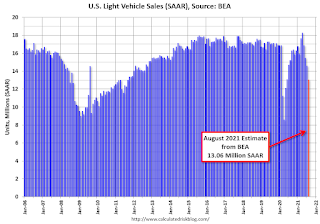
August Vehicles Sales Decreased to 13.06 Million SAAR
by Calculated Risk on 9/02/2021 10:26:00 AM
The BEA released their estimate of light vehicle sales for August this morning. The BEA estimates sales of 13.06 million SAAR in August 2021 (Seasonally Adjusted Annual Rate), down 10.7% from the July sales rate, and down 14.4% from August 2020.
This was well below the consensus estimate of 15.0 million SAAR.
 Click on graph for larger image.
This graph shows light vehicle sales since 2006 from the BEA (blue) and the BEA's estimate for August (red).
The impact of COVID-19 was significant, and April 2020 was the worst month.
After April 2020, sales increased, and were close to sales in 2019 (the year before the pandemic).
However, sales have decreased recently due to supply issues.
Sales-to-date are down 7.1% compared to the same period in 2019, and up 18.9% compared to the same period in 2020.
 The second graph shows light vehicle sales since the BEA started keeping data in 1967.
Note: dashed line is current estimated sales rate of 13.06 million SAAR.
Trade Deficit Decreased to $70.1 Billion in July
by Calculated Risk on 9/02/2021 08:46:00 AM
From the Department of Commerce reported:
The U.S. Census Bureau and the U.S. Bureau of Economic Analysis announced today that the goods and services deficit was $70.1 billion in July, down $3.2 billion from $73.2 billion in June, revised.
July exports were $212.8 billion, $2.8 billion more than June exports. July imports were $282.9 billion, $0.4 billion less than June imports.
emphasis added
 Click on graph for larger image.
Exports increased and imports decreased in July.
Exports are up 25% compared to July 2020; imports are up 22% compared to July 2020.
Both imports and exports decreased sharply due to COVID-19, and have now bounced back (imports more than exports),
The second graph shows the U.S. trade deficit, with and without petroleum.
 The blue line is the total deficit, and the black line is the petroleum deficit, and the red line is the trade deficit ex-petroleum products.
Note that net, imports and exports of petroleum products are close to zero.
The trade deficit with China decreased to $28.6 billion in July, from $31.6 billion in July 2020.
Weekly Initial Unemployment Claims decrease to 340,000
by Calculated Risk on 9/02/2021 08:35:00 AM
The DOL reported:
In the week ending August 28, the advance figure for seasonally adjusted initial claims was 340,000, a decrease of 14,000 from the previous week's revised level. This is the lowest level for initial claims since March 14, 2020 when it was 256,000. The previous week's level was revised up by 1,000 from 353,000 to 354,000. The 4-week moving average was 355,000, a decrease of 11,750 from the previous week's revised average. This is the lowest level for this average since March 14, 2020 when it was 225,500. The previous week's average was revised up by 250 from 366,500 to 366,750.This does not include the 102,405 initial claims for Pandemic Unemployment Assistance (PUA) that was down from 116,425 the previous week.
emphasis added
The following graph shows the 4-week moving average of weekly claims since 1971.
 Click on graph for larger image.
The dashed line on the graph is the current 4-week average. The four-week average of weekly unemployment claims decreased to 355,000.
The previous week was revised up.
Regular state continued claims decreased to 2,748,000 (SA) from 2,908,000 (SA) the previous week.
Note: There are an additional 5,413,238 receiving Pandemic Unemployment Assistance (PUA) that increased from 5,004,753 the previous week (there are questions about these numbers). This is a special program for business owners, self-employed, independent contractors or gig workers not receiving other unemployment insurance. And an additional 3,800,000 receiving Pandemic Emergency Unemployment Compensation (PEUC) up from 3,793,956.
Weekly claims were close to the consensus forecast.
Wednesday, September 01, 2021
Thursday: Vehicle sales decline sharply in August, Weekly Claims, Trade Balance
by Calculated Risk on 9/01/2021 06:44:00 PM
From Wards Auto: Dried-Up Inventory Sinks U.S. Light-Vehicle Sales in August(pay content). Vehicle sales fell to 13.1 million SAAR (consensus was 15.0 million SAAR)
Thursday:
• At 8:30 AM ET, The initial weekly unemployment claims report will be released. The consensus is for a decrease slightly to 350 thousand from 353 thousand last week.
• Also at 8:30 AM, Trade Balance report for July from the Census Bureau. The consensus is for the U.S. trade deficit to be at $70.9 billion in July, from $75.7 billion in June.


