by Calculated Risk on 9/06/2021 01:07:00 PM
Monday, September 06, 2021
Housing: A Look at "Affordability" Indexes
At the Calculated Risk Newsletter: Housing: A Look at "Affordability" Indexes
Note: I've started a newsletter focused solely on real estate. This newsletter is ad free.
• Expect House Prices to be up 20% YoY in July Report
• House Prices Increase Sharply in June
• Housing: Inventory is the Key Metric in 2021
• Forbearance, Delinquencies and Foreclosure: Will the end of the foreclosure moratorium, combined with the expiration of a large number of forbearance plans, lead to a surge in foreclosures and impact house prices, as happened following the housing bubble?
• How Much will the Fannie & Freddie Conforming Loan Limit Increase for 2022?
• New Home Sales Increase to 708,000 Annual Rate in July
• Existing-Home Sales Increased to 5.99 million in July
• Housing Starts decreased to 1.534 Million Annual Rate in July
• Housing and Demographics: The Next Big Shift
This will usually be published several times a week, and will provide more in-depth analysis of the housing market.
You can subscribe at https://calculatedrisk.substack.com/ (Currently all content is available for free, but please subscribe).
Housing Inventory Sept 6th Update: Inventory Up 1.4% Week-over-week, Up 43% from Low in early April
by Calculated Risk on 9/06/2021 08:51:00 AM
Tracking existing home inventory will be very important this year.

This inventory graph is courtesy of Altos Research.
Mike Simonsen discusses this data regularly on Youtube.
Sunday, September 05, 2021
Denver Real Estate in August: Sales Down 15% YoY, Active Inventory Down 35% YoY
by Calculated Risk on 9/05/2021 11:10:00 AM
Note: I'm tracking data for many local markets around the U.S. I think it is especially important to watch inventory this year.
Keeping in trend with traditional seasonality, the transition from July to August felt like a shift as vacations slowed down in preparation for the school year and fall. Buyers are more willing to be patient in order to find the right house for the “right” price. The report saw this reflected in the days in MLS, which increased from nine to 11 in August 2021. Likewise, the close-price-to-list-price ratio dipped ever so slightly month-over-month. In a dramatic data point, the month-end active inventory dropped 11.69 percent. Historically speaking, the change in inventory is relatively consistent from July to August.Active inventory in Denver is up 87% from the record low in March 2021.
However, with both inventory and new listings decreasing, the short-lived “loose grip” on inventory has tightened once again. Months of inventory decreased from the previous month to 0.637. The report also indicated that if no one were to put a property on the market for 19 days, there would be nothing to sell in the entire Denver Metro area.
emphasis added
Saturday, September 04, 2021
The Employment Situation is Worse than the Unemployment Rate Indicates
by Calculated Risk on 9/04/2021 05:35:00 PM
The headline unemployment rate of 5.2% significantly understates the current situation.
Then I calculated the unemployment rate by including the number of people that have left the labor force since early 2020, and the expected growth in the labor force.
| Unemployment Rate | Unemployed (000s) | Left Labor Force (000s) | Expected Labor Force Growth (000s) | Adjusted Unemployment Rate | |
|---|---|---|---|---|---|
| Feb-20 | 3.5% | 5,717 | 0 | 0 | 3.5% |
| Mar-20 | 4.4% | 7,185 | -1,727 | 100 | 5.5% |
| Apr-20 | 14.8% | 23,109 | -7,970 | 200 | 19.0% |
| May-20 | 13.3% | 20,975 | -6,248 | 300 | 16.7% |
| Jun-20 | 11.1% | 17,697 | -4,651 | 400 | 13.8% |
| Jul-20 | 10.2% | 16,308 | -4,363 | 500 | 12.8% |
| Aug-20 | 8.4% | 13,542 | -3,630 | 600 | 10.8% |
| Sep-20 | 7.8% | 12,535 | -4,370 | 700 | 10.7% |
| Oct-20 | 6.9% | 11,049 | -3,730 | 800 | 9.4% |
| Nov-20 | 6.7% | 10,728 | -3,912 | 900 | 9.4% |
| Dec-20 | 6.7% | 10,736 | -3,881 | 1,000 | 9.4% |
| Jan-21 | 6.3% | 10,130 | -4,287 | 1,100 | 9.4% |
| Feb-21 | 6.2% | 9,972 | -4,237 | 1,200 | 9.3% |
| Mar-21 | 6.0% | 9,710 | -3,890 | 1,300 | 9.0% |
| Apr-21 | 6.1% | 9,812 | -3,460 | 1,400 | 8.8% |
| May-21 | 5.8% | 9,316 | -3,513 | 1,500 | 8.6% |
| Jun-21 | 5.9% | 9,484 | -3,362 | 1,600 | 8.7% |
| Jul-21 | 5.4% | 8,702 | -3,101 | 1,700 | 8.1% |
| Aug-21 | 5.2% | 8,384 | -2,911 | 1,800 | 7.9% |
As the economy recovers, many of the people that left the labor force will probably return, and there will likely be more entrants into the labor force (although recent demographic data has been dismal).
Schedule for Week of September 5, 2021
by Calculated Risk on 9/04/2021 08:11:00 AM
This will be a light week for economic data.
All US markets will be closed in observance of the Labor Day holiday.
8:00 AM ET: Corelogic House Price index for July
7:00 AM ET: The Mortgage Bankers Association (MBA) will release the results for the mortgage purchase applications index.
 10:00 AM ET: Job Openings and Labor Turnover Survey for July from the BLS.
 This graph shows job openings (yellow line), hires (purple), Layoff, Discharges and other (red column), and Quits (light blue column) from the JOLTS.
Jobs openings increased in June to 10.073 million from 9.483 million in May. This was a new record high for this series.
The number of job openings (yellow) were up 65% year-over-year, and Quits were up 46% year-over-year.
2:00 PM: the Federal Reserve Beige Book, an informal review by the Federal Reserve Banks of current economic conditions in their Districts.
8:30 AM: The initial weekly unemployment claims report will be released. There were 340 thousand initial claims last week.
8:30 AM: The Producer Price Index for August from the BLS. The consensus is for a 0.6% increase in PPI, and a 0.6% increase in core PPI.
Friday, September 03, 2021
CalculatedRisk Newsletter
by Calculated Risk on 9/03/2021 04:39:00 PM
I've started a newsletter focused solely on real estate. This newsletter is ad free.
• Expect House Prices to be up 20% YoY in July Report
• House Prices Increase Sharply in June
• Housing: Inventory is the Key Metric in 2021
• Forbearance, Delinquencies and Foreclosure: Will the end of the foreclosure moratorium, combined with the expiration of a large number of forbearance plans, lead to a surge in foreclosures and impact house prices, as happened following the housing bubble?
• How Much will the Fannie & Freddie Conforming Loan Limit Increase for 2022?
• New Home Sales Increase to 708,000 Annual Rate in July
• Existing-Home Sales Increased to 5.99 million in July
• Housing Starts decreased to 1.534 Million Annual Rate in July
• Housing and Demographics: The Next Big Shift
This will usually be published several times a week, and will provide more in-depth analysis of the housing market.
You can subscribe at https://calculatedrisk.substack.com/ (Currently all content is available for free, but please subscribe).
September 3rd COVID-19: Vaccination Rate has Increased, Over 1,500 Deaths Reported Today
by Calculated Risk on 9/03/2021 04:00:00 PM
NOTE: There will be no weekend updates on COVID.
| COVID Metrics | ||||
|---|---|---|---|---|
| Today | Week Ago | Goal | ||
| Percent fully Vaccinated | 52.9% | 52.0% | ≥70.0%1 | |
| Fully Vaccinated (millions) | 175.5 | 172.6 | ≥2321 | |
| New Cases per Day3🚩 | 152,546 | 148,564 | ≤5,0002 | |
| Hospitalized3🚩 | 91,674 | 88,858 | ≤3,0002 | |
| Deaths per Day3🚩 | 1,094 | 1,038 | ≤502 | |
| 1 Minimum to achieve "herd immunity" (estimated between 70% and 85%). 2my goals to stop daily posts, 37 day average for Cases, Currently Hospitalized, and Deaths 🚩 Increasing 7 day average week-over-week for Cases, Hospitalized, and Deaths ✅ Goal met. | ||||
IMPORTANT: For "herd immunity" most experts believe we need 70% to 85% of the total population fully vaccinated (or already had COVID).
The following 13 states and D.C. have between 50% and 59.9% fully vaccinated: Oregon at 58.4%, District of Columbia, Virginia, Colorado, Minnesota, California, Hawaii, Delaware, Pennsylvania, Wisconsin, Florida, Nebraska, Iowa, Illinois, and Michigan at 50.7%.
Next up (total population, fully vaccinated according to CDC) are South Dakota at 49.5%, Kentucky at 49.0%, Arizona at 48.9%, Ohio at 48.6%, Kansas at 48.6%, Nevada at 48.2%, Utah at 47.9%, Texas at 47.9% and Alaska at 47.4%.
 Click on graph for larger image.
This graph shows the daily (columns) and 7 day average (line) of positive tests reported.
AAR: August Rail Carloads and Intermodal Down Compared to 2019
by Calculated Risk on 9/03/2021 02:11:00 PM
From the Association of American Railroads (AAR) Rail Time Indicators. Graphs and excerpts reprinted with permission.
Intermodal is navigating many of the same challenges that have plagued global supply chains for months, such as shutdowns at ports and manufacturing centers in Asia; port congestion; labor and capacity shortages at docks, warehouses, and drayage firms; container and chassis shortages; natural and man-made disasters (e.g., wildfires, hurricanes, and ships getting stuck in canals). Pressures are intensifying as retailers, many of whom already have much lower inventories than they’d like, are trying to stock up for the upcoming holiday season. At this point, no one knows if things will get worse before they get better, and if they do get worse, how much worse they will get.
emphasis added
 Click on graph for larger image.
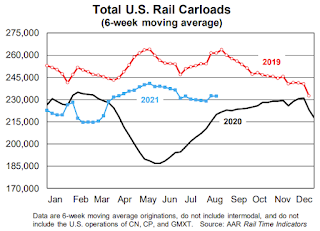
This graph from the Rail Time Indicators report shows the six week average of U.S. Carloads in 2019, 2020 and 2021:
Total originated carloads on U.S. railroads in August 2021 were 934,762, up 4.1% (36,815 carloads) over August 2020 and down 11.4% (120,262 carloads) from August 2019. The 4.1% year-over-year gain in August 2021 was the smallest year-over-year gain since March 2021. Total carloads averaged 233,691 per week in August 2021. Except for August 2020, that’s the lowest weekly average for total carloads for an August in our records that begin in 1988.
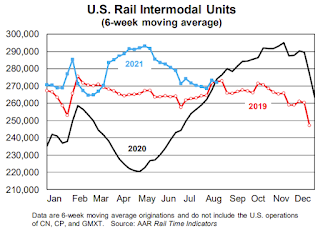
 The second graph shows the six week average (not monthly) of U.S. intermodal in 2019, 2020 and 2021: (using intermodal or shipping containers):
U.S. intermodal originations, which are not included in carloads, were 3.3% lower in August 2021 than August 2020 and 0.4% lower than August 2019. That’s their first year-over-year decline in 13 months. Intermodal originations averaged 271,336 containers and trailers per week in August 2021, the third lowest of the eight months so far in 2021. In the 21 years from 2000 to 2020, August was a top-three intermodal month 16 times. That’s obviously won’t happen this year.
Black Knight: Number of Homeowners in COVID-19-Related Forbearance Plans Decreased
by Calculated Risk on 9/03/2021 11:24:00 AM
Note: Both Black Knight and the MBA (Mortgage Bankers Association) are putting out weekly estimates of mortgages in forbearance.
This data is as of August 31st.
From Andy Walden at Black Knight: Forbearances Tick Down, With All Eyes on September Exits
The final week of August brought a 53,000 decline in the number of active forbearance plans, driven by a 23,000 reduction in plans among FHA/VA loans. Plan volumes also improved from the week prior among both GSE (-20,000) and portfolio/PLS (-10,000) loans.
According to Black Knight’s McDash Flash forbearance tracker, as of August 31, 1.71 million borrowers remain in COVID-19 related forbearance plans, including 1.8% of GSE, 5.6% of FHA/VA and 4.0% of portfolio held and privately securitized mortgages.
This puts plan volumes down nearly 9% (-168,000) from the same time last month as the market braces for the large wave of final plan expirations taking place in September. Of the 629,000 plans slated to be reviewed for extension/removal this month, nearly 400,000 are set to reach their final plan expirations based on current allowable forbearance term lengths.
Click on graph for larger image.
Significant volume declines could be seen in coming weeks as those plans reach their final expirations and exiting borrowers return to making mortgage payments in October.
emphasis added
Comments on August Employment Report
by Calculated Risk on 9/03/2021 09:21:00 AM
The headline jobs number in the August employment report was well below expectations, however employment for the previous two months was revised up significantly. The participation rate was unchanged and the unemployment rate decreased to 5.2%.
Earlier: August Employment Report: 235 Thousand Jobs, 5.2% Unemployment Rate
In August, the year-over-year employment change was 6.041 million jobs. This turned positive in April due to the sharp jobs losses in April 2020.
Permanent Job Losers
 Click on graph for larger image.
This graph shows permanent job losers as a percent of the pre-recession peak in employment through the report today. (ht Joe Weisenthal at Bloomberg).
In August, the number of permanent job losers decreased to 2.487 million from 2.930 million in July.
Prime (25 to 54 Years Old) Participation
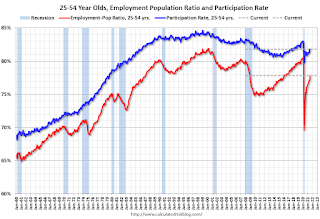
 Since the overall participation rate has declined due to cyclical (recession) and demographic (aging population, younger people staying in school) reasons, here is the employment-population ratio for the key working age group: 25 to 54 years old.
The prime working age will be key as the economy recovers.
The 25 to 54 participation rate was unchanged in August at 81.8% from 81.8% in July, and the 25 to 54 employment population ratio increased to 78.0% from 77.8% in July.
Part Time for Economic Reasons
 From the BLS report:
"In August, the number of persons employed part time for economic reasons, at 4.5 million, was essentially unchanged. There were 4.4 million persons in this category in February 2020. These individuals, who would have preferred full-time employment, were working part time because their hours had been reduced or they were unable to find full-time jobs."The number of persons working part time for economic reasons decreased in August to 4.469 million from 4.483 million in July. This is back close to pre-recession levels.
These workers are included in the alternate measure of labor underutilization (U-6) that decreased to 8.8% from 9.2% in July. This is down from the record high in April 22.9% for this measure since 1994. This measure was at 7.0% in February 2020 (pre-pandemic).
Unemployed over 26 Weeks
 This graph shows the number of workers unemployed for 27 weeks or more.
 According to the BLS, there are 3.179 million workers who have been unemployed for more than 26 weeks and still want a job, down from 3.425 million in July.
This does not include all the people that left the labor force. This will be a key measure to follow during the recovery.
Summary:
The headline monthly jobs number was well below expectations, however the previous two months were revised up by 134,000 combined. And the headline unemployment rate decreased to 5.2%.


