by Calculated Risk on 10/20/2021 11:22:00 AM
Wednesday, October 20, 2021
AIA: "Demand for design services continues to increase" in September
Note: This index is a leading indicator primarily for new Commercial Real Estate (CRE) investment.
From the AIA: Demand for design services continues to increase
Architecture firms continue to report increasing demand for design services in September, according to a new report today from The American Institute of Architects (AIA).
The Architecture Billings Index (ABI) score for September was 56.6, which is up from August’s score of 55.6. Any score above 50 indicates an increase in billings from the prior month. During September, scoring for both the new project inquiries and design contracts moderated slightly, but remained in positive territory, posting scores of 61.8 and 54.7 respectively.
“The ABI scores over the last eight months continue to be among the highest ever seen in the immediate post-recession periods that have been captured throughout the index’s history,” said AIA Chief Economist, Kermit Baker, Hon. AIA, PhD. “However, it’s unlikely that revenue increases at architecture firms can sustain this pace. Given that growth in both new design contracts and project inquiries have moderated in recent months, we expect to see a similar path for the ABI.”
...
• Regional averages: Midwest (57.7); South (57.0); West (56.0); Northeast (51.5)
• Sector index breakdown: mixed practice (58.8); commercial/industrial (58.1); multi-family residential (56.1); institutional (53.5)
emphasis added
 Click on graph for larger image.
This graph shows the Architecture Billings Index since 1996. The index was at 56.6 in September, up from 55.6 in August. Anything above 50 indicates expansion in demand for architects' services.
Note: This includes commercial and industrial facilities like hotels and office buildings, multi-family residential, as well as schools, hospitals and other institutions.
This index had been below 50 for eleven consecutive months, but has been solidly positive for the last eight months.
MBA: Mortgage Applications Decrease in Latest Weekly Survey
by Calculated Risk on 10/20/2021 07:00:00 AM
From the MBA: Mortgage Applications Decrease in Latest MBA Weekly Survey
Mortgage applications decreased 6.3 percent from one week earlier, according to data from the Mortgage Bankers Association’s (MBA) Weekly Mortgage Applications Survey for the week ending October 15, 2021.
... The Refinance Index decreased 7 percent from the previous week and was 22 percent lower than the same week one year ago. The seasonally adjusted Purchase Index decreased 5 percent from one week earlier. The unadjusted Purchase Index decreased 5 percent compared with the previous week and was 12 percent lower than the same week one year ago.
“Refinance applications declined for the fourth week as rates increased, bringing the refinance index to its lowest level since July 2021. The 30-year fixed rate has increased 20 basis points over the past month and reached 3.23 percent last week – the highest since April 2021. The 15-year fixed rate increased to 2.54 percent, which is the highest since July,” said Joel Kan, MBA’s Associate Vice President of Economic and Industry Forecasting. “Purchase activity declined and was 12 percent lower than a year ago, within the annual comparison range that it has been over the past six weeks. Insufficient housing supply and elevated home-price growth continue to limit options for would-be buyers.”
...
The average contract interest rate for 30-year fixed-rate mortgages with conforming loan balances ($548,250 or less) increased to 3.23 percent from 3.18 percent, with points decreasing to 0.35 from 0.37 (including the origination fee) for 80 percent loan-to-value ratio (LTV) loans.
emphasis added
 Click on graph for larger image.
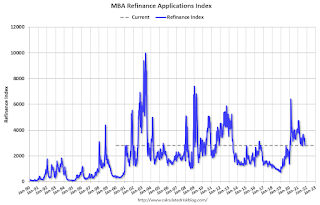
The first graph shows the refinance index since 1990.
With relatively low rates, the index remains somewhat elevated - but the recent bump in rates has slowed activity.
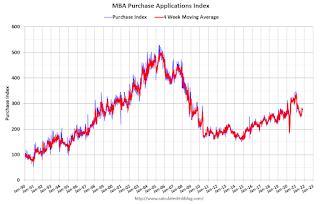
The second graph shows the MBA mortgage purchase index
 According to the MBA, purchase activity is down 12% year-over-year unadjusted.
Note: The year ago comparisons for the unadjusted purchase index are now difficult since purchase activity was strong in the second half of 2020.
Note: Red is a four-week average (blue is weekly).
Tuesday, October 19, 2021
Wednesday: Beige Book, Architecture Billings Index
by Calculated Risk on 10/19/2021 09:00:00 PM
Wednesday:
• At 7:00 AM ET, The Mortgage Bankers Association (MBA) will release the results for the mortgage purchase applications index.
• During the day, The AIA's Architecture Billings Index for September (a leading indicator for commercial real estate).
• At 2:00 PM, the Federal Reserve Beige Book, an informal review by the Federal Reserve Banks of current economic conditions in their Districts.
October 19th COVID-19: 37 Days till Thanksgiving; Need to Get Daily Cases Down Before Holidays
by Calculated Risk on 10/19/2021 06:17:00 PM
| COVID Metrics | ||||
|---|---|---|---|---|
| Today | Week Ago | Goal | ||
| Percent fully Vaccinated | 57.0% | 56.5% | ≥70.0%1 | |
| Fully Vaccinated (millions) | 189.3 | 187.7 | ≥2321 | |
| New Cases per Day3 | 75,571 | 89,957 | ≤5,0002 | |
| Hospitalized3 | 52,146 | 59,038 | ≤3,0002 | |
| Deaths per Day3 | 1,260 | 1,298 | ≤502 | |
| 1 Minimum to achieve "herd immunity" (estimated between 70% and 85%). 2my goals to stop daily posts, 37 day average for Cases, Currently Hospitalized, and Deaths 🚩 Increasing 7 day average week-over-week for Cases, Hospitalized, and Deaths ✅ Goal met. | ||||
IMPORTANT: For "herd immunity" most experts believe we need 70% to 85% of the total population fully vaccinated (or already had COVID).
The following 20 states have between 50% and 59.9% fully vaccinated: Pennsylvania at 59.6%, Minnesota, Hawaii, Delaware, Florida, Wisconsin, Nebraska, Iowa, Illinois, Michigan, Kentucky, South Dakota, Texas, Arizona, Kansas, Nevada, Alaska, Utah, North Carolina and Ohio at 51.3%.
Next up (total population, fully vaccinated according to CDC) are Montana at 49.7%, Indiana at 49.3%, Missouri at 49.1%, Oklahoma at 49.1% and South Carolina at 49.1%.
 Click on graph for larger image.
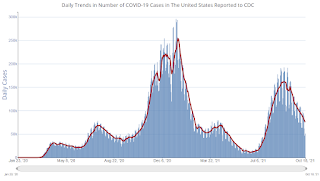
This graph shows the daily (columns) and 7 day average (line) of positive tests reported.
Lawler: Early Read on Existing Home Sales in September
by Calculated Risk on 10/19/2021 03:20:00 PM
From housing economist Tom Lawler:
Based on publicly-available local realtor/MLS reports released across the country through today, I project that existing home sales as estimated by the National Association of Realtors ran at a seasonally adjusted annual rate of 6.2 million in September, up 5.4% from August’s preliminary pace but down 3.7% from last September’s seasonally adjusted pace
Local realtor reports, as well as reports from national inventory trackers, suggest that the YOY % decline in the inventory of existing homes for sale last month was similar to that in August.
Finally, local realtor/MLS reports suggest the median existing single-family home sales price last month was up by about 12.6% from last September.

Most Housing Units Under Construction Since 1974
by Calculated Risk on 10/19/2021 11:46:00 AM
Today, in the Newsletter: Most Housing Units Under Construction Since 1974
Excerpt:
Census will release data next year on the length of time from start to completion, and that will probably show long delays in 2021. In 2020, it took an average of 6.8 months from start to completion for single family homes, and 15.4 months for buildings with 2 or more units.
Combined, there are 1.426 million units under construction. This is the most since 1974.

Housing Starts Decreased to 1.555 Million Annual Rate in September
by Calculated Risk on 10/19/2021 08:41:00 AM
From the Census Bureau: Permits, Starts and Completions
Housing Starts:
Privately‐owned housing starts in September were at a seasonally adjusted annual rate of 1,555,000. This is 1.6 percent below the revised August estimate of 1,580,000, but is 7.4 percent above the September 2020 rate of 1,448,000. Single‐family housing starts in September were at a rate of 1,080,000; this is virtually unchanged from the revised August figure of 1,080,000. The September rate for units in buildings with five units or more was 467,000.
Building Permits:
Privately‐owned housing units authorized by building permits in September were at a seasonally adjusted annual rate of 1,589,000. This is 7.7 percent below the revised August rate of 1,721,000, but is virtually unchanged from the September 2020 rate of 1,589,000. Single‐family authorizations in September were at a rate of 1,041,000; this is 0.9 percent below the revised August figure of 1,050,000. Authorizations of units in buildings with five units or more were at a rate of 498,000 in September
emphasis added
 Click on graph for larger image.
The first graph shows single and multi-family housing starts for the last several years.
Multi-family starts (blue, 2+ units) decreased in September compared to August. Multi-family starts were up 38% year-over-year in September.
Single-family starts (red) were unchanged in September, and were down 2% year-over-year.
 The second graph shows single and multi-family housing starts since 1968.
 This shows the huge collapse following the housing bubble, and then the eventual recovery (but still not historically high).
Total housing starts in September were below expectations, and starts in July and August were revised down, combined.
I'll have more later …
Monday, October 18, 2021
Tuesday: Housing Starts
by Calculated Risk on 10/18/2021 07:47:00 PM
From Matthew Graham at Mortgage News Daily: Highest Rates in Months
Mortgage rates had a mixed showing last week. They started out high before improving through Thursday. Finally, they took a step back up on Friday. Now at the start of the new week, the upward momentum is continuing. [30 year fixed 3.21%]Tuesday:
emphasis added
• At 8:30 AM ET, Housing Starts for September. The consensus is for 1.620 million SAAR, up from 1.615 million SAAR.
4th Look at Local Housing Markets in September; Adding Austin, California, Des Moines, Houston and Maryland
by Calculated Risk on 10/18/2021 05:22:00 PM
Today, in the Newsletter: 4th Look at Local Housing Markets in September
Excerpt:
Inventory in San Diego is at an all time low, whereas inventory in Denver and Sacramento is up more than double from the all time low earlier this year.
Austin and Sacramento are two of the few areas with inventory up YoY. The C.A.R. reported today that inventory in 40% of the markets in California are either unchanged or up year-over-year. This is a change.
MBA Survey: "Share of Mortgage Loans in Forbearance Decreases to 2.28%"
by Calculated Risk on 10/18/2021 04:00:00 PM
Note: This is as of October 10th.
From the MBA: Share of Mortgage Loans in Forbearance Decreases to 2.28%
The Mortgage Bankers Association’s (MBA) latest Forbearance and Call Volume Survey revealed that the total number of loans now in forbearance decreased by 34 basis points from 2.62% of servicers’ portfolio volume in the prior week to 2.28% as of October 10, 2021. According to MBA’s estimate, 1.1 million homeowners are in forbearance plans.
The share of Fannie Mae and Freddie Mac loans in forbearance decreased 16 basis points to 1.05%. Ginnie Mae loans in forbearance decreased 17 basis points to 2.77%, and the forbearance share for portfolio loans and private-label securities (PLS) declined 108 basis points to 5.34%. The percentage of loans in forbearance for independent mortgage bank (IMB) servicers decreased 25 basis points relative to the prior week to 2.57%, and the percentage of loans in forbearance for depository servicers decreased 53 basis points to 2.16%.
“Forbearance exits continued at an even more robust pace, resulting in a 34 basis-point decline in the overall forbearance rate. The decline was apparent across all servicer types and investor types,” said Mike Fratantoni, MBA’s Senior Vice President and Chief Economist. “There was a substantial drop of over 1 percentage point in the forbearance rate for portfolio and PLS loans, which includes loans held for investment purposes, loans serviced for private investors, and government loans that were bought out of Ginnie Mae pools for the purposes of modifying them and then re-securitizing them into Ginnie Mae pools.”
Added Fratantoni, “We are now down to 1.1 million homeowners in forbearance from a peak of 4.3 million homeowners in June 2020. Positive employment and wage prospects, continued home-price appreciation, and the availability of multiple loan workout options are factors that will smooth many homeowners’ transition out of forbearance.”
emphasis added
 Click on graph for larger image.
This graph shows the percent of portfolio in forbearance by investor type over time. Most of the increase was in late March and early April 2020, and has trended down since then.
The MBA notes: "Total weekly forbearance requests as a percent of servicing portfolio volume (#) decreased relative to the prior week: from 0.05% to 0.04%."


