by Calculated Risk on 10/21/2021 08:34:00 AM
Thursday, October 21, 2021
Weekly Initial Unemployment Claims Decrease to 290,000
The DOL reported:
In the week ending October 16, the advance figure for seasonally adjusted initial claims was 290,000, a decrease of 6,000 from the previous week's revised level. This is the lowest level for initial claims since March 14, 2020 when it was 256,000. The previous week's level was revised up by 3,000 from 293,000 to 296,000. The 4-week moving average was 319,750, a decrease of 15,250 from the previous week's revised average. This is the lowest level for this average since March 14, 2020 when it was 225,500. The previous week's average was revised up by 750 from 334,250 to 335,000.The following graph shows the 4-week moving average of weekly claims since 1971.
emphasis added
 Click on graph for larger image.
The dashed line on the graph is the current 4-week average. The four-week average of weekly unemployment claims decreased to 319,750.
The previous week was revised up.
Regular state continued claims decreased to 2,481,000 (SA) from 2,603,000 (SA) the previous week.
Weekly claims were at the consensus forecast.
Wednesday, October 20, 2021
Thursday: Unemployment Claims, Phily Fed Mfg, Existing Home Sales
by Calculated Risk on 10/20/2021 09:01:00 PM
Thursday:
• At 8:30 AM ET, The initial weekly unemployment claims report will be released. The consensus is for 290 thousand initial claims, down from 293 thousand last week.
• Also at 8:30 AM, the Philly Fed manufacturing survey for October. The consensus is for a reading of 24.5, down from 30.7.
• At 10:00 AM, Existing Home Sales for September from the National Association of Realtors (NAR). The consensus is for 6.06 million SAAR, up from 5.88 million in August.
'Some prospective buyers took a break'
by Calculated Risk on 10/20/2021 05:28:00 PM
Today, in the Newsletter: 'Some prospective buyers took a break'
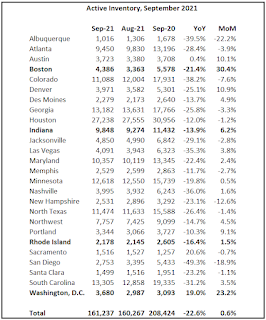
Existing Home Sales forecast, and adding Boston, Indiana, Rhode Island, and Washington D.C. September Data
Excerpt:
From the Rhode Island Association of Realtors®“The single-family home market has been incredibly competitive and the properties that are available for sale are put under contract so quickly, that it appears some prospective buyers took a break. Also, the spread of the delta variant affected the market last quarter, keeping some buyers at home and making some prospective sellers think twice about listing their home,” said Leann D’Ettore, President of the Rhode Island Association of Realtors.
emphasis added

October 20th COVID-19: 3 States Now at or Above 70% of Total Population Vaccinated
by Calculated Risk on 10/20/2021 03:58:00 PM
| COVID Metrics | ||||
|---|---|---|---|---|
| Today | Week Ago | Goal | ||
| Percent fully Vaccinated | 57.1% | 56.6% | ≥70.0%1 | |
| Fully Vaccinated (millions) | 189.5 | 187.9 | ≥2321 | |
| New Cases per Day3 | 75,988 | 87,507 | ≤5,0002 | |
| Hospitalized3 | 51,698 | 57,977 | ≤3,0002 | |
| Deaths per Day3 | 1,256 | 1,297 | ≤502 | |
| 1 Minimum to achieve "herd immunity" (estimated between 70% and 85%). 2my goals to stop daily posts, 37 day average for Cases, Currently Hospitalized, and Deaths 🚩 Increasing 7 day average week-over-week for Cases, Hospitalized, and Deaths ✅ Goal met. | ||||
IMPORTANT: For "herd immunity" most experts believe we need 70% to 85% of the total population fully vaccinated (or already had COVID).
The following 20 states have between 50% and 59.9% fully vaccinated: Pennsylvania at 59.6%, Minnesota, Hawaii, Delaware, Florida, Wisconsin, Nebraska, Iowa, Illinois, Michigan, Kentucky, South Dakota, Texas, Arizona, Kansas, Nevada, Alaska, Utah, North Carolina and Ohio at 51.3%.
Next up (total population, fully vaccinated according to CDC) are Montana at 49.8%, Indiana at 49.4%, Missouri at 49.1%, Oklahoma at 49.1% and South Carolina at 49.1%.
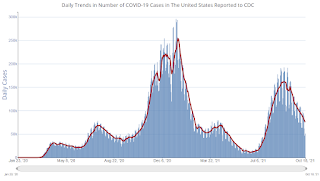
 Click on graph for larger image.
This graph shows the daily (columns) and 7 day average (line) of positive tests reported.
Fed's Beige Book: "Residential real estate activity was unchanged or slowed slightly"
by Calculated Risk on 10/20/2021 02:03:00 PM
Fed's Beige Book "This report was prepared at the Federal Reserve Bank of Richmond based on information collected on or before October 8th, 2020. "
Economic activity grew at a modest to moderate rate, according to the majority of Federal Reserve Districts. Several Districts noted, however, that the pace of growth slowed this period, constrained by supply chain disruptions, labor shortages, and uncertainty around the Delta variant of COVID-19. A majority of Districts indicated positive growth in consumer spending; however, auto sales were widely reported as declining due to low inventory levels and rising prices. Travel and tourism activity varied by District with some seeing continued or strengthening leisure travel while others saw declines that coincided with rises in COVID cases and the start of the school year. Manufacturing grew moderately to robustly in most parts of the country, as did trucking and freight. Growth in nonmanufacturing activity ranged from slight to moderate for most Districts. Loan demand was generally reported as flat to modest this period. Residential real estate activity was unchanged or slowed slightly but the market remained healthy, overall. Reports on nonresidential real estate varied across Districts and market segments. Agriculture conditions were mixed and energy markets were little changed, on balance. Outlooks for near-term economic activity remained positive, overall, but some Districts noted increased uncertainty and more cautious optimism than in previous months.
...
Employment increased at a modest to moderate rate in recent weeks, as demand for workers was high, but labor growth was dampened by a low supply of workers. Transportation and technology firms saw particularly low labor supply, while many retail, hospitality, and manufacturing firms cut hours or production because they did not have enough workers. Firms reported high turnover, as workers left for other jobs or retired. Child-care issues and vaccine mandates were widely cited as contributing to the problem, along with COVID-related absences. Many firms offered increased training to expand the candidate pool. In some cases, firms increased automation to help offset labor shortages. The majority of Districts reported robust wage growth. Firms reported increasing starting wages to attract talent and increasing wages for existing workers to retain them. Many also offered signing and retention bonuses, flexible work schedules, or increased vacation time to incentivize workers to remain in their positions.
emphasis added
AIA: "Demand for design services continues to increase" in September
by Calculated Risk on 10/20/2021 11:22:00 AM
Note: This index is a leading indicator primarily for new Commercial Real Estate (CRE) investment.
From the AIA: Demand for design services continues to increase
Architecture firms continue to report increasing demand for design services in September, according to a new report today from The American Institute of Architects (AIA).
The Architecture Billings Index (ABI) score for September was 56.6, which is up from August’s score of 55.6. Any score above 50 indicates an increase in billings from the prior month. During September, scoring for both the new project inquiries and design contracts moderated slightly, but remained in positive territory, posting scores of 61.8 and 54.7 respectively.
“The ABI scores over the last eight months continue to be among the highest ever seen in the immediate post-recession periods that have been captured throughout the index’s history,” said AIA Chief Economist, Kermit Baker, Hon. AIA, PhD. “However, it’s unlikely that revenue increases at architecture firms can sustain this pace. Given that growth in both new design contracts and project inquiries have moderated in recent months, we expect to see a similar path for the ABI.”
...
• Regional averages: Midwest (57.7); South (57.0); West (56.0); Northeast (51.5)
• Sector index breakdown: mixed practice (58.8); commercial/industrial (58.1); multi-family residential (56.1); institutional (53.5)
emphasis added
 Click on graph for larger image.
This graph shows the Architecture Billings Index since 1996. The index was at 56.6 in September, up from 55.6 in August. Anything above 50 indicates expansion in demand for architects' services.
Note: This includes commercial and industrial facilities like hotels and office buildings, multi-family residential, as well as schools, hospitals and other institutions.
This index had been below 50 for eleven consecutive months, but has been solidly positive for the last eight months.
MBA: Mortgage Applications Decrease in Latest Weekly Survey
by Calculated Risk on 10/20/2021 07:00:00 AM
From the MBA: Mortgage Applications Decrease in Latest MBA Weekly Survey
Mortgage applications decreased 6.3 percent from one week earlier, according to data from the Mortgage Bankers Association’s (MBA) Weekly Mortgage Applications Survey for the week ending October 15, 2021.
... The Refinance Index decreased 7 percent from the previous week and was 22 percent lower than the same week one year ago. The seasonally adjusted Purchase Index decreased 5 percent from one week earlier. The unadjusted Purchase Index decreased 5 percent compared with the previous week and was 12 percent lower than the same week one year ago.
“Refinance applications declined for the fourth week as rates increased, bringing the refinance index to its lowest level since July 2021. The 30-year fixed rate has increased 20 basis points over the past month and reached 3.23 percent last week – the highest since April 2021. The 15-year fixed rate increased to 2.54 percent, which is the highest since July,” said Joel Kan, MBA’s Associate Vice President of Economic and Industry Forecasting. “Purchase activity declined and was 12 percent lower than a year ago, within the annual comparison range that it has been over the past six weeks. Insufficient housing supply and elevated home-price growth continue to limit options for would-be buyers.”
...
The average contract interest rate for 30-year fixed-rate mortgages with conforming loan balances ($548,250 or less) increased to 3.23 percent from 3.18 percent, with points decreasing to 0.35 from 0.37 (including the origination fee) for 80 percent loan-to-value ratio (LTV) loans.
emphasis added
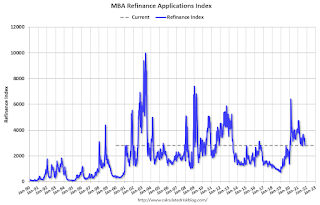
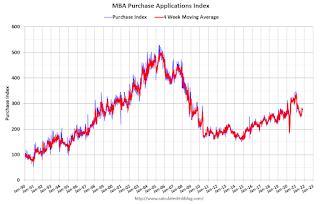
 Click on graph for larger image.
The first graph shows the refinance index since 1990.
With relatively low rates, the index remains somewhat elevated - but the recent bump in rates has slowed activity.
The second graph shows the MBA mortgage purchase index
 According to the MBA, purchase activity is down 12% year-over-year unadjusted.
Note: The year ago comparisons for the unadjusted purchase index are now difficult since purchase activity was strong in the second half of 2020.
Note: Red is a four-week average (blue is weekly).
Tuesday, October 19, 2021
Wednesday: Beige Book, Architecture Billings Index
by Calculated Risk on 10/19/2021 09:00:00 PM
Wednesday:
• At 7:00 AM ET, The Mortgage Bankers Association (MBA) will release the results for the mortgage purchase applications index.
• During the day, The AIA's Architecture Billings Index for September (a leading indicator for commercial real estate).
• At 2:00 PM, the Federal Reserve Beige Book, an informal review by the Federal Reserve Banks of current economic conditions in their Districts.
October 19th COVID-19: 37 Days till Thanksgiving; Need to Get Daily Cases Down Before Holidays
by Calculated Risk on 10/19/2021 06:17:00 PM
| COVID Metrics | ||||
|---|---|---|---|---|
| Today | Week Ago | Goal | ||
| Percent fully Vaccinated | 57.0% | 56.5% | ≥70.0%1 | |
| Fully Vaccinated (millions) | 189.3 | 187.7 | ≥2321 | |
| New Cases per Day3 | 75,571 | 89,957 | ≤5,0002 | |
| Hospitalized3 | 52,146 | 59,038 | ≤3,0002 | |
| Deaths per Day3 | 1,260 | 1,298 | ≤502 | |
| 1 Minimum to achieve "herd immunity" (estimated between 70% and 85%). 2my goals to stop daily posts, 37 day average for Cases, Currently Hospitalized, and Deaths 🚩 Increasing 7 day average week-over-week for Cases, Hospitalized, and Deaths ✅ Goal met. | ||||
IMPORTANT: For "herd immunity" most experts believe we need 70% to 85% of the total population fully vaccinated (or already had COVID).
The following 20 states have between 50% and 59.9% fully vaccinated: Pennsylvania at 59.6%, Minnesota, Hawaii, Delaware, Florida, Wisconsin, Nebraska, Iowa, Illinois, Michigan, Kentucky, South Dakota, Texas, Arizona, Kansas, Nevada, Alaska, Utah, North Carolina and Ohio at 51.3%.
Next up (total population, fully vaccinated according to CDC) are Montana at 49.7%, Indiana at 49.3%, Missouri at 49.1%, Oklahoma at 49.1% and South Carolina at 49.1%.
 Click on graph for larger image.
This graph shows the daily (columns) and 7 day average (line) of positive tests reported.
Lawler: Early Read on Existing Home Sales in September
by Calculated Risk on 10/19/2021 03:20:00 PM
From housing economist Tom Lawler:
Based on publicly-available local realtor/MLS reports released across the country through today, I project that existing home sales as estimated by the National Association of Realtors ran at a seasonally adjusted annual rate of 6.2 million in September, up 5.4% from August’s preliminary pace but down 3.7% from last September’s seasonally adjusted pace
Local realtor reports, as well as reports from national inventory trackers, suggest that the YOY % decline in the inventory of existing homes for sale last month was similar to that in August.
Finally, local realtor/MLS reports suggest the median existing single-family home sales price last month was up by about 12.6% from last September.


