by Calculated Risk on 11/02/2021 11:56:00 AM
Tuesday, November 02, 2021
Update: Framing Lumber Prices Up Year-over-year
Here is another monthly update on framing lumber prices.
This graph shows CME random length framing futures through November 2nd.
 Click on graph for larger image in graph gallery.
There were supply constraints over the last year, for example, sawmills cut production and inventory at the beginning of the pandemic, and the West Coast fires in 2020 damaged privately-owned timberland (and maybe again in 2021).
HVS: Q3 2021 Homeownership and Vacancy Rates
by Calculated Risk on 11/02/2021 10:14:00 AM
The Census Bureau released the Residential Vacancies and Homeownership report for Q3 2021.
The results of this survey were significantly distorted by the pandemic in 2020.
This report is frequently mentioned by analysts and the media to track household formation, the homeownership rate, and the homeowner and rental vacancy rates. However, there are serious questions about the accuracy of this survey.
This survey might show the trend, but I wouldn't rely on the absolute numbers. Analysts probably shouldn't use the HVS to estimate the excess vacant supply or household formation, or rely on the homeownership rate, except as a guide to the trend.
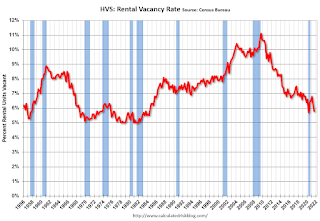
"National vacancy rates in the third quarter 2021 were 5.8 percent for rental housing and 0.9 percent for homeowner housing. The rental vacancy rate was 0.6 percentage points lower than the rate in the third quarter 2020 (6.4 percent) and 0.4 percentage points lower than the rate in the second quarter 2021 (6.2 percent).
The homeowner vacancy rate of 0.86 percent was lower than the rate in the third quarter 2020 (0.95 percent) and virtually the same as the rate in the second quarter 2021 (0.86 percent). (Note: the 0.86 percent and the 0.95 percent each round to 0.9 percent in the tables below).
The homeownership rate of 65.4 percent was 2.0 percentage points lower than the rate in the third quarter 2020 (67.4 percent) and virtually the same as the rate in the second quarter 2021 (65.4 percent). "
emphasis added
 Click on graph for larger image.
The Red dots are the decennial Census homeownership rates for April 1st 1990, 2000 and 2010. The Census Bureau will released data for 2020 soon.
The results starting in Q2 2020 were distorted by the pandemic.
 The HVS homeowner vacancy was unchanged at 0.9% in Q3.
 Once again - this probably shows the general trend, but I wouldn't rely on the absolute numbers.
CoreLogic: House Prices up 18% YoY in September
by Calculated Risk on 11/02/2021 08:00:00 AM
Notes: This CoreLogic House Price Index report is for September. The recent Case-Shiller index release was for August. The CoreLogic HPI is a three month weighted average and is not seasonally adjusted (NSA).
From CoreLogic: US Annual Home Price Growth Hits 18% in September as Supply and Demand Imbalances Intensify, CoreLogic Reports
CoreLogic® ... released the CoreLogic Home Price Index (HPI™) and HPI Forecast™ for September 2021.
Demand for homebuying remained strong through the end of the summer. However, the ongoing housing supply shortage has continued to drive up prices, which increased 18% year over year in September, to record highs creating additional challenges for entry into the homebuying market. High demand and low supply levels for entry-level homes, in particular, are sidelining many would-be first-time buyers.
As millennials continue to make up a large part of homebuying demand and flock to tech hubs like Seattle; San Jose, California and Austin, Texas, we may see this challenge intensify. This is reflected in a recent CoreLogic consumer survey, with 47.9% of this cohort stating they cannot afford to purchase a home in their preferred area.
“The pandemic led prospective buyers to seek detached homes in communities with lower population density, such as suburbs and exurbs,” said Frank Martell, president and CEO of CoreLogic. “As we head into 2022, we expect some moderation in the current pattern of flight away from urban cores as the pandemic wanes.”
...
Nationally, home prices increased 18% in September 2021, compared to September 2020. On a month-over-month basis, home prices increased by 1.1% compared to August 2021.
...
In September, appreciation of detached properties (19.6%) was 7.4 percentage points higher than that of attached properties (12.2%).
emphasis added
Monday, November 01, 2021
Tuesday: CoreLogic House Prices, Housing Vacancies and Homeownership, Vehicle Sales
by Calculated Risk on 11/01/2021 09:02:00 PM
From Matthew Graham at Mortgage News Daily: Mortgage Rates Catch Up To Last Week's Market Movement (That's a Good Thing)
Mortgage rates moved moderately lower today despite an absence of significant movement in the bond market. In general, when bonds improve, rates fall (and vice versa), but it's not feasible for mortgage lenders to adjust their rates offerings in relative real-time as bonds can send massively mixed signals on any given day. [30 year fixed 3.18%]Tuesday:
emphasis added
• At 8:00 AM ET, Corelogic House Price index for September.
• At 10:00 AM, The Q3 Housing Vacancies and Homeownership report from the Census Bureau.
• All day, Light vehicle sales for October. The consensus is for sales of 12.4 million SAAR, up from 12.2 million SAAR in September (Seasonally Adjusted Annual Rate).
MBA Survey: "Share of Mortgage Loans in Forbearance Decreases to 2.15%"
by Calculated Risk on 11/01/2021 04:00:00 PM
Note: This is as of October 24th.
From the MBA: Share of Mortgage Loans in Forbearance Decreases to 2.15%
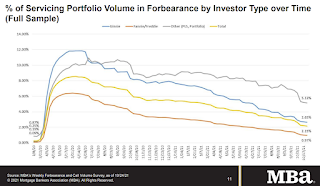
The Mortgage Bankers Association’s (MBA) latest Forbearance and Call Volume Survey revealed that the total number of loans now in forbearance decreased by 6 basis points from 2.21% of servicers’ portfolio volume in the prior week to 2.15% as of October 24, 2021. According to MBA’s estimate, 1.1 million homeowners are in forbearance plans.
The share of Fannie Mae and Freddie Mac loans in forbearance decreased 3 basis points to 0.97%. Ginnie Mae loans in forbearance decreased 7 basis points to 2.65%, and the forbearance share for portfolio loans and private-label securities (PLS) declined 8 basis points to 5.13%. The percentage of loans in forbearance for independent mortgage bank (IMB) servicers decreased 6 basis points relative to the prior week to 2.43%, and the percentage of loans in forbearance for depository servicers decreased 4 basis points to 2.07%.
“For the first time since March 2020, the share of Fannie Mae and Freddie Mac loans in forbearance dropped below 1 percent. A small decline for this investor category was matched by similarly small declines for Ginnie Mae and portfolio/PLS loans,” said Mike Fratantoni, MBA’s Senior Vice President and Chief Economist. “Forbearance exits slowed at the end of October to the slowest pace since late August. With so many borrowers having reached the end of their 18-month forbearance term, we expect a steady pace of exits in November.”
emphasis added
 Click on graph for larger image.
This graph shows the percent of portfolio in forbearance by investor type over time. The number of forbearance plans is decreasing rapidly recently since many homeowners have reached the end of the 18-month term.
Some stats on exits:
Of the cumulative forbearance exits for the period from June 1, 2020, through October 24, 2021, at the time of forbearance exit:
• 29.1% resulted in a loan deferral/partial claim.
• 20.6% represented borrowers who continued to make their monthly payments during their forbearance period.
• 16.7% represented borrowers who did not make all of their monthly payments and exited forbearance without a loss mitigation plan in place yet.
• 13.1% resulted in a loan modification or trial loan modification.
• 12.0% resulted in reinstatements, in which past-due amounts are paid back when exiting forbearance.
• 7.1% resulted in loans paid off through either a refinance or by selling the home.
• The remaining 1.4% resulted in repayment plans, short sales, deed-in-lieus or other reasons.
November 1st COVID-19: New Cases per Day Increasing
by Calculated Risk on 11/01/2021 03:52:00 PM
| COVID Metrics | ||||
|---|---|---|---|---|
| Today | Week Ago | Goal | ||
| Percent fully Vaccinated | 58.0% | 57.4% | ≥70.0%1 | |
| Fully Vaccinated (millions) | 192.5 | 190.6 | ≥2321 | |
| New Cases per Day3🚩 | 71,207 | 62,858 | ≤5,0002 | |
| Hospitalized3 | 41,287 | 47,878 | ≤3,0002 | |
| Deaths per Day3 | 1,151 | 1,196 | ≤502 | |
| 1 Minimum to achieve "herd immunity" (estimated between 70% and 85%). 2my goals to stop daily posts, 37 day average for Cases, Currently Hospitalized, and Deaths 🚩 Increasing 7 day average week-over-week for Cases, Hospitalized, and Deaths ✅ Goal met. | ||||
IMPORTANT: For "herd immunity" most experts believe we need 70% to 85% of the total population fully vaccinated (or already had COVID). Note: COVID will probably stay endemic (at least for some time).
The following 22 states have between 50% and 59.9% fully vaccinated: Minnesota at 59.9%, Delaware, Hawaii, Florida, Wisconsin, Nebraska, Iowa, Illinois, Michigan, Kentucky, South Dakota, Texas, Arizona, Kansas, Nevada, Alaska, Utah, North Carolina, Ohio, Montana, Oklahoma, and South Carolina at 50.0%.
Next up (total population, fully vaccinated according to CDC) are Indiana at 49.9%, Missouri at 49.8%, Georgia at 48.2%, and Arkansas at 48.0%.
 Click on graph for larger image.
This graph shows the daily (columns) and 7 day average (line) of positive tests reported.
The Rapid Increase in Rents Continues
by Calculated Risk on 11/01/2021 02:31:00 PM
Today, in the Real Estate Newsletter: The Rapid Increase in Rents Continues New Leases up Sharply year-over-year in September
Excerpt:
The Zillow measure is up 9.2% YoY in September, up from 8.4% YoY in August. And the ApartmentList measure is up 15.1% as of September, up from 12.5% in August. Both the Zillow measure (a repeat rent index), and ApartmentList are showing a sharp increase in rents.
...
Clearly rents are increasing sharply, and we should expect this to spill over into measures of inflation in 2022. The Owners Equivalent Rent (OER) was up 2.9% YoY in September, from 2.6% in August - and will increase further in the coming months.
Housing Inventory Nov 1st Update: Inventory Down 2.2% Week-over-week
by Calculated Risk on 11/01/2021 11:17:00 AM
Tracking existing home inventory will be very important this year.

This inventory graph is courtesy of Altos Research.
Construction Spending Decreased in September
by Calculated Risk on 11/01/2021 10:21:00 AM
From the Census Bureau reported that overall construction spending was "virtually unchanged":
Construction spending during September 2021 was estimated at a seasonally adjusted annual rate of $1,573.6 billion, 0.5 percent below the revised August estimate of $1,582.0 billion. The September figure is 7.8 percent above the September 2020 estimate of $1,459.3 billion.Both private and public spending decreased:
emphasis added
Spending on private construction was at a seasonally adjusted annual rate of $1,229.9 billion, 0.5 percent below the revised August estimate of $1,236.1 billion. ...
In September, the estimated seasonally adjusted annual rate of public construction spending was $343.7 billion, 0.7 percent below the revised August estimate of $345.9 billion.
 Click on graph for larger image.
This graph shows private residential and nonresidential construction spending, and public spending, since 1993. Note: nominal dollars, not inflation adjusted.
Residential spending is 14% above the bubble peak (in nominal terms - not adjusted for inflation).
Non-residential spending is 10% above the bubble era peak in January 2008 (nominal dollars), but has been weak recently.
Public construction spending is 6% above the peak in March 2009, but weak recently.
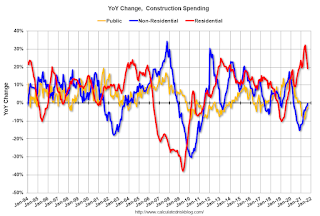
 The second graph shows the year-over-year change in construction spending.
On a year-over-year basis, private residential construction spending is up 19.3%. Non-residential spending is down 0.5% year-over-year. Public spending is down 2.4% year-over-year.
Construction was considered an essential service during the early months of the pandemic in most areas, and did not decline sharply like many other sectors. However, some sectors of non-residential have been under pressure. For example, lodging is down 32.8% YoY, and office down 2.9% YoY.
ISM® Manufacturing index decreased to 60.8% in October
by Calculated Risk on 11/01/2021 10:07:00 AM
(Posted with permission). The ISM manufacturing index indicated expansion in September. The PMI® was at 60.8% in October, down from 61.1% in September. The employment index was at 52.0%, up from 50.2% last month, and the new orders index was at 59.8%, down from 66.7%.
From ISM: Manufacturing PMI® at 61.1% October 2021 Manufacturing ISM® Report On Business®
Economic activity in the manufacturing sector grew in October, with the overall economy achieving a 17th consecutive month of growth, say the nation's supply executives in the latest Manufacturing ISM® Report On Business®.This was at expectations, and this suggests manufacturing expanded at a slightly slower pace in October than in September.
The report was issued today by Timothy R. Fiore, CPSM, C.P.M., Chair of the Institute for Supply Management® (ISM®) Manufacturing Business Survey Committee:
“The October Manufacturing PMI® registered 60.8 percent, a decrease of 0.3 percentage point from the September reading of 61.1 percent. This figure indicates expansion in the overall economy for the 17th month in a row after a contraction in April 2020. The New Orders Index registered 59.8 percent, down 6.9 percentage points compared to the September reading of 66.7 percent. The Production Index registered 59.3 percent, a decrease of 0.1 percentage point compared to the September reading of 59.4 percent. The Prices Index registered 85.7 percent, up 4.5 percentage points compared to the September figure of 81.2 percent. The Backlog of Orders Index registered 63.6 percent, 1.2 percentage points lower than the September reading of 64.8 percent. The Employment Index registered 52 percent, 1.8 percentage points higher compared to the September reading of 50.2 percent. The Supplier Deliveries Index registered 75.6 percent, up 2.2 percentage points from the September figure of 73.4 percent. The Inventories Index registered 57 percent, 1.4 percentage points higher than the September reading of 55.6 percent. The New Export Orders Index registered 54.6 percent, an increase of 1.2 percentage points compared to the September reading of 53.4 percent. The Imports Index registered 49.1 percent, a 5.8-percentage point decrease from the September reading of 54.9 percent.”
emphasis added


