by Calculated Risk on 11/05/2021 04:03:00 PM
Friday, November 05, 2021
November 5th COVID-19: "Path of the economy continues to depend on the course of the virus"
| COVID Metrics | ||||
|---|---|---|---|---|
| Today | Week Ago | Goal | ||
| Percent fully Vaccinated | 58.2% | 57.8% | ≥70.0%1 | |
| Fully Vaccinated (millions) | 193.2 | 192.0 | ≥2321 | |
| New Cases per Day3🚩 | 71,241 | 69,805 | ≤5,0002 | |
| Hospitalized3 | 41,162 | 45,274 | ≤3,0002 | |
| Deaths per Day3 | 1,102 | 1,211 | ≤502 | |
| 1 Minimum to achieve "herd immunity" (estimated between 70% and 85%). 2my goals to stop daily posts, 37 day average for Cases, Currently Hospitalized, and Deaths 🚩 Increasing 7 day average week-over-week for Cases, Hospitalized, and Deaths ✅ Goal met. | ||||
IMPORTANT: For "herd immunity" most experts believe we need 70% to 85% of the total population fully vaccinated (or already had COVID). Note: COVID will probably stay endemic (at least for some time).
The following 20 states have between 50% and 59.9% fully vaccinated: Florida at 59.9%, Wisconsin, Nebraska, Iowa, Illinois, Michigan, Kentucky, South Dakota, Texas, Arizona, Kansas, Nevada, Alaska, Utah, North Carolina, Ohio, Montana, Oklahoma, South Carolina and Indiana at 50.0%.
Next up (total population, fully vaccinated according to CDC) are Missouri at 49.9%, Georgia at 48.5%, Arkansas at 48.2%, and Tennessee at 47.9%.
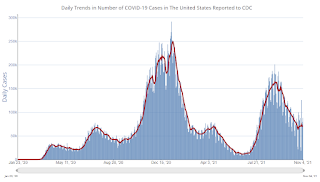 Click on graph for larger image.
This graph shows the daily (columns) and 7 day average (line) of positive tests reported.
AAR: October Rail Carloads Down Compared to 2019
by Calculated Risk on 11/05/2021 03:21:00 PM
From the Association of American Railroads (AAR) Rail Time Indicators. Graphs and excerpts reprinted with permission.
U.S. rail volumes continue to be impacted by supply chain issues and an economy that isn’t yet what it could be.
Total U.S. carloads rose 3.8% in October 2021 over October 2020 as year-over-year gains in coal, chemicals, and crushed stone and sand, among others, exceeded declines in motor vehicles, grain, and petroleum products. October was the eighth straight month in which total carloads were higher than the same month in 2020, but the 3.8% gain in October was the lowest gain in those eight months. ...
Supply chain problems (especially shortages of dray trucks, drivers, and warehouse space) kept U.S. intermodal volume down in October — it fell 7.9% from October 2020, its third straight year-over-year decline.
emphasis added
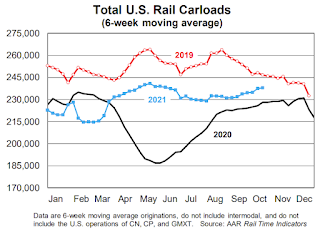 Click on graph for larger image.
This graph from the Rail Time Indicators report shows the six week average of U.S. Carloads in 2019, 2020 and 2021:
Total U.S. carload traffic has risen slightly but perceptibly over the past two months. At the end of October, the 6-week moving average for total carloads originated was 237,999. That’s the most since mid-June. ... Total carloads in October 2021 were down 3.1% from October 2019. In each month so far in 2021, total carloads in 2021 have been below the comparable month in 2019.
 The second graph shows the six week average (not monthly) of U.S. intermodal in 2019, 2020 and 2021: (using intermodal or shipping containers):
[I]ntermodal volumes continue to be driven down by supply chain problems — especially shortages of dray trucks, drivers, and warehouse space — that are preventing rail customers from clearing their freight from rail terminals as quickly as they and railroads would like. Intermodal in October 2021 was down 7.9% from October 2020, its third straight year-over-year decline. October 202o was at the time the best intermodal month ever.
1st Look at Local Housing Markets in October
by Calculated Risk on 11/05/2021 11:45:00 AM
Today, in the Real Estate Newsletter: 1st Look at Local Housing Markets in October
Excerpt:
This is the first look at local markets in October. I’m tracking about 30 local housing markets in the US. Some of the 30 markets are states, and some are metropolitan areas. I’ll update these tables throughout the month as additional data is released.You can subscribe at https://calculatedrisk.substack.com/ (Currently all content is available for free, but please subscribe).
My view is that if the housing market is slowing, it will show up in inventory (not yet!).
...
Inventory almost always declines seasonally in October, so the MoM decline is not a surprise. Last month, these three markets were down 24% YoY, so the YoY decline in October is larger than in September. This isn’t indicating a slowing market (but this is just 3 early reporting markets).
Comments on October Employment Report
by Calculated Risk on 11/05/2021 09:37:00 AM
The headline jobs number in the October employment report was above expectations, and employment for the previous two months was revised up significantly. The participation rate was unchanged, and the unemployment rate decreased to 4.6%. Overall this was a strong report.
Earlier: October Employment Report: 531 Thousand Jobs, 4.6% Unemployment Rate
In October, the year-over-year employment change was 5.8 million jobs.
Permanent Job Losers
 Click on graph for larger image.
This graph shows permanent job losers as a percent of the pre-recession peak in employment through the report today. (ht Joe Weisenthal at Bloomberg).
In October, the number of permanent job losers decreased to 2.126 million from 2.251 million in September.
Prime (25 to 54 Years Old) Participation
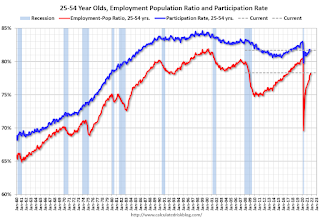 Since the overall participation rate has declined due to cyclical (recession) and demographic (aging population, younger people staying in school) reasons, here is the employment-population ratio for the key working age group: 25 to 54 years old.
The prime working age will be key as the economy recovers.
The 25 to 54 participation rate increased in October to 81.7% from 81.6% in September, and the 25 to 54 employment population ratio increased to 78.3% from 78.0% in September.
Seasonal Retail Hiring
Typically retail companies start hiring for the holiday season in October, and really increase hiring in November. Here is a graph that shows the historical net retail jobs added for October, November and December by year.
 This graph really shows the collapse in retail hiring in 2008. Since then seasonal hiring had increased back close to more normal levels. Note: I expect the long term trend will be down with more and more internet holiday shopping.
Retailers hired 219 thousand workers Not Seasonally Adjusted (NSA) net in October.
Part Time for Economic Reasons
 From the BLS report:
"The number of persons employed part time for economic reasons, at 4.4 million, was little changed in October. These individuals, who would have preferred full-time employment, were working part time because their hours had been reduced or they were unable to find full- time jobs. This measure has essentially returned to its February 2020 level."The number of persons working part time for economic reasons was essentially unchanged in October at 4.423 million from 4.468 million in September. This is back to pre-recession levels.
These workers are included in the alternate measure of labor underutilization (U-6) that decreased to 8.3% from 8.5% in the previous month. This is down from the record high in April 22.9% for this measure since 1994. This measure was at 7.0% in February 2020 (pre-pandemic).
Unemployed over 26 Weeks
 This graph shows the number of workers unemployed for 27 weeks or more.
 According to the BLS, there are 2.326 million workers who have been unemployed for more than 26 weeks and still want a job, down from 2.683 million the previous month.
This does not include all the people that left the labor force.
Summary:
The headline monthly jobs number was above expectations, and the previous two months were revised up by 235,000 combined. And the headline unemployment rate decreased to 4.6%. Overall this was a strong report.
October Employment Report: 531 Thousand Jobs, 4.6% Unemployment Rate
by Calculated Risk on 11/05/2021 08:42:00 AM
From the BLS:
Total nonfarm payroll employment rose by 531,000 in October, and the unemployment rate edged down by 0.2 percentage point to 4.6 percent, the U.S. Bureau of Labor Statistics reported today. Job growth was widespread, with notable job gains in leisure and hospitality, in professional and business services, in manufacturing, and in transportation and warehousing. Employment in public education declined over the month.
...
The change in total nonfarm payroll employment for August was revised up by 117,000, from +366,000 to +483,000, and the change for September was revised up by 118,000, from +194,000 to +312,000. With these revisions, employment in August and September combined is 235,000 higher than previously reported.
emphasis added
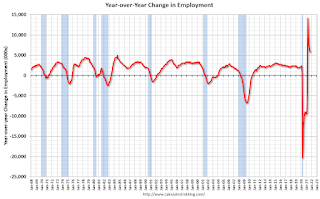 Click on graph for larger image.
The first graph shows the year-over-year change in total non-farm employment since 1968.
In October, the year-over-year change was 5.8 million jobs. This was up significantly year-over-year.
Total payrolls increased by 531 thousand in October. Private payrolls increased by 604 thousand, and public payrolls declined 73 thousand.
Payrolls for August and September were revised up 235 thousand, combined.
 The second graph shows the job losses from the start of the employment recession, in percentage terms.
The current employment recession was by far the worst recession since WWII in percentage terms, but currently is not as severe as the worst of the "Great Recession".
The third graph shows the employment population ratio and the participation rate.
 The Labor Force Participation Rate was unchanged at 61.6% in October, from 61.6% in September. This is the percentage of the working age population in the labor force.
 The Employment-Population ratio increased to 58.8% from 58.7% (black line).
I'll post the 25 to 54 age group employment-population ratio graph later.
 The fourth graph shows the unemployment rate.
 The unemployment rate decreased in October to 4.6% from 4.8% in September.
This was above consensus expectations, and August and September were revised up by 235,000 combined. A strong report.
Thursday, November 04, 2021
Friday: Employment Report
by Calculated Risk on 11/04/2021 09:00:00 PM
My October Employment Preview
Goldman October Payrolls Preview
Friday:
• At 8:30 AM, Employment Report for October. The consensus is for 450 thousand jobs added, and for the unemployment rate to decrease to 4.7%.
Goldman October Payrolls Preview
by Calculated Risk on 11/04/2021 04:08:00 PM
A few brief excerpts from a note by Goldman Sachs economist Spencer Hill:
We estimate nonfarm payrolls rose 525k in October ... tomorrow’s report reflects the first full month of hiring following the expiration of federal enhanced unemployment benefits. Our forecast also reflects improving public health, strong labor demand, and a partial education rebound as schools gradually fill positions left open at the start of the school year. On the negative side, the seasonal factors may have evolved to fit the strong October 2020 data, raising the seasonal hurdle in tomorrow’s report. ... We estimate a one-tenth drop in the unemployment rate to 4.7%.CR Note: The consensus is for 450 thousand jobs added, and for the unemployment rate to decrease to 4.7%.
emphasis added
November 4th COVID-19: Over 70,000 New Cases per Day
by Calculated Risk on 11/04/2021 03:30:00 PM
| COVID Metrics | ||||
|---|---|---|---|---|
| Today | Week Ago | Goal | ||
| Percent fully Vaccinated | 58.1% | 57.6% | ≥70.0%1 | |
| Fully Vaccinated (millions) | 192.9 | 191.2 | ≥2321 | |
| New Cases per Day3 | 70,431 | 71,450 | ≤5,0002 | |
| Hospitalized3 | 41,850 | 45,892 | ≤3,0002 | |
| Deaths per Day3 | 1,109 | 1,216 | ≤502 | |
| 1 Minimum to achieve "herd immunity" (estimated between 70% and 85%). 2my goals to stop daily posts, 37 day average for Cases, Currently Hospitalized, and Deaths 🚩 Increasing 7 day average week-over-week for Cases, Hospitalized, and Deaths ✅ Goal met. | ||||
IMPORTANT: For "herd immunity" most experts believe we need 70% to 85% of the total population fully vaccinated (or already had COVID). Note: COVID will probably stay endemic (at least for some time).
The following 20 states have between 50% and 59.9% fully vaccinated: Hawaii at 59.9%, Florida, Wisconsin, Nebraska, Iowa, Illinois, Michigan, Kentucky, South Dakota, Texas, Arizona, Kansas, Nevada, Alaska, Utah, North Carolina, Ohio, Montana, Oklahoma, and South Carolina at 50.1%.
Next up (total population, fully vaccinated according to CDC) are Indiana at 49.9%, Missouri at 49.9%, Georgia at 48.4%, and Arkansas at 48.1%.
 Click on graph for larger image.
This graph shows the daily (columns) and 7 day average (line) of positive tests reported.
October Employment Preview
by Calculated Risk on 11/04/2021 01:37:00 PM
On Friday at 8:30 AM ET, the BLS will release the employment report for October. The consensus is for 450 thousand jobs added, and for the unemployment rate to decrease to 4.7%.
 Click on graph for larger image.
• First, currently there are still about 5.0 million fewer jobs than in February 2020 (before the pandemic).
This graph shows the job losses from the start of the employment recession, in percentage terms.
The current employment recession was by far the worst recession since WWII in percentage terms, but is now better than the worst of the "Great Recession".
• ADP Report: The ADP employment report showed a gain of 571,000 private sector jobs, above the consensus estimate of 400,000 jobs added. The ADP report hasn't been very useful in predicting the BLS report, but this suggests the BLS report could be above expectations.
• ISM Surveys: Note that the ISM services are diffusion indexes based on the number of firms hiring (not the number of hires). The ISM® manufacturing employment index increased in October to 52.0%, up from 50.2% last month. This would suggest a decline in manufacturing employment of around 8,000 jobs in October. ADP showed 53,000 manufacturing jobs added.
The ISM® Services employment index decreased in October to 51.6%, down from 53.0% last month. This would suggest an increase in service employment of around 115,000 jobs in September.
Combined, the ISM indexes suggest a weaker than expected employment report.
• Unemployment Claims: The weekly claims report showed a sharp decline in the number of initial unemployment claims during the reference week (includes the 12th of the month) from 351,000 in September to 291,000 in October. This would usually suggest fewer layoffs in October than in September, although this might not be very useful right now. In general, weekly claims have been falling, and have been below expectations in October.
 • Permanent Job Losers: Something to watch in the employment report will be "Permanent job losers". This graph shows permanent job losers as a percent of the pre-recession peak in employment through the June report.
This data is only available back to 1994, so there is only data for three recessions. In September, the number of permanent job losers decreased to 2.251 million from 2.487 million in August. These jobs will likely be the hardest to recover, so it is a positive that the number of permanent job losers is declining rapidly
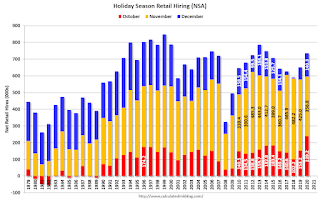 • Seasonal Retail Hiring: Typically retail companies start hiring for the holiday season in October, and really increase hiring in November. But only a few temporary workers are hired in December. Here is a graph that shows the historical net retail jobs added for October, November and December by year.
In 2020, retailers hired 239,200 employees (NSA) in October (most seasonal, but some bounce back during pandemic). That translated to a gain of 106,000 jobs SA.
• Conclusion: There is significant optimism concerning the October employment report, and many analysts are expecting a strong report. We have to be a little cautious because some of the apparent pickup in hiring might be for seasonal retail jobs.
Hotels: Occupancy Rate Down 6% Compared to Same Week in 2019
by Calculated Risk on 11/04/2021 11:20:00 AM
Note: Since occupancy declined sharply at the onset of the pandemic, CoStar is comparing to 2019.
As anticipated ahead of Halloween, U.S. hotel performance fell week over week, according to STR‘s latest data through 30 October.The following graph shows the seasonal pattern for the hotel occupancy rate using the four week average.
Oct. 24-30, 2021 (percentage change from comparable week in 2019*):
• Occupancy: 58.9% (-5.7%)
• Average daily rate (ADR): US$127.70 (+1.5%)
• evenue per available room (RevPAR): US$75.28 (-4.3%)
Even with a drop in performance levels from previous weeks, comparisons with the matching week in 2019 improved because Halloween that year fell on a Thursday and created a more significant disruption in business travel and groups.
*Due to the steep, pandemic-driven performance declines of 2020, STR is measuring recovery against comparable time periods from 2019.
emphasis added
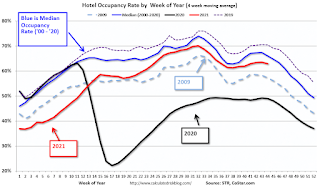 Click on graph for larger image.
The red line is for 2021, black is 2020, blue is the median, dashed purple is 2019, and dashed light blue is for 2009 (the worst year on record for hotels prior to 2020).


