by Calculated Risk on 11/10/2021 08:32:00 AM
Wednesday, November 10, 2021
BLS: CPI increased 0.9% in October, Core CPI increased 0.6%
The Consumer Price Index for All Urban Consumers (CPI-U) increased 0.9 percent in October on a seasonally adjusted basis after rising 0.4 percent in September, the U.S. Bureau of Labor Statistics reported today. Over the last 12 months, the all items index increased 6.2 percent before seasonal adjustment.Both CPI and core CPI were well above expectations. I'll post a graph later today after the Cleveland Fed releases the median and trimmed-mean CPI.
The monthly all items seasonally adjusted increase was broad-based, with increases in the indexes for energy, shelter, food, used cars and trucks, and new vehicles among the larger contributors. The energy index rose 4.8 percent over the month, as the gasoline index increased 6.1 percent and the other major energy component indexes also rose. The food index increased 0.9 percent as the index for food at home rose 1.0 percent.
The index for all items less food and energy rose 0.6 percent in October after increasing 0.2 percent in September. Most component indexes increased over the month. Along with shelter, used cars and trucks, and new vehicles, the indexes for medical care, for household furnishing and operations, and for recreation all increased in October. The indexes for airline fares and for alcoholic beverages were among the few to decline over the month.
The all items index rose 6.2 percent for the 12 months ending October, the large st 12-month increase since the period ending November 1990. The index for all items less food and energy rose 4.6 percent over the last 12 months, the largest 12-month increase since the period ending August 1991. The energy index rose 30.0 percent over the last 12 months, and the food index increased 5.3 percent.
emphasis added
MBA: Mortgage Applications Increase in Latest Weekly Survey
by Calculated Risk on 11/10/2021 07:00:00 AM
From the MBA: Mortgage Applications Increase in Latest MBA Weekly Survey
Mortgage applications increased 5.5 percent from one week earlier, according to data from the Mortgage Bankers Association’s (MBA) Weekly Mortgage Applications Survey for the week ending November 5, 2021.
... The Refinance Index increased 7 percent from the previous week and was 28 percent lower than the same week one year ago. The seasonally adjusted Purchase Index increased 3 percent from one week earlier. The unadjusted Purchase Index increased 0.1 percent compared with the previous week and was 4 percent lower than the same week one year ago.
“Mortgage rates moved lower for the second week in a row for all loan types. The 30-year fixed rate decreased to 3.16 percent and has declined 14 basis points over the past two weeks. Although overall activity remains close to January 2020 lows, homeowners acted on the decrease in rates. Refinance activity was up 7 percent overall, with gains in both conventional and government refinances. Additionally, the average loan balance for a refinance application was the highest in a month,” said Joel Kan, MBA’s Associate Vice President of Economic and Industry Forecasting. “Purchase applications were also strong last week, increasing just under 3 percent and down only 4 percent from last year’s pace. The dip in rates might have helped to bring some buyers back into the market, but housing inventory is still extremely low and price growth remains elevated.”
...
The average contract interest rate for 30-year fixed-rate mortgages with conforming loan balances ($548,250 or less) decreased to 3.16 percent from 3.24 percent, with points remaining unchanged at 0.34 (including the origination fee) for 80 percent loan-to-value ratio (LTV) loans.
emphasis added
 Click on graph for larger image.
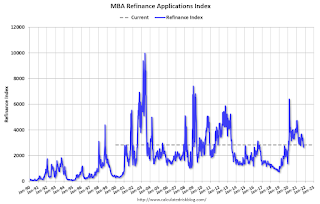
The first graph shows the refinance index since 1990.
With relatively low rates, the index remains somewhat elevated, and the recent decline in rates has given the index a slight boost.
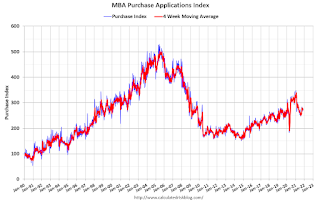
The second graph shows the MBA mortgage purchase index
 According to the MBA, purchase activity is down 4% year-over-year unadjusted.
This is the smallest year-over-year decline in some time (purchase activity was strong in the 2nd half of 2020). However, this week last year was weak - so it is likely the year-over-year decline will be larger in coming weeks.
Note: Red is a four-week average (blue is weekly).
Tuesday, November 09, 2021
Wednesday: CPI, Unemployment Claims
by Calculated Risk on 11/09/2021 08:01:00 PM
Wednesday:
• At 7:00 AM ET, The Mortgage Bankers Association (MBA) will release the results for the mortgage purchase applications index.
• At 8:30 AM, The Consumer Price Index for October from the BLS. The consensus is for a 0.6% increase in CPI, and a 0.4% increase in core CPI.
• At 8:30 AM, The initial weekly unemployment claims report will be released. The consensus is for 260 thousand initial claims, down from 269 thousand last week.
November 9th COVID-19: 16 Days till Thanksgiving and New Cases Stuck at 70,000+ per Day
by Calculated Risk on 11/09/2021 04:24:00 PM
| COVID Metrics | ||||
|---|---|---|---|---|
| Today | Week Ago | Goal | ||
| Percent fully Vaccinated | 58.5% | 58.0% | ≥70.0%1 | |
| Fully Vaccinated (millions) | 194.2 | 192.6 | ≥2321 | |
| New Cases per Day3 | 73,312 | 75,209 | ≤5,0002 | |
| Hospitalized3 | 39,841 | 43,056 | ≤3,0002 | |
| Deaths per Day3 | 1,078 | 1,211 | ≤502 | |
| 1 Minimum to achieve "herd immunity" (estimated between 70% and 85%). 2my goals to stop daily posts, 37 day average for Cases, Currently Hospitalized, and Deaths 🚩 Increasing 7 day average week-over-week for Cases, Hospitalized, and Deaths ✅ Goal met. | ||||
IMPORTANT: For "herd immunity" most experts believe we need 70% to 85% of the total population fully vaccinated (or already had COVID). Note: COVID will probably stay endemic (at least for some time).
The following 20 states have between 50% and 59.9% fully vaccinated: Wisconsin at 58.7%, Nebraska, Iowa, Illinois, Michigan, Kentucky, South Dakota, Texas, Arizona, Kansas, Nevada, Alaska, Utah, North Carolina, Ohio, Montana, Oklahoma, South Carolina, Indiana, and Missouri at 50.1%.
Next up (total population, fully vaccinated according to CDC) are Georgia at 48.8%, Arkansas at 48.4%, Tennessee at 48.1% and Louisiana at 48.0%.
 Click on graph for larger image.
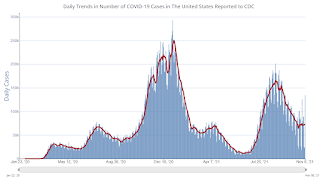
This graph shows the daily (columns) and 7 day average (line) of positive tests reported.
2nd Look at Local Housing Markets in October: Memphis, Nashville, New Hampshire, North Texas (Dallas) and San Diego.
by Calculated Risk on 11/09/2021 01:31:00 PM
Today, in the Real Estate Newsletter: 2nd Look at Local Housing Markets in October
Excerpt:
Here is a summary of active listings for the housing markets that have reported so far in October. For these markets, inventory was down 9.6% in October MoM from September, and down 30.4% YoY.You can subscribe at https://calculatedrisk.substack.com/ (Currently all content is available for free, but please subscribe).
Inventory in San Diego is at an all time low!
Inventory almost always declines seasonally in October, so the MoM decline is not a surprise. Last month, these eight markets were down 27.4% YoY, so the YoY decline in October is larger than in September. This is not indicating a slowing market (but this is just 8 early reporting markets).
NY Fed Q3 Report: Total Household Debt Climbs to Over $15 trillion
by Calculated Risk on 11/09/2021 11:17:00 AM
From the NY Fed: Total Household Debt Climbs to Over $15 trillion in Q3 2021, Driven by New Extensions of Credit
The Federal Reserve Bank of New York's Center for Microeconomic Data today issued its Quarterly Report on Household Debt and Credit. The Report shows that total household debt increased by $286 billion (1.9%) to $15.24 trillion in the third quarter of 2021. The total debt balance is now $1.1 trillion higher than at the end of 2019. It is also $890 billion higher than in Q3 2020, and $2.57 trillion higher, in nominal terms, than the $12.68 trillion peak seen in 2008. The Report is based on data from the New York Fed's Consumer Credit Panel, a nationally representative random sample of individual- and household-level debt and credit records drawn from anonymized Equifax credit data.
Mortgage balances—the largest component of household debt—rose by $230 billion and stood at $10.67 trillion at the end of September. Credit card balances increased by $17 billion, the same size increase as in the second quarter. Despite the increase, credit card balances remain $123 billion lower than they had been at the end of 2019. Auto loan balances increased by $28 billion in the third quarter. Student loan balances grew by $14 billion, coinciding with the academic borrowing year. In total, non-housing balances grew by $61 billion, with gains across all debt types.
emphasis added
 Click on graph for larger image.
Here are three graphs from the report:
The first graph shows aggregate consumer debt increased in Q3. Household debt previously peaked in 2008, and bottomed in Q3 2013. Unlike following the great recession, there wasn't a huge decline in debt during the pandemic.
From the NY Fed:
Aggregate household debt balances increased by $286 billion in the third quarter of 2021, a 1.9% rise from 2021Q2, and now stand at $15.24 trillion. Balances are $1.1 trillion higher than at the end of 2019 and $890 billion higher than in 2020Q3, and $2.57 trillion higher, in nominal terms, than the $12.68 trillion peak seen in 2008.
 The second graph shows the percent of debt in delinquency.
The overall delinquency rate decreased in Q3. From the NY Fed:
Aggregate delinquency rates have remained low and declining since the beginning of the pandemic, reflecting an uptake in forbearances (provided by both the CARES Act and voluntarily offered by lenders), which protect borrowers’ credit records from the reporting of skipped or deferred payments. As of late September, 2.7% of outstanding debt was in some stage of delinquency, a 2.0 percentage point decrease from the fourth quarter of 2019, just before the COVID-19 pandemic hit the United States. Of the $412 billion of debt that is delinquent, $302 billion is seriously delinquent (at least 90 days late or “severely derogatory”, which includes some debts that have been removed from lenders’ books but upon which they continue to attempt collection).
 The third graph shows Mortgage Originations by Credit Score.
From the NY Fed:
The credit scores of newly originated mortgages had increased in the early part of the pandemic, and although they edged down slightly, they still remain very high and reflect a continuing high quality of newly opened mortgages as well as a higher share of refinances. ... There was $1.11 trillion in newly originated mortgage debt in 2021Q3, with 69% of it originated to borrowers with credit scores over 760. 2% of newly originated mortgages were originated to subprime borrowers, a sharp contrast to the 12% average seen between 2003-2007.There is much more in the report.
Second Home Market: South Lake Tahoe in October
by Calculated Risk on 11/09/2021 08:37:00 AM
With the pandemic, there was a surge in 2nd home buying. In response, Fannie made some lending changes, from Jann Swanson at MortgageNewsDaily: Fannie Warns Lenders on Investment Properties and 2nd Homes.
I'm looking at data for some second home markets - and I'm tracking those markets to see if there is an impact from the lending changes.
This graph is for South Lake Tahoe since 2004 through October 2021, and shows inventory (blue), and the year-over-year (YoY) change in the median price (12 month average).
Note: The median price is distorted by the mix, but this is the available data.

Following the housing bubble, prices declined for several years in South Lake Tahoe, with the median price falling about 50% from the bubble peak.
Currently inventory is still very low - above the record low set early in 2021, but down YoY - and prices are up sharply YoY.
Monday, November 08, 2021
Tuesday: PPI, Quarterly Report on Household Debt and Credit
by Calculated Risk on 11/08/2021 09:01:00 PM
From Matthew Graham at Mortgage News Daily: Mortgage Rates Slightly Lower Despite Bond Market Weakness
Mortgage rates are directly based on trading levels in the bond market, so it's almost a given that rates will move in the same direction as bond yields on any given day. But for a variety of reasons, it doesn't happen like that every day. Today was just such a day.Tuesday:
...
Keep in mind that we're talking about extremely small movement. Between Friday and today, you'd likely see the exact same "note rate" for any given conventional 30yr fixed scenario. The improvements would only be detectable in the form of upfront costs. [30 year fixed 3.07%]
emphasis added
• At 6:00 AM ET, NFIB Small Business Optimism Index for October.
• At 8:30 AM, The Producer Price Index for October from the BLS. The consensus is for a 0.6% increase in PPI, and a 0.5% increase in core PPI.
• At 11:00 AM, NY Fed: Q3 Quarterly Report on Household Debt and Credit
November 8th COVID-19: New Cases Stuck at 70,000+ per Day
by Calculated Risk on 11/08/2021 06:00:00 PM
| COVID Metrics | ||||
|---|---|---|---|---|
| Today | Week Ago | Goal | ||
| Percent fully Vaccinated | 58.4% | 58.0% | ≥70.0%1 | |
| Fully Vaccinated (millions) | 193.8 | 192.5 | ≥2321 | |
| New Cases per Day3🚩 | 71,867 | 71,470 | ≤5,0002 | |
| Hospitalized3 | 38,570 | 43,574 | ≤3,0002 | |
| Deaths per Day3 | 1,068 | 1,176 | ≤502 | |
| 1 Minimum to achieve "herd immunity" (estimated between 70% and 85%). 2my goals to stop daily posts, 37 day average for Cases, Currently Hospitalized, and Deaths 🚩 Increasing 7 day average week-over-week for Cases, Hospitalized, and Deaths ✅ Goal met. | ||||
IMPORTANT: For "herd immunity" most experts believe we need 70% to 85% of the total population fully vaccinated (or already had COVID). Note: COVID will probably stay endemic (at least for some time).
The following 20 states have between 50% and 59.9% fully vaccinated: Wisconsin at 58.7%, Nebraska, Iowa, Illinois, Michigan, Kentucky, South Dakota, Texas, Arizona, Kansas, Nevada, Alaska, Utah, North Carolina, Ohio, Montana, Oklahoma, South Carolina, Indiana, and Missouri at 50.1%.
Next up (total population, fully vaccinated according to CDC) are Georgia at 48.6%, Arkansas at 48.4%, Louisiana at 48.0%, and Tennessee at 48.0%.
 Click on graph for larger image.
This graph shows the daily (columns) and 7 day average (line) of positive tests reported.
MBA Survey: "Share of Mortgage Loans in Forbearance Decreases to 2.06%"
by Calculated Risk on 11/08/2021 04:00:00 PM
Note: This is as of October 31st.
From the MBA: Share of Mortgage Loans in Forbearance Decreases to 2.06%
The Mortgage Bankers Association’s (MBA) latest Forbearance and Call Volume Survey revealed that the total number of loans now in forbearance decreased by 9 basis points from 2.15% of servicers’ portfolio volume in the prior week to 2.06% as of October 31, 2021. According to MBA’s estimate, 1 million homeowners are in forbearance plans.
The share of Fannie Mae and Freddie Mac loans in forbearance decreased 5 basis points to 0.92%. Ginnie Mae loans in forbearance decreased 13 basis points to 2.52%, and the forbearance share for portfolio loans and private-label securities (PLS) declined 13 basis points to 5.00%. The percentage of loans in forbearance for independent mortgage bank (IMB) servicers decreased 15 basis points relative to the prior week to 2.28%, and the percentage of loans in forbearance for depository servicers decreased 5 basis points to 2.02%.
“One million homeowners remained in forbearance as we reached the end of October, but the forbearance share continued to decline, with larger declines for portfolio and PLS loans,” said Mike Fratantoni, MBA’s Senior Vice President and Chief Economist. “More borrowers who exited forbearance the last week of October went into modifications, a sign that they have not yet regained their pre-pandemic level of income.”
Added Fratantoni, “The strong job market report from October, with another drop in the unemployment rate and a pickup in wage growth, is a positive sign for homeowners still struggling to get back on their feet.”
emphasis added
 Click on graph for larger image.
This graph shows the percent of portfolio in forbearance by investor type over time. The number of forbearance plans is decreasing rapidly recently since many homeowners have reached the end of the 18-month term.


