by Calculated Risk on 11/18/2021 03:17:00 PM
Thursday, November 18, 2021
Lawler: Investors, Second Homes, and AMH, oh my!
From housing economist Tom Lawler:
Investor Share of Home Purchases Surges
Recent reports from Redfin and Corelogic indicate that the investor share of home purchases has surged this year.
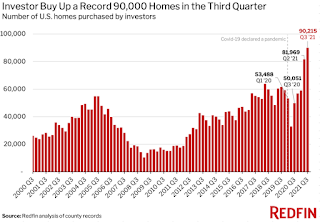
Here is a chart from a Redfin report released on November 15th.

Redfin identified an “investor” as follows:
We define an investor as any buyer whose name includes at least one of the following keywords: LLC, Inc, Trust, Corp, Homes. We also define an investor as any buyer whose ownership code on a purchasing deed includes at least one of the following keywords: association, corporate trustee, company, joint venture, corporate trust. This data may include purchases made through family trusts for personal use.Using this methodology, Redfin would probably miss small, “mom and pop” investors.
Redfin also noted that the share of investor purchases that were single-family homes hit a record high last quarter, and that lower-priced homes made up a significantly lower share of investor purchases than in previous quarters.
In a report released October 6th, Corelogic issued a report showing that the investor share of home purchases surged to a record high in the second quarter of the year (their data only go through June).
Here are the data from a chart in their report.
 CoreLogic’s share of investor purchases is larger than Redfin’s, apparently because their methodology identifies smaller investors while Redfin’s does not.
CoreLogic also noted that there has been an especially large increase in “large” investor purchases, and that investors purchases of higher priced homes had increased significantly.
These data seem to confirm anecdotal reports of huge investments in private equity and other institutional investors in the single-family rental market this year.
What is interesting, and perhaps a bit disturbing, about these data is that the surge in investor buying happened (1) AFTER home prices had surged; and (2) at a time when the inventory of homes for sale was exceptionally low.
Second Home Buying Off from Post-Pandemic High But Still Way Above Pre-Pandemic Levels
In a recently-released report, Redfin using analysis of mortgage-rate lock data from real estate analytics firm Optimal Blue, said that “(d)emand for second homes was up 70% from pre-pandemic levels in October, outpacing August’s 48% gain but below January’s record 91% growth.”
Here is a chart from that report.
 Note that this “demand index” is based on mortgage rate-lock data. Since the share of second home purchases that are cash-financed is typically fairly high, the index may not fully reflect trends in second home purchases.
I’ll have more on these topics later. However these data suggest that the astonishingly strong rebound in the housing market following the onset of the pandemic is not solely due to, and perhaps not much related to, “demographics.”
American Home 4 Rent (ticker AMH) Strategic Strategy: Grow, Grow, Grow (from a November Investor Presentation)
American Homes 4 Rent, one of the largest publicly-traded companies in the single-family rental market that has embarked on an aggressive “build-to-rent” program, included the following data in its November “Investor Highlights” report.
| 2018 | 2019 | 2020 | 2021(3) | |
|---|---|---|---|---|
| Total | 2,351 | 1,379 | 2,592 | 4,650 |
| National Builders | 408 | 148 | 381 | 350 |
| Traditional Acquisitions | 1,552 | 286 | 564 | 2,250 |
| AMH Development | 391 | 945 | 1,647 | 2,050 |
| AMH Land Development Pipeline (Lots Owned or Controlled) | |
|---|---|
| 2016 | 217 |
| 2017 | 2,046 |
| 2018 | 4,203 |
| 2019 | 6,377 |
| 2020 | 8,954 |
| 2021(e) | 16,000 |
Housing Predictions: Guesses and the Data
by Calculated Risk on 11/18/2021 12:08:00 PM
Today, in the Real Estate Newsletter: Housing Predictions: Guesses and the Data
Excerpt:
Currently my view is house prices seem too high, but lending has been reasonably solid, and there are some fundamental reasons for the high house prices (See: The Housing Conundrum)You can subscribe at https://calculatedrisk.substack.com/ (Currently all content is available for free, but please subscribe).
If inventory stays low, then house prices will continue to rise fairly quickly (although it appears house price growth is slowing). Double digit house price increases aren’t sustainable, so the question I’m asking now is: What will cause inventories to increase?
I’m considering three possibilities: 1) mortgage rates rise fairly quickly, slowing demand, 2) economic problems in China spillover into the US, and 3) unregulated areas of finance cause economic problems.
...
This is something I mentioned on my blog in 2013:Each new generation of Wall Street wizards figures out a new way to turn lead into gold, and to become wealthy while damaging the financial system. Some of these wizards are probably perfecting their financial alchemy right now....
The most likely cause of higher home inventories will be higher mortgage rates, but unregulated areas of finance are always a concern and something I’ll be watching.
Hotels: Occupancy Rate Down 4% Compared to Same Week in 2019
by Calculated Risk on 11/18/2021 10:54:00 AM
Note: Since occupancy declined sharply at the onset of the pandemic, CoStar is comparing to 2019.
U.S. hotel performance increased slightly from the previous week, according to STR‘s latest data through November 13.The following graph shows the seasonal pattern for the hotel occupancy rate using the four week average.
November 7-13, 2021 (percentage change from comparable week in 2019*):
• Occupancy: 61.6% (-3.9%)
• Average daily rate (ADR): $129.98 (+2.6%)
• Revenue per available room (RevPAR): $80.02 (-1.4%)
*Due to the steep, pandemic-driven performance declines of 2020, STR is measuring recovery against comparable time periods from 2019.
emphasis added
 Click on graph for larger image.
The red line is for 2021, black is 2020, blue is the median, dashed purple is 2019, and dashed light blue is for 2009 (the worst year on record for hotels prior to 2020).
Weekly Initial Unemployment Claims at 268,000
by Calculated Risk on 11/18/2021 08:34:00 AM
The DOL reported:
In the week ending November 13, the advance figure for seasonally adjusted initial claims was 268,000, a decrease of 1,000 from the previous week's revised level. This is the lowest level for initial claims since March 14, 2020 when it was 256,000. The previous week's level was revised up by 2,000 from 267,000 to 269,000. The 4-week moving average was 272,750, a decrease of 5,750 from the previous week's revised average. This is the lowest level for this average since March 14, 2020 when it was 225,500. The previous week's average was revised up by 500 from 278,000 to 278,500.The following graph shows the 4-week moving average of weekly claims since 1971.
emphasis added
 Click on graph for larger image.
The dashed line on the graph is the current 4-week average. The four-week average of weekly unemployment claims decreased to 272,750.
The previous week was revised up.
Regular state continued claims decreased to 2,080,000 (SA) from 2,209,000 (SA) the previous week.
Weekly claims were above consensus forecast.
Wednesday, November 17, 2021
Thursday: Unemployment Claims, Philly Fed Mfg
by Calculated Risk on 11/17/2021 08:21:00 PM
Thursday:
• At 8:30 AM ET, The initial weekly unemployment claims report will be released. The consensus is for 260 thousand initial claims, down from 267 thousand last week.
• Also at 8:30 AM, the Philly Fed manufacturing survey for November. The consensus is for a reading of 24.0, up from 23.8.
• At 11:00 AM, the Kansas City Fed manufacturing survey for November.
November 17th COVID-19: New Cases and Hospitalizations Increasing
by Calculated Risk on 11/17/2021 05:39:00 PM
| COVID Metrics | ||||
|---|---|---|---|---|
| Today | Week Ago | Goal | ||
| Percent fully Vaccinated | 58.9% | 58.5% | ≥70.0%1 | |
| Fully Vaccinated (millions) | 195.6 | 194.4 | ≥2321 | |
| New Cases per Day3🚩 | 85,944 | 74,751 | ≤5,0002 | |
| Hospitalized3🚩 | 40,408 | 40,277 | ≤3,0002 | |
| Deaths per Day3 | 1,028 | 1,091 | ≤502 | |
| 1 Minimum to achieve "herd immunity" (estimated between 70% and 85%). 2my goals to stop daily posts, 37 day average for Cases, Currently Hospitalized, and Deaths 🚩 Increasing 7 day average week-over-week for Cases, Hospitalized, and Deaths ✅ Goal met. | ||||
IMPORTANT: For "herd immunity" most experts believe we need 70% to 85% of the total population fully vaccinated (or already had COVID). Note: COVID will probably stay endemic (at least for some time).
The following 19 states have between 50% and 59.9% fully vaccinated: Wisconsin at 59.0%, Nebraska, Iowa, Utah, Michigan, Texas, Kansas, Arizona, Nevada, South Dakota, North Carolina, Alaska, Ohio, Kentucky, Montana, Oklahoma, South Carolina, Missouri and Indiana at 50.3%.
Next up (total population, fully vaccinated according to CDC) are Tennessee at 49.1%, Georgia at 49.0%, Arkansas at 48.8%, Louisiana at 48.4% and North Dakota at 48.3%.
 Click on graph for larger image.
This graph shows the daily (columns) and 7 day average (line) of positive tests reported.
AIA: "Demand for design services moderates but remains strong" in October
by Calculated Risk on 11/17/2021 11:20:00 AM
Note: This index is a leading indicator primarily for new Commercial Real Estate (CRE) investment.
From the AIA: Demand for design services moderates but remains strong
Architecture firms reported increasing demand for design services in October, according to a new report today from The American Institute of Architects (AIA).
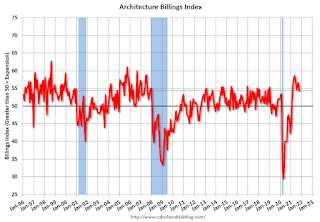
The ABI score for October was 54.3. While this score is down slightly from September’s score of 56.6, it still indicates very strong business conditions overall (any score above 50 indicates an increase in billings from the prior month). During October, scoring for both the new project inquiries and design contracts expanded, posting scores of 62.9 and 58.0 respectively.
“Unlike the economy-wide payroll figures, architecture services employment has surpassed its pre-pandemic high,” said AIA Chief Economist, Kermit Baker, Hon. AIA, PhD. “Staffing continues to be a growing concern at architecture firms and may serve to limit their ability to take on new projects.”
...
• Regional averages: Midwest (61.9); South (58.2); West (53.4); Northeast (48.6)
• Sector index breakdown: mixed practice (58.7); commercial/industrial (57.4); multi-family residential (55.8); institutional (51.4)
emphasis added
 Click on graph for larger image.
This graph shows the Architecture Billings Index since 1996. The index was at 54.3 in October, down from 56.6 in September. Anything above 50 indicates expansion in demand for architects' services.
Note: This includes commercial and industrial facilities like hotels and office buildings, multi-family residential, as well as schools, hospitals and other institutions.
This index was below 50 for eleven consecutive months, but has been solidly positive for the last nine months.
Most Housing Units Under Construction Since 1974
by Calculated Risk on 11/17/2021 09:02:00 AM
Today, in the Real Estate Newsletter: Most Housing Units Under Construction Since 1974
Excerpt:
The fourth graph shows starts under construction, Seasonally Adjusted (SA).You can subscribe at https://calculatedrisk.substack.com/ (Currently all content is available for free, but please subscribe).
Red is single family units. Currently there are 726 thousand single family units under construction (SA). This is the highest level since 2007.
For single family, most of these homes are already sold (Census counts sales when contract is signed). The reason there are so many homes is probably due to construction delays. Since most of these are already sold, it is unlikely this is “overbuilding”, or that this will impact prices.
Blue is for 2+ units. Currently there are 725 thousand multi-family units under construction. This is the highest level since 1974! For multi-family, construction delays are probably also a factor. The completion of these units should help with rent pressure.
Census will release data next year on the length of time from start to completion, and that will probably show long delays in 2021. In 2020, it took an average of 6.8 months from start to completion for single family homes, and 15.4 months for buildings with 2 or more units.
Combined, there are 1.451 million units under construction. This is the most since 1974.
Housing Starts Decreased to 1.520 Million Annual Rate in October
by Calculated Risk on 11/17/2021 08:37:00 AM
From the Census Bureau: Permits, Starts and Completions
Housing Starts:
Privately‐owned housing starts in October were at a seasonally adjusted annual rate of 1,520,000. This is 0.7 percent below the revised September estimate of 1,530,000, but is 0.4 percent above the October 2020 rate of 1,514,000. Single‐family housing starts in October were at a rate of 1,039,000; this is 3.9 percent below the revised September figure of 1,081,000. The October rate for units in buildings with five units or more was 470,000.
Building Permits:
Privately‐owned housing units authorized by building permits in October were at a seasonally adjusted annual rate of 1,650,000. This is 4.0 percent above the revised September rate of 1,586,000 and is 3.4 percent above the October 2020 rate of 1,595,000. Single‐family authorizations in October were at a rate of 1,069,000; this is 2.7 percent above the revised September figure of 1,041,000. Authorizations of units in buildings with five units or more were at a rate of 528,000 in October.
emphasis added
 Click on graph for larger image.
The first graph shows single and multi-family housing starts for the last several years.
Multi-family starts (blue, 2+ units) increased in October compared to September. Multi-family starts were up 37% year-over-year in October.
Single-family starts (red) decreased in October, and were down 10.6% year-over-year.
 The second graph shows single and multi-family housing starts since 1968.
 This shows the huge collapse following the housing bubble, and then the eventual recovery (but still not historically high).
Total housing starts in October were below expectations, and starts in August and September were revised down, combined.
I'll have more later …
MBA: Mortgage Applications Decrease in Latest Weekly Survey
by Calculated Risk on 11/17/2021 07:00:00 AM
From the MBA: Mortgage Applications Decrease in Latest MBA Weekly Survey
Mortgage applications decreased 2.8 percent from one week earlier, according to data from the Mortgage Bankers Association’s (MBA) Weekly Mortgage Applications Survey for the week ending November 12, 2021.
... The Refinance Index decreased 5 percent from the previous week and was 31 percent lower than the same week one year ago. The seasonally adjusted Purchase Index increased 2 percent from one week earlier. The unadjusted Purchase Index decreased 2 percent compared with the previous week and was 6 percent lower than the same week one year ago.
“Refinance applications decreased for the seventh time in eight weeks, as mortgage rates moved higher after two weeks of declines. Activity has been particularly sensitive to rate movements, and last week’s decline was driven by a drop in conventional and FHA refinance applications, which offset an increase in VA refinance applications. All mortgage rates in MBA’s survey increased, with the 30-year fixed rate climbing to 3.2 percent.” said Joel Kan, MBA’s Associate Vice President of Economic and Industry Forecasting. “Purchase applications increased for both conventional and government loan segments, as housing demand continues to show resiliency at a time – late fall – when home buying activity typically slows. The second straight increase in purchase applications suggests that stronger sales activity may continue in the weeks to come. Despite elevated demand, purchase applications were 5.7 percent lower than a year ago.”
...
The average contract interest rate for 30-year fixed-rate mortgages with conforming loan balances ($548,250 or less) increased to 3.20 percent from 3.16 percent, with points increasing to 0.43 from 0.34 (including the origination fee) for 80 percent loan-to-value ratio (LTV) loans.
emphasis added
 Click on graph for larger image.
The first graph shows the refinance index since 1990.
With relatively low rates, the index remains somewhat elevated.
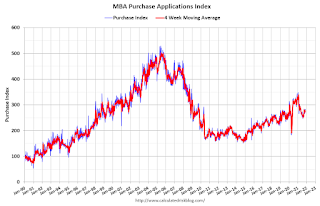
The second graph shows the MBA mortgage purchase index
 According to the MBA, purchase activity is down 6% year-over-year unadjusted.
Note: Red is a four-week average (blue is weekly).


