by Calculated Risk on 12/01/2021 11:53:00 AM
Wednesday, December 01, 2021
Real House Prices, Price-to-Rent Ratio and Affordability in September
Today, in the Real Estate Newsletter: Real House Prices, Price-to-Rent Ratio and Price-to-Median Income in September; And a look at "Affordability"
Excerpt (there is much more):
In October 2004, Fed economist John Krainer and researcher Chishen Wei wrote a Fed letter on price to rent ratios: House Prices and Fundamental Value. Kainer and Wei presented a price-to-rent ratio using the OFHEO house price index and the Owners' Equivalent Rent (OER) from the BLS.
Here is a similar graph using the Case-Shiller National and Composite 20 House Price Indexes. This graph shows the price to rent ratio (January 2000 = 1.0). The price-to-rent ratio had been moving more sideways but picked up significantly recently.
On a price-to-rent basis, the Case-Shiller National index is back to January 2006 levels, and the Composite 20 index is back to March 2005 levels.
Construction Spending Increased 0.2% in October
by Calculated Risk on 12/01/2021 10:18:00 AM
From the Census Bureau reported that overall construction spending increased 0.2%:
Construction spending during October 2021 was estimated at a seasonally adjusted annual rate of $1,598.0 billion, 0.2 percent above the revised September estimate of $1,594.8 billion. The October figure is 8.6 percent above the October 2020 estimate of $1,471.7 billion.Private spending decreased and public spending increased:
emphasis added
Spending on private construction was at a seasonally adjusted annual rate of $1,245.0 billion, 0.2 percent below the revised September estimate of $1,247.9 billion....
In October, the estimated seasonally adjusted annual rate of public construction spending was $353.0 billion, 1.8 percent above the revised September estimate of $346.8 billion.
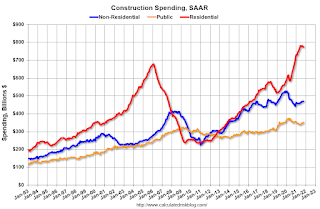
 Click on graph for larger image.
This graph shows private residential and nonresidential construction spending, and public spending, since 1993. Note: nominal dollars, not inflation adjusted.
Residential spending is 14% above the bubble peak (in nominal terms - not adjusted for inflation).
Non-residential spending is 13% above the bubble era peak in January 2008 (nominal dollars), but has been soft recently.
Public construction spending is 8% above the peak in March 2009.
 The second graph shows the year-over-year change in construction spending.
On a year-over-year basis, private residential construction spending is up 16.7%. Non-residential spending is up 3.1% year-over-year. Public spending is up 0.4% year-over-year.
Construction was considered an essential service during the early months of the pandemic in most areas, and did not decline sharply like many other sectors. However, some sectors of non-residential have been under pressure. For example, lodging is down 32.4% YoY.
ISM® Manufacturing index increased to 61.1% in November
by Calculated Risk on 12/01/2021 10:04:00 AM
(Posted with permission). The ISM manufacturing index indicated expansion in November. The PMI® was at 61.1% in November, down from 60.8% in October. The employment index was at 53.3%, up from 52.0% last month, and the new orders index was at 61.5%, up from 59.8%.
From ISM: Manufacturing PMI® at 61.1% November 2021 Manufacturing ISM® Report On Business®
Economic activity in the manufacturing sector grew in November, with the overall economy achieving an 18th consecutive month of growth, say the nation’s supply executives in the latest Manufacturing ISM® Report On Business®.This was at expectations, and this suggests manufacturing expanded at a slightly faster pace in November than in October.
The report was issued today by Timothy R. Fiore, CPSM, C.P.M., Chair of the Institute for Supply Management® (ISM®) Manufacturing Business Survey Committee:
“The November Manufacturing PMI® registered 61.1 percent, an increase of 0.3 percentage point from the October reading of 60.8 percent. This figure indicates expansion in the overall economy for the 18th month in a row after a contraction in April 2020. The New Orders Index registered 61.5 percent, up 1.7 percentage points compared to the October reading of 59.8 percent. The Production Index registered 61.5 percent, an increase of 2.2 percentage points compared to the October reading of 59.3 percent. The Prices Index registered 82.4 percent, down 3.3 percentage points compared to the October figure of 85.7 percent. The Backlog of Orders Index registered 61.9 percent, 1.7 percentage points lower than the October reading of 63.6 percent. The Employment Index registered 53.3 percent, 1.3 percentage points higher compared to the October reading of 52 percent. The Supplier Deliveries Index registered 72.2 percent, down 3.4 percentage points from the October figure of 75.6 percent. The Inventories Index registered 56.8 percent, 0.2 percentage point lower than the October reading of 57 percent. The New Export Orders Index registered 54 percent, a decrease of 0.6 percentage point compared to the October reading of 54.6 percent. The Imports Index registered 52.6 percent, a 3.5-percentage point increase from the October reading of 49.1 percent.”
emphasis added
ADP: Private Employment increased 534,000 in November
by Calculated Risk on 12/01/2021 08:19:00 AM
Private sector employment increased by 534,000 jobs from October to November according to the November ADP® National Employment ReportTM. Broadly distributed to the public each month, free of charge, the ADP National Employment Report is produced by the ADP Research Institute® in collaboration with Moody’s Analytics. The report, which is derived from ADP’s actual data of those who are on a company’s payroll, measures the change in total nonfarm private employment each month on a seasonally-adjusted basisThis was close to the consensus forecast of 525,000 for this report.
“The labor market recovery continued to power through its challenges last month,” said Nela Richardson, chief economist, ADP. “November’s job gains bring the three month average to 543,000 monthly jobs added, a modest uptick from the job pace earlier this year. Job gains have eclipsed 15 million since the recovery began, though 5 million jobs short of pre-pandemic levels. Service providers, which are more vulnerable to the pandemic, have dominated job gains this year. It’s too early to tell if the Omicron variant could potentially slow the jobs recovery in coming months.”
emphasis added
The BLS report will be released Friday, and the consensus is for 563 thousand non-farm payroll jobs added in November. The ADP report has not been very useful in predicting the BLS report.
MBA: Mortgage Applications Decrease in Latest Weekly Survey
by Calculated Risk on 12/01/2021 07:00:00 AM
From the MBA: Mortgage Applications Decrease in Latest MBA Weekly Survey
Mortgage applications decreased 7.2 percent from one week earlier, according to data from the Mortgage Bankers Association’s (MBA) Weekly Mortgage Applications Survey for the week ending November 26, 2021. This week’s results include an adjustment for the Thanksgiving holiday.
... The Refinance Index decreased 15 percent from the previous week and was 41 percent lower than the same week one year ago. The seasonally adjusted Purchase Index increased 5 percent from one week earlier. The unadjusted Purchase Index decreased 30 percent compared with the previous week and was 8 percent lower than the same week one year ago.
“Mortgage rates rose for the third week in a row, reducing the refinance incentive for many borrowers. The 30-year fixed rate hit 3.31 percent – the highest since this April – and led to refinance applications falling more than 14 percent. Over the past three weeks, rates are up 15 basis points and refinance activity has declined over 18 percent,” said Joel Kan, MBA’s Associate Vice President of Economic and Industry Forecasting. “Despite higher mortgage rates, purchase applications had a strong week, mostly driven by a 6 percent increase in conventional loan applications. Conventional loans tend to be larger than government loans, and this was evident in the average loan amount, which increased to $414,700 – the highest since February 2021. As home-price appreciation continues at a double-digit pace, buyers of newer, pricier homes continue to dominate purchase activity, while the share of first-time buyer activity remains depressed.”
...
The average contract interest rate for 30-year fixed-rate mortgages with conforming loan balances ($548,250 or less) increased to 3.31 percent from 3.24 percent, with points increasing to 0.43 from 0.36 (including the origination fee) for 80 percent loan-to-value ratio (LTV) loans.
emphasis added
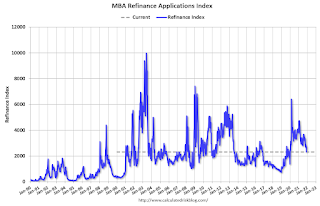
 Click on graph for larger image.
The first graph shows the refinance index since 1990.
With relatively low rates, the index remains slightly elevated, but down sharply from last year - and at the lowest level since January 2020.
The second graph shows the MBA mortgage purchase index
 According to the MBA, purchase activity is down 8% year-over-year unadjusted.
Note: Red is a four-week average (blue is weekly).
Tuesday, November 30, 2021
Wednesday: ADP Employment, ISM Manufacturing, Construction Spending, Beige Book, Vehicle Sales
by Calculated Risk on 11/30/2021 09:01:00 PM
Wednesday:
• At 7:00 AM ET, The Mortgage Bankers Association (MBA) will release the results for the mortgage purchase applications index.
• At 8:15 AM, The ADP Employment Report for November. This report is for private payrolls only (no government). The consensus is for 525,000 jobs added, down from 571,000 in October.
• At 10:00 AM, ISM Manufacturing Index for November. The consensus is for 61.0%, up from 60.8%.
• Also at 10:00 AM, Construction Spending for October. The consensus is for 0.4% increase in spending.
• At 2:00 PM, the Federal Reserve Beige Book, an informal review by the Federal Reserve Banks of current economic conditions in their Districts.
• All day, Light vehicle sales for November. The consensus is for 13.2 million SAAR in November, up from the BEA estimate of 13.0 million SAAR in October (Seasonally Adjusted Annual Rate).
November 30th COVID-19: Holiday Impacted Data
by Calculated Risk on 11/30/2021 07:43:00 PM
| COVID Metrics | ||||
|---|---|---|---|---|
| Today | Week Ago | Goal | ||
| Percent fully Vaccinated | 59.4% | --- | ≥70.0%1 | |
| Fully Vaccinated (millions) | 197.1 | --- | ≥2321 | |
| New Cases per Day3 | 80,178 | 93,674 | ≤5,0002 | |
| Hospitalized3 | 41,442 | 42,596 | ≤3,0002 | |
| Deaths per Day3 | 804 | 977 | ≤502 | |
| 1 Minimum to achieve "herd immunity" (estimated between 70% and 85%). 2my goals to stop daily posts, 37-day average for Cases, Currently Hospitalized, and Deaths 🚩 Increasing 7-day average week-over-week for Cases, Hospitalized, and Deaths ✅ Goal met. | ||||
IMPORTANT: For "herd immunity" most experts believe we need 70% to 85% of the total population fully vaccinated (or already had COVID). Note: COVID will probably stay endemic (at least for some time).
The following 19 states have between 50% and 59.9% fully vaccinated: Wisconsin at 59.5%, Nebraska, Iowa, Utah, Michigan, Texas, Kansas, Arizona, Nevada, South Dakota, North Carolina, Alaska, Ohio, Kentucky, Montana, Oklahoma, South Carolina, Missouri and Indiana at 50.6%.
Next up (total population, fully vaccinated according to CDC) are Georgia at 49.6%, Tennessee at 49.5%, Arkansas at 49.3%, Louisiana at 48.9% and North Dakota at 48.8%.
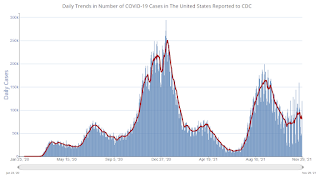
 Click on graph for larger image.
This graph shows the daily (columns) and 7-day average (line) of positive tests reported.
Fannie Mae: Mortgage Serious Delinquency Rate Decreased in October
by Calculated Risk on 11/30/2021 04:11:00 PM
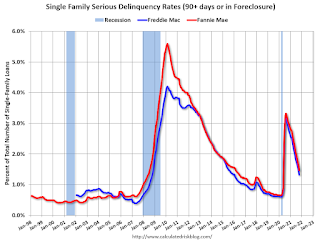
Fannie Mae reported that the Single-Family Serious Delinquency decreased to 1.46% in October, from 1.62% in September. The serious delinquency rate is down from 3.05% in October 2020.
These are mortgage loans that are "three monthly payments or more past due or in foreclosure".
The Fannie Mae serious delinquency rate peaked in February 2010 at 5.59% following the housing bubble, and peaked at 3.32% in August 2020 during the pandemic.

By vintage, for loans made in 2004 or earlier (1% of portfolio), 4.02% are seriously delinquent (down from 4.25% in September). For loans made in 2005 through 2008 (2% of portfolio), 6.90% are seriously delinquent (down from 7.21%), For recent loans, originated in 2009 through 2021 (97% of portfolio), 1.17% are seriously delinquent (down from 1.31%). So, Fannie is still working through a few poor performing loans from the bubble years.
Mortgages in forbearance are counted as delinquent in this monthly report, but they will not be reported to the credit bureaus.
This is very different from the increase in delinquencies following the housing bubble. Lending standards have been fairly solid over the last decade, and most of these homeowners have equity in their homes - and they will be able to restructure their loans once they are employed.
Freddie Mac reported earlier.
Las Vegas Visitor Authority for October: Visitor Traffic Down 7.6% Compared to 2019
by Calculated Risk on 11/30/2021 02:31:00 PM
From the Las Vegas Visitor Authority: October 2021 Las Vegas Visitor Statistics
With significant events and an improving convention segment, October saw the strongest visitation of the pandemic era both on weekends and midweek as the destination welcomed nearly 3.4M visitors (up 15.5% MoM and down ‐7.6% from Oct 2019).
Hotel occupancy reached 81.6% for the month (up 8.6 pts MoM, down ‐8.4 pts vs. Oct 2019), as Weekend occupancy reached 90.4% (up 1.3 pts MoM) while Midweek occupancy improved from the prior month to 77.5% (up 11.4 pts MoM).
October room rates approached $174, significantly ahead of last month and Oct 2019 (up 11.5% MoM and up 28.3% vs. Oct 2019) while RevPAR neared $142, up 24.6% MoM and 16.4% ahead of Oct 2019.
 Click on graph for larger image.
 Thist graph shows visitor traffic for 2019 (blue), 2020 (orange) and 2021 (red).
Visitor traffic was down 7.6% compared to the same month in 2019.
FDIC: Problem Banks Declined, Residential REO Declined in Q3
by Calculated Risk on 11/30/2021 12:41:00 PM
The FDIC released the Quarterly Banking Profile for Q3 2021 this morning:
Quarterly net income rose $18.4 billion (35.9 percent) to $69.5 billion from the same period one year ago.
...
Total assets increased $462.6 billion (2 percent) from second quarter 2021 to $23.3 trillion. Securities rose $225 billion (3.9 percent), while cash and balances due from depository institutions rose $126.8 billion (3.6 percent). Growth in mortgage-backed securities (up $101.9 billion, or 3 percent) and U.S. Treasury securities (up $99.3 billion, or 8.5 percent) continued to drive quarterly increases in total securities. Loans and securities with maturities longer than 5 years now make up almost a third (31.3 percent) of total assets, up from 28 percent in fourth quarter 2019.
Loans that were 90 days or more past due or in nonaccrual status (i.e., noncurrent loans) continued to decline (down $13.2 billion, or 10.8 percent) from first quarter 2021. The noncurrent rate for total loans declined 12 basis points from the previous quarter to 1.01 percent. Net charge-offs also continued to decline (down $8.3 billion, or 53.2 percent) from a year ago. The total net charge-off rate dropped 30 basis points to 0.27 percent—the lowest level on record.
emphasis added
 Click on graph for larger image.
The FDIC reported the number of problem banks declined to 46.
The number of FDIC-insured institutions declined from 4,951 in second quarter 2021 to 4,914. During third quarter 2021, three new banks opened, 39 institutions merged with other FDIC-insured institutions, one bank ceased operations, and no banks failed. The number of banks on the FDIC’s “Problem Bank List” declined by ten from second quarter to 46, the lowest level since QBP data collection began in 1984. Total assets of problem banks increased $4.8 billion (10.5 percent) from second quarter to $50.6 billion.This graph from the FDIC shows the number of problem banks and assets at 51 institutions.
Note: The number of assets for problem banks increased significantly back in 2018 when Deutsche Bank Trust Company Americas was added to the list (it must still be on the list given the assets of problem banks).
 The dollar value of 1-4 family residential Real Estate Owned (REOs, foreclosure houses) declined from $1.37 billion in Q3 2020 to $0.79 billion in Q3 2021. This is the lowest level of REOs in many years. (Probably declined sharply due to foreclosure moratoriums, forbearance programs and house price increases).
This graph shows the nominal dollar value of Residential REO for FDIC insured institutions. Note: The FDIC reports the dollar value and not the total number of REOs.


