by Calculated Risk on 12/03/2021 04:00:00 PM
Friday, December 03, 2021
December 3rd COVID-19: Cases, Hospitalizations and Deaths Increasing
| COVID Metrics | ||||
|---|---|---|---|---|
| Today | Week Ago | Goal | ||
| Percent fully Vaccinated | 59.7% | --- | ≥70.0%1 | |
| Fully Vaccinated (millions) | 198.2 | --- | ≥2321 | |
| New Cases per Day3🚩 | 96,425 | 87,986 | ≤5,0002 | |
| Hospitalized3🚩 | 48,610 | 44,689 | ≤3,0002 | |
| Deaths per Day3🚩 | 975 | 893 | ≤502 | |
| 1 Minimum to achieve "herd immunity" (estimated between 70% and 85%). 2my goals to stop daily posts, 37-day average for Cases, Currently Hospitalized, and Deaths 🚩 Increasing 7-day average week-over-week for Cases, Hospitalized, and Deaths ✅ Goal met. | ||||
IMPORTANT: For "herd immunity" most experts believe we need 70% to 85% of the total population fully vaccinated (or already had COVID). Note: COVID will probably stay endemic (at least for some time).
The following 19 states have between 50% and 59.9% fully vaccinated: Wisconsin at 59.8%, Nebraska, Iowa, Utah, Michigan, Texas, Kansas, Arizona, Nevada, South Dakota, North Carolina, Alaska, Ohio, Kentucky, Montana, Oklahoma, South Carolina, Missouri and Indiana at 50.8%.
Next up (total population, fully vaccinated according to CDC) are Georgia at 49.8%, Tennessee at 49.7%, Arkansas at 49.6%, Louisiana at 49.0% and North Dakota at 49.0%.
 Click on graph for larger image.
This graph shows the daily (columns) and 7-day average (line) of positive tests reported.
Black Knight: Number of Mortgages in Forbearance "Drops Below the Million Mark"
by Calculated Risk on 12/03/2021 01:20:00 PM
This data is as of November 30th.
From Andy Walden at Black Knight: Forbearance Plan Total Drops Below the Million Mark
Daily tracking data through December 1 shows the number of active forbearance plan totals dropping below 1 million for the first time since the start of the pandemic.
According to our McDash Flash daily forbearance tracking dataset, the number of active forbearance plans fell by 23,000 (-2.3%) this week, led by a 14,000 (-3.9%) drop in FHA/VA loans. Both GSE (-7K/-2%) and PLS/portfolio (-2K/-.6%) plan volumes also improved.
As of November 30, 994,000 mortgage holders (1.9%) remain in COVID-19 related forbearance plans, including 1.1% of GSE, 2.9% of FHA/VA and 2.5% of portfolio held and privately securitized loans.
Click on graph for larger image.
Overall, the number of forbearance plans is down by 215,000 (-18%) from the same time last month, with the potential for additional improvements as we progress through December. After seeing starts jump before Thanksgiving, they fell to a pandemic low this week. This week’s low was likely due to the shorter holiday week.
emphasis added
AAR: November Rail Carloads Down Compared to 2019; Intermodal Up Slightly
by Calculated Risk on 12/03/2021 12:21:00 PM
From the Association of American Railroads (AAR) Rail Time Indicators. Graphs and excerpts reprinted with permission.
U.S. railroads originated 917,787 total carloads in November 2021, up 2.0% over November 2020 and down 3.9% from November 2019. The 2.0% gain in November was the ninth straight gain, but it was also the smallest percentage gain in those nine months.
...
U.S. railroads originated 1.03 million intermodal containers and trailers in November, down 9.6% from November 2020 and up 0.8% over November 2019. November 2021 was the fourth straight month in which intermodal volume fell, and the 9.6% decline was the biggest decline in those four months. In 2021, September, October, and November were all in the bottom half of months in terms of intermodal volume, something that has never happened before in our records that go back to 1989.
emphasis added
 Click on graph for larger image.
This graph from the Rail Time Indicators report shows the six week average of U.S. Carloads in 2019, 2020 and 2021:
U.S. railroads originated 917,787 total carloads in November 2021, up 2.0% over November 2020 and down 3.9% from November 2019. Total carloads averaged 229,447 per week in November 2021, the third lowest weekly average for total carloads so far this year. (In part because of Thanksgiving, November is usually in the bottom half of all months in terms of total carloads.)
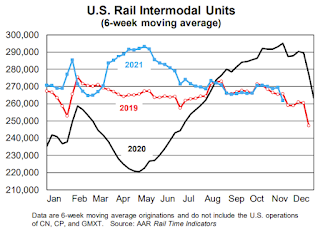
 The second graph shows the six week average (not monthly) of U.S. intermodal in 2019, 2020 and 2021: (using intermodal or shipping containers):
Intermodal is not included in carload figures. In November 2021, U.S. railroads originated 1.03 million containers and trailers, down 9.6% from November 2020 and up 0.8% over November 2019. November 2021 was the fourth straight month in which year-over-year intermodal volume fell; November’s 9.6% decline is the biggest decline in those four months. Intermodal volume averaged 257,010 units per week in November; only February (253,999) was lower so this year.
Comments on November Employment Report
by Calculated Risk on 12/03/2021 09:19:00 AM
The headline jobs number in the November employment report was below expectations, however, employment for the previous two months was revised up by 82,000. The participation rate and employment-population ratio both increased, and the unemployment rate decreased to 4.2%.
Earlier: November Employment Report: 210 thousand Jobs, 4.2% Unemployment Rate
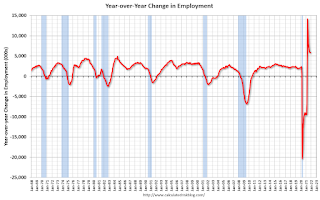
In November, the year-over-year employment change was 5.8 million jobs.
Permanent Job Losers
 Click on graph for larger image.
This graph shows permanent job losers as a percent of the pre-recession peak in employment through the report today. (ht Joe Weisenthal at Bloomberg).
In November, the number of permanent job losers decreased to 1.921 million from 2.126 million in October.
Prime (25 to 54 Years Old) Participation
 Since the overall participation rate has declined due to cyclical (recession) and demographic (aging population, younger people staying in school) reasons, here is the employment-population ratio for the key working age group: 25 to 54 years old.
The prime working age will be key as the economy recovers.
The 25 to 54 participation rate increased in November to 81.8% from 81.7% in October, and the 25 to 54 employment population ratio increased to 78.8% from 78.3% the previous month.
Seasonal Retail Hiring
Typically, retail companies start hiring for the holiday season in October, and really increase hiring in November. Here is a graph that shows the historical net retail jobs added for October, November and December by year.
 This graph really shows the collapse in retail hiring in 2008. Since then, seasonal hiring had increased back close to more normal levels. Note: I expect the long-term trend will be down with more and more internet holiday shopping.
Retailers hired 332 thousand workers Not Seasonally Adjusted (NSA) net in November.
Part Time for Economic Reasons
 From the BLS report:
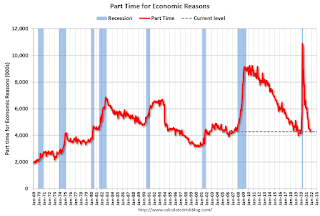
"The number of persons employed part time for economic reasons, at 4.3 million, changed little in November. These individuals, who would have preferred full-time employment, were working part time because their hours had been reduced or they were unable to find full-time jobs. This figure was about the same as in February 2020."The number of persons working part time for economic reasons decreased in November to 4.286 million from 4.423 million in November. This is back to pre-recession levels.
These workers are included in the alternate measure of labor underutilization (U-6) that decreased to 7.8% from 8.3% in the previous month. This is down from the record high in April 22.9% for this measure since 1994. This measure was at 7.0% in February 2020 (pre-pandemic).
Unemployed over 26 Weeks
 This graph shows the number of workers unemployed for 27 weeks or more.
 According to the BLS, there are 2.190 million workers who have been unemployed for more than 26 weeks and still want a job, down from 2.326 million the previous month.
This does not include all the people that left the labor force.
Summary:
The headline monthly jobs number was below expectations; however, the previous two months were revised up by 82,000 combined. And the headline unemployment rate decreased to 4.2%. The household survey indicated a large gain in employment of 1.136 million, and that led to a sharp decrease in the unemployment rate and an increase in the employment-population ratio.
November Employment Report: 210 thousand Jobs, 4.2% Unemployment Rate
by Calculated Risk on 12/03/2021 08:40:00 AM
From the BLS:
Total nonfarm payroll employment rose by 210,000 in November, and the unemployment rate fell by 0.4 percentage point to 4.2 percent, the U.S. Bureau of Labor Statistics reported today. Notable job gains occurred in professional and business services, transportation and warehousing, construction, and manufacturing. Employment in retail trade declined over the month.
...
The change in total nonfarm payroll employment for September was revised up by 67,000, from +312,000 to +379,000, and the change for October was revised up by 15,000, from +531,000 to +546,000. With these revisions, employment in September and October combined is 82,000 higher than previously reported.
emphasis added
 Click on graph for larger image.
The first graph shows the year-over-year change in total non-farm employment since 1968.
In November, the year-over-year change was 5.8 million jobs. This was up significantly year-over-year.
Total payrolls increased by 210 thousand in November. Private payrolls increased by 235 thousand, and public payrolls declined 25 thousand.
Payrolls for September and October were revised up 82 thousand, combined.
 The second graph shows the job losses from the start of the employment recession, in percentage terms.
The current employment recession was by far the worst recession since WWII in percentage terms. However, the current employment recession, 20 months after the onset, is now significantly better than the worst of the "Great Recession".
The third graph shows the employment population ratio and the participation rate.
 The Labor Force Participation Rate increased to 61.8% in November, from 61.6% in October. This is the percentage of the working age population in the labor force.
 The Employment-Population ratio increased to 59.2% from 58.8% (blue line).
I'll post the 25 to 54 age group employment-population ratio graph later.
 The fourth graph shows the unemployment rate.
 The unemployment rate decreased in November to 4.2% from 4.6% in October.
This was well below consensus expectations; however, August and September were revised up by 82,000 combined.
Thursday, December 02, 2021
Friday: Employment Report
by Calculated Risk on 12/02/2021 09:01:00 PM
My November Employment Preview
Goldman November Payrolls Preview
Friday:
• At 8:30 AM ET, Employment Report for November. The consensus is for 563 thousand jobs added, and for the unemployment rate to decrease to 4.5%.
• At 10:00 AM, the ISM Services Index for November.
December 2nd COVID-19: Hospitalizations Increasing
by Calculated Risk on 12/02/2021 07:00:00 PM
| COVID Metrics | ||||
|---|---|---|---|---|
| Today | Week Ago | Goal | ||
| Percent fully Vaccinated | 59.6% | --- | ≥70.0%1 | |
| Fully Vaccinated (millions) | 197.8 | --- | ≥2321 | |
| New Cases per Day3 | 86,412 | 94,393 | ≤5,0002 | |
| Hospitalized3🚩 | 47,714 | 44,556 | ≤3,0002 | |
| Deaths per Day3 | 859 | 983 | ≤502 | |
| 1 Minimum to achieve "herd immunity" (estimated between 70% and 85%). 2my goals to stop daily posts, 37-day average for Cases, Currently Hospitalized, and Deaths 🚩 Increasing 7-day average week-over-week for Cases, Hospitalized, and Deaths ✅ Goal met. | ||||
IMPORTANT: For "herd immunity" most experts believe we need 70% to 85% of the total population fully vaccinated (or already had COVID). Note: COVID will probably stay endemic (at least for some time).
The following 19 states have between 50% and 59.9% fully vaccinated: Wisconsin at 59.7%, Nebraska, Iowa, Utah, Michigan, Texas, Kansas, Arizona, Nevada, South Dakota, North Carolina, Alaska, Ohio, Kentucky, Montana, Oklahoma, South Carolina, Missouri and Indiana at 50.7%.
Next up (total population, fully vaccinated according to CDC) are Georgia at 49.7%, Tennessee at 49.7%, Arkansas at 49.5%, Louisiana at 49.0% and North Dakota at 49.0%.
 Click on graph for larger image.
This graph shows the daily (columns) and 7-day average (line) of positive tests reported.
Goldman November Payrolls Preview
by Calculated Risk on 12/02/2021 04:09:00 PM
A few brief excerpts from a note by Goldman Sachs economist Spencer Hill:
We estimate nonfarm payrolls rose 575k in November ... Big Data employment indicators were mixed in the month, and we also see some chance that labor supply constraints weighed on pre-holiday hiring in the retail industry. ... We estimate a one-tenth drop in the unemployment rate to 4.5%, reflecting a strong household employment gain but a likely rebound in the labor force participation rateCR Note: The consensus is for 563 thousand jobs added, and for the unemployment rate to decrease to 4.5%.
emphasis added
Rents Still Increasing Sharply
by Calculated Risk on 12/02/2021 02:12:00 PM
Today, in the Real Estate Newsletter: Rents Still Increasing Sharply Rent increases slowing seasonally
Excerpt:
The Zillow measure is up 11.2% YoY in October, up from 10.3% YoY in September. And the ApartmentList measure is up 17.7% as of November, up from 16.9% in October. Both the Zillow measure (a repeat rent index), and ApartmentList are showing a sharp increase in rents.
...
Clearly rents are increasing sharply, and we should expect this to spill over into measures of inflation in 2022. The Owners’ Equivalent Rent (OER) was up 3.1% YoY in October, from 2.9% in September - and will increase further in the coming months.
November Employment Preview
by Calculated Risk on 12/02/2021 12:00:00 PM
On Friday at 8:30 AM ET, the BLS will release the employment report for November. The consensus is for 563 thousand jobs added, and for the unemployment rate to decrease to 4.5%.
 Click on graph for larger image.
• First, currently there are still about 4.2 million fewer jobs than in February 2020 (before the pandemic).
This graph shows the job losses from the start of the employment recession, in percentage terms.
The current employment recession was by far the worst recession since WWII in percentage terms. However, the current employment recession, 20 months after the onset, is now significantly better than the worst of the "Great Recession".
• ADP Report: The ADP employment report showed a gain of 534,000 private sector jobs, close to the consensus estimate of 525,000 jobs added. The ADP report hasn't been very useful in predicting the BLS report, but this suggests the BLS report could be close to expectations.
• ISM Surveys: Note that the ISM services are diffusion indexes based on the number of firms hiring (not the number of hires). The ISM® manufacturing employment index increased in November to 53.3%, up from 52.0% last month. This would suggest no change in manufacturing employment in November. ADP showed 50,000 manufacturing jobs added.
The ISM® Services employment index will be released tomorrow.
• Unemployment Claims: The weekly claims report showed a decline in the number of initial unemployment claims during the reference week (includes the 12th of the month) from 291,000 in October to 270,000 in November. This would usually suggest fewer layoffs in October than in September, although this might not be very useful right now. In general, weekly claims have been falling, and have been below expectations in November.
 • Permanent Job Losers: Something to watch in the employment report will be "Permanent job losers". This graph shows permanent job losers as a percent of the pre-recession peak in employment through the June report.
This data is only available back to 1994, so there is only data for three recessions. In October, he number of permanent job losers decreased to 2.126 million from 2.251 million in September. These jobs will likely be the hardest to recover, so it is a positive that the number of permanent job losers is declining rapidly
 • Seasonal Retail Hiring: Typically retail companies start hiring for the holiday season in October, and really increase hiring in November. But only a few temporary workers are hired in December. Here is a graph that shows the historical net retail jobs added for October, November and December by year.
Retailers hired 219 thousand workers Not Seasonally Adjusted (NSA) net in October. This was seasonally adjusted (SA) to a gain of 35 thousand jobs in October.
In 2020, retailers hired 356,800 employees (NSA) in November. That translated to a loss of 2,100 jobs SA.
• Conclusion: There is significant optimism concerning the November employment report, and many analysts are expecting a strong report. We have to be a little cautious because some of the apparent pickup in hiring might be for seasonal retail jobs.


