 RSS Feed
 by Calculated Risk on 12/13/2021 08:20:00 AM
Monday, December 13, 2021
Seven High Frequency Indicators for the Economy
These indicators are mostly for travel and entertainment. It is interesting to watch these sectors recover as the pandemic subsides.
The TSA is providing daily travel numbers.
This data is as of December 12th.
 Click on graph for larger image.
This data shows the 7-day average of daily total traveler throughput from the TSA for 2019 (Light Blue), 2020 (Blue) and 2021 (Red).
The dashed line is the percent of 2019 for the seven-day average.
The 7-day average is down 16.2% from the same day in 2019 (83.8% of 2019). (Dashed line)
Air travel had been off about 20% relative to 2019 for the last four months (with some ups and downs) - but picked up recently, especially over the Thanksgiving holiday week.
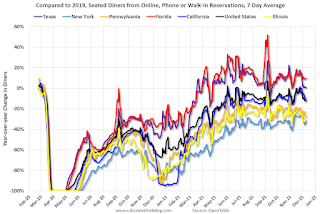
The second graph shows the 7-day average of the year-over-year change in diners as tabulated by OpenTable for the US and several selected cities.
IMPORTANT: OpenTable notes: "we’ve updated the data including downloadable dataset from January 1, 2021 onward to compare seated diners from 2021 to 2019, as opposed to year over year." Thanks!
 Thanks to OpenTable for providing this restaurant data:
This data is updated through December 9, 2021.
This data is "a sample of restaurants on the OpenTable network across all channels: online reservations, phone reservations, and walk-ins. For year-over-year comparisons by day, we compare to the same day of the week from the same week in the previous year."
Note that this data is for "only the restaurants that have chosen to reopen in a given market". Since some restaurants have not reopened, the actual year-over-year decline is worse than shown.
Dining picked up for the Labor Day weekend but declined after the holiday - and is mostly moving sideways. The 7-day average for the US is down 12% compared to 2019.
Thanks to OpenTable for providing this restaurant data:This data is updated through December 9, 2021.
This data is "a sample of restaurants on the OpenTable network across all channels: online reservations, phone reservations, and walk-ins. For year-over-year comparisons by day, we compare to the same day of the week from the same week in the previous year."
Note that this data is for "only the restaurants that have chosen to reopen in a given market". Since some restaurants have not reopened, the actual year-over-year decline is worse than shown.
Dining picked up for the Labor Day weekend but declined after the holiday - and is mostly moving sideways. The 7-day average for the US is down 12% compared to 2019.
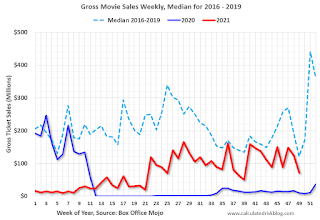 This data shows domestic box office for each week and the median for the years 2016 through 2019 (dashed light blue).
 Blue is 2020 and Red is 2021.
The data is from BoxOfficeMojo through December 2nd.
Note that the data is usually noisy week-to-week and depends on when blockbusters are released.
Movie ticket sales were at $70 million last week, down about 42% from the median for the week.
Note that the data is usually noisy week-to-week and depends on when blockbusters are released.
Movie ticket sales were at $70 million last week, down about 42% from the median for the week.
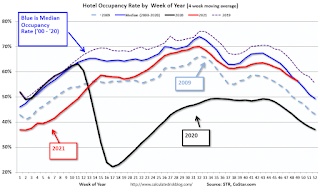 This graph shows the seasonal pattern for the hotel occupancy rate using the four week average.
 The red line is for 2021, black is 2020, blue is the median, dashed purple is 2019, and dashed light blue is for 2009 (the worst year on record for hotels prior to 2020).
This data is through December 4th. The occupancy rate was down 8.8% compared to the same week in 2019. Although down compared to 2019, the 4-week average of the occupancy rate is close to the median rate for the previous 20 years (Blue).
Notes: Y-axis doesn't start at zero to better show the seasonal change.
The occupancy rate will now decline seasonally into the new year.
 This graph, based on weekly data from the U.S. Energy Information Administration (EIA), shows gasoline supplied compared to the same week of 2019.
Blue is for 2020. Red is for 2021.
As of December 3rd, gasoline supplied was up 0.9% compared to the same week in 2019.
This was the 11th week this year that gasoline supplied was up compared to the same week in 2019 - so consumption is running close to 2019 levels now.
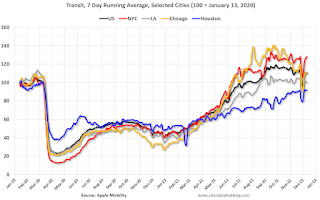
This graph is from Apple mobility. From Apple: "This data is generated by counting the number of requests made to Apple Maps for directions in select countries/regions, sub-regions, and cities." This is just a general guide - people that regularly commute probably don't ask for directions.
There is also some great data on mobility from the Dallas Fed Mobility and Engagement Index. However the index is set "relative to its weekday-specific average over January–February", and is not seasonally adjusted, so we can't tell if an increase in mobility is due to recovery or just the normal increase in the Spring and Summer.
 This data is through December 10th
 for the United States and several selected cities.
The graph is the running 7-day average to remove the impact of weekends.
IMPORTANT: All data is relative to January 13, 2020. This data is NOT Seasonally Adjusted. People walk and drive more when the weather is nice, so I'm just using the transit data.
According to the Apple data directions requests, public transit in the 7-day average for the US is at 111% of the January 2020 level.
New York City is doing well by this metric, but subway usage in NYC is down significantly (next graph).
----- New York City Subway Usage -----
Here is some interesting data on New York subway usage (HT BR).
 This graph is from Todd W Schneider.
Here is some interesting data on New York subway usage (HT BR).
This graph is from Todd W Schneider. This graph shows how much MTA traffic has recovered in each borough (Graph starts at first week in January 2020 and 100 = 2019 average).
Manhattan is at about 44% of normal.
This data is through Friday, December 10th.
He notes: "Data updates weekly from the MTA’s public turnstile data, usually on Saturday mornings".
Sunday, December 12, 2021
Sunday Night Futures
by Calculated Risk on 12/12/2021 07:24:00 PM
Weekend:
• Schedule for Week of December 12, 2021
• FOMC Preview: Accelerated Taper Announcement Expected
Monday:
• No major economic releases scheduled.
From CNBC: Pre-Market Data and Bloomberg futures S&P 500 futures are up 10 and DOW futures are up 90 (fair value).
Oil prices were up over the last week with WTI futures at $72.55 per barrel and Brent at $75.92 per barrel. A year ago, WTI was at $47, and Brent was at $50 - so WTI oil prices are up 50% year-over-year.
Here is a graph from Gasbuddy.com for nationwide gasoline prices. Nationally prices are at $3.32 per gallon. A year ago prices were at $2.14 per gallon, so gasoline prices are up $1.18 per gallon year-over-year.
FOMC Preview: Accelerated Taper Announcement Expected
by Calculated Risk on 12/12/2021 08:11:00 AM
Expectations are the FOMC will announce a faster pace of tapering assets purchases at the meeting this week.
From Goldman Sachs:
"The FOMC is very likely to double the pace of tapering to $30bn per month at its December meeting next week, putting it on track to announce the last two tapers at the January FOMC meeting and to implement the last taper in March. We now expect the FOMC to deliver rate hikes next year in May, July, and November (vs. June, September, and December previously)."Analysts will also be looking for comments on inflation and on rate hikes in 2022.
Wall Street forecasts are for GDP to increase at close to a 6.5% annual rate in Q4 that would put Q4-over-Q4 at around 5.4% - so the FOMC projections for 2021 are now a little on the high side compared to Wall Street.
| GDP projections of Federal Reserve Governors and Reserve Bank presidents, Change in Real GDP1 | ||||
|---|---|---|---|---|
| Projection Date | 2021 | 2022 | 2023 | 2024 |
| Sept 2021 | 5.8 to 6.0 | 3.4 to 4.5 | 2.2 to 2.5 | 2.0 to 2.2 |
| June 2021 | 6.8 to 7.3 | 2.8 to 3.8 | 2.0 to 2.5 | |
The projections for the unemployment rate in Q4 2021 will be revised down.
Note that the unemployment rate doesn't capture the economic damage to the labor market. Not only are there 1.2 million more people currently unemployed than prior to the pandemic, and additional 2.4 million people have left the labor force since February 2020.
2 Projections for the unemployment rate are for the average civilian unemployment rate in the fourth quarter of the year indicated.
As of October 2021, PCE inflation was up 5.0% from October 2020. This is above the top end of the projected range for Q4, and projections will be revised up.
PCE core inflation was up 4.1% in October year-over-year. Core PCE projections will be revised up.
| Unemployment projections of Federal Reserve Governors and Reserve Bank presidents, Unemployment Rate2 | ||||
|---|---|---|---|---|
| Projection Date | 2021 | 2022 | 2023 | 2024 |
| Sept 2021 | 4.6 to 4.8 | 3.6 to 4.0 | 3.3 to 3.7 | 3.3 to 3.6 |
| June 2021 | 4.4 to 4.8 | 3.5 to 4.0 | 3.2 to 3.8 | |
As of October 2021, PCE inflation was up 5.0% from October 2020. This is above the top end of the projected range for Q4, and projections will be revised up.
| Inflation projections of Federal Reserve Governors and Reserve Bank presidents, PCE Inflation1 | ||||
|---|---|---|---|---|
| Projection Date | 2021 | 2022 | 2023 | 2024 |
| Sept 2021 | 4.0 to 4.3 | 2.0 to 2.5 | 2.0 to 2.3 | 2.0 to 2.2 |
| June 2021 | 3.1 to 3.5 | 1.9 to 2.3 | 2.0 to 2.2 | |
PCE core inflation was up 4.1% in October year-over-year. Core PCE projections will be revised up.
| Core Inflation projections of Federal Reserve Governors and Reserve Bank presidents, Core Inflation1 | ||||
|---|---|---|---|---|
| Projection Date | 2021 | 2022 | 2023 | 2024 |
| Sept 2021 | 3.6 to 3.8 | 2.0 to 2.5 | 2.0 to 2.3 | 2.0 to 2.2 |
| June 2021 | 2.9 to 3.1 | 1.9 to 2.3 | 2.0 to 2.2 | |
Saturday, December 11, 2021
Real Estate Newsletter Articles this Week
by Calculated Risk on 12/11/2021 02:11:00 PM
At the Calculated Risk Real Estate Newsletter this week:
• 2nd Look at Local Housing Markets in November Adding Houston, Jacksonville, Nashville, New Hampshire, North Texas, Portland and Santa Clara
• The Home ATM in Q3 2021 aka Mortgage Equity Withdrawal (MEW)
• Lawler: Updates on Key Drivers of US Population Growth Lowest Growth in over a Century from 7/1/2020 to 7/1/2021
• 1st Look at Local Housing Markets in November "2022 will be a wild and competitive ride"
• As Forbearance Ends
This is usually published several times a week, and provides more in-depth analysis of the housing market.
The blog will continue as always!
You can subscribe at https://calculatedrisk.substack.com/ Currently all content is available for free - and some will always be free - but please subscribe!.
You can subscribe at https://calculatedrisk.substack.com/ Currently all content is available for free - and some will always be free - but please subscribe!.
Schedule for Week of December 12, 2021
by Calculated Risk on 12/11/2021 08:11:00 AM
The key economic reports this week are November Retail Sales and Housing Starts.
For manufacturing, November Industrial Production, and the December New York, Philly and Kansas City Fed surveys, will be released this week.
The FOMC meets this week, and the FOMC is expected to announce a faster taper pace for asset purchases.
No major economic releases scheduled.
6:00 AM: NFIB Small Business Optimism Index for November.
8:30 AM: The Producer Price Index for November from the BLS. The consensus is for a 0.6% increase in PPI, and a 0.5% increase in core PPI.
7:00 AM ET: The Mortgage Bankers Association (MBA) will release the results for the mortgage purchase applications index.
 8:30 AM ET: Retail sales for November will be released. The consensus is for a 1.4% increase in retail sales.
This graph shows retail sales since 1992. This is monthly retail sales and food service, seasonally adjusted (total and ex-gasoline).
8:30 AM: The New York Fed Empire State manufacturing survey for December. The consensus is for a reading of 25.0, down from 30.9.
10:00 AM: The December NAHB homebuilder survey. The consensus is for a reading of 84, up from 83. Any number above 50 indicates that more builders view sales conditions as good than poor.
2:00 PM: FOMC Meeting Announcement. The FOMC is expected to announce a faster taper pace for asset purchases.
2:00 PM: FOMC Forecasts This will include the Federal Open Market Committee (FOMC) participants' projections of the appropriate target federal funds rate along with the quarterly economic projections.
2:30 PM: Fed Chair Jerome Powell holds a press briefing following the FOMC announcement.
8:30 AM: The initial weekly unemployment claims report will be released. The consensus is for 200 thousand initial claims, up from 184 thousand last week.
 8:30 AM: Housing Starts for November.
 This graph shows single and multi-family housing starts since 1968.
The consensus is for 1.570 million SAAR, up from 1.520 million SAAR.
8:30 AM: the Philly Fed manufacturing survey for December. The consensus is for a reading of 27.0, down from 39.0.
 9:15 AM: The Fed will release Industrial Production and Capacity Utilization for November.
This graph shows industrial production since 1967.
The consensus is for a 0.7% increase in Industrial Production, and for Capacity Utilization to increase to 76.8%.
11:00 AM: the Kansas City Fed manufacturing survey for December.
10:00 AM: State Employment and Unemployment (Monthly) for November
Friday, December 10, 2021
Black Knight: Number of Mortgages in Forbearance Declines "Significantly"
by Calculated Risk on 12/10/2021 07:05:00 PM
This data is as of December 7th.
From Andy Walden at Black Knight: Forbearance Plan Exits Drop Significantly
Active forbearance plan totals plunged in the first full week of December, led by portfolio held and privately securitized loans.
According to our McDash Flash daily forbearance tracking dataset, the number of active forbearance plans fell by 112,000 (-11%) this week, led by a 49,000 (-15%) drop in PLS/portfolio loans. FHA/VA plan volumes dropped 42,000 (-12%) followed by GSE (21,000/-7%). There is a modest opportunity for additional improvement in coming weeks with 33,000 loans still listed with November reviews for extension/removal (roughly half of which are expected to be reaching their final expirations).
As of December 7, 882,000 mortgage holders (1.7%) remain in COVID-19 related forbearance plans, including 1.1% of GSE, 2.6% of FHA/VA and 2.1% of portfolio/PLS.
Click on graph for larger image.
Overall, the number of forbearance plans is down by 177,000 (-17%) from the same time last month, with the potential for modest additional improvements through the end of the year. Plan starts over the past four weeks are up 24% from the preceding four-week period, driven by a more than 40% increase among FHA/VA loans (with GSEs seeing a 29% increase). This is a trend we’ll be watching closely as we round out the year.
emphasis added
2nd Look at Local Housing Markets in November
by Calculated Risk on 12/10/2021 01:33:00 PM
Today, in the Real Estate Newsletter: 2nd Look at Local Housing Markets in November
Excerpt:
Adding Houston, Jacksonville, Nashville, New Hampshire, North Texas, Portland and Santa Clara
...
Here is a summary of active listings for these housing markets in November. Inventory was down 15.8% in November month-over-month (MoM) from October, and down 25.0% year-over-year (YoY).
Inventory almost always declines seasonally in November, so the MoM decline is not a surprise. Last month, these markets were down 23.3% YoY, so the YoY decline in November is larger than in October. This isn’t indicating a slowing market.
Notes for all tables:
1. New additions to table in BOLD.
2. Northwest (Seattle), North Texas (Dallas), and Santa Clara (San Jose), Jacksonville, Source: Northeast Florida Association of REALTORS®
Q4 GDP Forecasts: Moving Up
by Calculated Risk on 12/10/2021 12:36:00 PM
From BofA:
4Q GDP tracking moved up to 6.5% qoq saar from 6.0%, reflecting the strong signal from the BAC card spending data. [December 10 estimate]And from the Altanta Fed: GDPNow
emphasis added
The GDPNow model estimate for real GDP growth (seasonally adjusted annual rate) in the fourth quarter of 2021 is 8.7 percent on December 9, up from 8.6 percent on December 7. [December 9 estimate]
Cleveland Fed: Median CPI increased 0.5% and Trimmed-mean CPI increased 0.5% in November
by Calculated Risk on 12/10/2021 11:34:00 AM
The Cleveland Fed released the median CPI and the trimmed-mean CPI this morning:
According to the Federal Reserve Bank of Cleveland, the median Consumer Price Index rose 0.5% in November. The 16% trimmed-mean Consumer Price Index increased 0.5% in November. "The median CPI and 16% trimmed-mean CPI are measures of core inflation calculated by the Federal Reserve Bank of Cleveland based on data released in the Bureau of Labor Statistics’ (BLS) monthly CPI report".
Note: The Cleveland Fed released the median CPI details here: "Fuel oil and other fuels" were up 104% annualized.
Note that Owners' Equivalent Rent and Rent of Primary Residence account for almost 1/3 of median CPI, and these measures were up around 5% to 6% annualized in November.
 Click on graph for larger image.
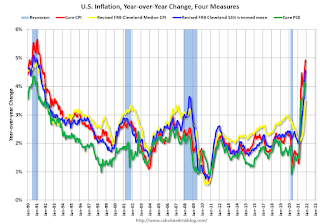
This graph shows the year-over-year change for these four key measures of inflation.
Click on graph for larger image.This graph shows the year-over-year change for these four key measures of inflation.
On a year-over-year basis, the median CPI rose 3.5%, the trimmed-mean CPI rose 4.6%, and the CPI less food and energy rose 4.9%. Core PCE is for October and increased 4.1% year-over-year.
BLS: CPI increased 0.8% in November; Core CPI increased 0.5%
by Calculated Risk on 12/10/2021 08:32:00 AM
The Consumer Price Index for All Urban Consumers (CPI-U) increased 0.8 percent in November on a seasonally adjusted basis after rising 0.9 percent in October, the U.S. Bureau of Labor Statistics reported today. Over the last 12 months, the all items index increased 6.8 percent before seasonal adjustment.Both CPI and core CPI were close to expectations. I'll post a graph later today after the Cleveland Fed releases the median and trimmed-mean CPI.
The monthly all items seasonally adjusted increase was the result of broad increases in most component indexes, similar to last month. The indexes for gasoline, shelter, food, used cars and trucks, and new vehicles were among the larger contributors. The energy index rose 3.5 percent in November as the gasoline index increased 6.1 percent and the other major energy component indexes also rose. The food index increased 0.7 percent as the index for food at home rose 0.8 percent.
The index for all items less food and energy rose 0.5 percent in November following a 0.6-percent increase in October. Along with shelter, used cars and trucks, and new vehicles, the indexes for household furnishings and operations, apparel, and airline fares were among those that increased. The indexes for motor vehicle insurance, recreation, and communication all declined in November.
The all items index rose 6.8 percent for the 12 months ending October, the largest 12-month increase since the period ending June 1982. The index for all items less food and energy rose 4.9 percent over the last 12 months, while the energy index rose 33.3 percent over the last year, and the food index increased 6.1 percent. These changes are the largest 12-month increases in at least 13 years in the respective series.
emphasis added


