 RSS Feed
 by Calculated Risk on 12/16/2021 02:17:00 PM
Thursday, December 16, 2021
Hotels: Occupancy Rate Down 5% Compared to Same Week in 2019
Note: Since occupancy declined sharply at the onset of the pandemic, CoStar is comparing to 2019.
U.S. hotel performance increased from the previous week, according to STR‘s latest data through December 11.The following graph shows the seasonal pattern for the hotel occupancy rate using the four week average.
December 5-11, 2021 (percentage change from comparable week in 2019*):
• Occupancy: 57.4% (-4.8%)
• Average daily rate (ADR): $128.35 (+2.3%)
• Revenue per available room (RevPAR): $73.73 (-2.7%)
*Due to the steep, pandemic-driven performance declines of 2020, STR is measuring recovery against comparable time periods from 2019.
emphasis added
 Click on graph for larger image.
The red line is for 2021, black is 2020, blue is the median, dashed purple is 2019, and dashed light blue is for 2009 (the worst year on record for hotels prior to 2020).
Although down compared to 2019, the 4-week average of the occupancy rate is now above the median rate for the previous 20 years (Blue).
Note: Y-axis doesn't start at zero to better show the seasonal change.
The 4-week average of the occupancy rate will now decline seasonally into the new year.
AIA: "Demand for design services continues to grow" in November
by Calculated Risk on 12/16/2021 12:33:00 PM
Note: This index is a leading indicator primarily for new Commercial Real Estate (CRE) investment.
From the AIA: Demand for design services continues to grow
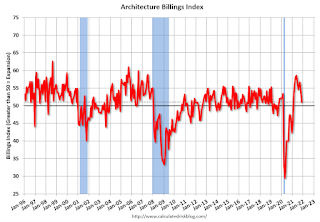
Architecture firms reported increasing demand for design services for the tenth consecutive month in November, according to a new report today from The American Institute of Architects (AIA).
The ABI score for November was 51.0, down from 54.3 the previous month. While this score is down slightly from October’s score, it still indicates positive business conditions overall (any score above 50 indicates billings growth). During November, scoring for both the new project inquiries and design contracts moderated slightly, but remained in positive territory, posting scores of 59.4 and 55.8 respectively.
“The period of elevated billing scores nationally, and across the major regions and construction sectors seems to be winding down for this cycle,” said AIA Chief Economist, Kermit Baker, Hon. AIA, PhD. “Ongoing external challenges like labor shortages, supply chain disruptions, spiking inflation, and prospects for rising interest rates will likely continue to slow the growth in firm billings in the coming months.”
...
• Regional averages: Midwest (57.6); South (53.7); West (50.9); Northeast (45.5)
• Sector index breakdown: mixed practice (56.9); multi-family residential (51.4); commercial/industrial (50.5); institutional (50.1)
emphasis added
 Click on graph for larger image.
This graph shows the Architecture Billings Index since 1996. The index was at 51.0 in November, down from 54.3 in October. Anything above 50 indicates expansion in demand for architects' services.
Note: This includes commercial and industrial facilities like hotels and office buildings, multi-family residential, as well as schools, hospitals and other institutions.
This index was below 50 for eleven consecutive months, but has been positive for the last ten months.
The eleven months of decline represented a significant decrease in design services, and suggests a decline in CRE investment through most of 2021 (This index usually leads CRE investment by 9 to 12 months), however this suggests a pickup in CRE investment in 2022.
November Housing Starts: Most Housing Units Under Construction Since 1973
by Calculated Risk on 12/16/2021 10:08:00 AM
Today, in the Real Estate Newsletter: November Housing Starts: Most Housing Units Under Construction Since 1973
Excerpt:
The fourth graph shows housing starts under construction, Seasonally Adjusted (SA).You can subscribe at https://calculatedrisk.substack.com/ (Currently all content is available for free, but please subscribe).
Red is single family units. Currently there are 752 thousand single family units under construction (SA). This is the highest level since March 2007.
For single family, most of these homes are already sold (Census counts sales when contract is signed). The reason there are so many homes is probably due to construction delays. Since most of these are already sold, it is unlikely this is “overbuilding”, or that this will impact prices.
Blue is for 2+ units. Currently there are 734 thousand multi-family units under construction. This is the highest level since July 1974! For multi-family, construction delays are probably also a factor. The completion of these units should help with rent pressure.
Census will release data next year on the length of time from start to completion, and that will probably show long delays in 2021. In 2020, it took an average of 6.8 months from start to completion for single family homes, and 15.4 months for buildings with 2 or more units.
Combined, there are 1.486 million units under construction. This is the most since 1973.
Industrial Production Increased 0.5 Percent in November
by Calculated Risk on 12/16/2021 09:22:00 AM
From the Fed: Industrial Production and Capacity Utilization
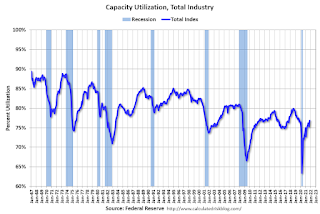
Industrial production rose 0.5 percent in November. The indexes for both manufacturing and mining increased 0.7 percent, while the index for utilities decreased 0.8 percent.
At 102.3 percent of its 2017 average, total industrial production in November was 5.3 percent above its year-earlier level and at its highest reading since September 2019. Capacity utilization for the industrial sector increased 0.3 percentage point to 76.8 percent; even so, it was 2.8 percentage points below its long-run (1972–2020) average.
emphasis added
 Click on graph for larger image.
This graph shows Capacity Utilization. This series is up from the record low set in April 2020, and above the level in February 2020 (pre-pandemic).
Capacity utilization at 76.8% is 2.8% below the average from 1972 to 2020. This was at consensus expectations.
Note: y-axis doesn't start at zero to better show the change.
 The second graph shows industrial production since 1967.
Industrial production increased in November to 102.3. This is above the February 2020 level.
The change in industrial production was slightly below consensus expectations.
Weekly Initial Unemployment Claims Increase to 206,000
by Calculated Risk on 12/16/2021 08:45:00 AM
The DOL reported:
In the week ending December 11, the advance figure for seasonally adjusted initial claims was 206,000, an increase of 18,000 from the previous week's revised level. The previous week's level was revised up by 4,000 from 184,000 to 188,000. The 4-week moving average was 203,750, a decrease of 16,000 from the previous week's revised average. This is the lowest level for this average since November 15, 1969 when it was 202,750. The previous week's average was revised up by 1,000 from 218,750 to 219,750.The following graph shows the 4-week moving average of weekly claims since 1971.
emphasis added
 Click on graph for larger image.
The dashed line on the graph is the current 4-week average. The four-week average of weekly unemployment claims decreased to 203,750.
The previous week was revised up.
Regular state continued claims decreased to 1,845,000 (SA) from 1,999,000 (SA) the previous week.
Weekly claims were sligthly above the consensus forecast.
Housing Starts Increased to 1.679 million Annual Rate in November
by Calculated Risk on 12/16/2021 08:38:00 AM
From the Census Bureau: Permits, Starts and Completions
Housing Starts:
Privately‐owned housing starts in November were at a seasonally adjusted annual rate of 1,679,000. This is 11.8 percent above the revised October estimate of 1,502,000 and is 8.3 percent above the November 2020 rate of 1,551,000. Single‐family housing starts in November were at a rate of 1,173,000; this is 11.3 percent above the revised October figure of 1,054,000. The November rate for units in buildings with five units or more was 491,000.
Building Permits:
Privately‐owned housing units authorized by building permits in November were at a seasonally adjusted annual rate of 1,712,000. This is 3.6 percent above the revised October rate of 1,653,000 and is 0.9 percent above the November 2020 rate of 1,696,000. Single‐family authorizations in November were at a rate of 1,103,000; this is 2.7 percent above the revised October figure of 1,074,000. Authorizations of units in buildings with five units or more were at a rate of 560,000 in November.
emphasis added
 Click on graph for larger image.
The first graph shows single and multi-family housing starts for the last several years.
Multi-family starts (blue, 2+ units) increased in November compared to October. Multi-family starts were up 37% year-over-year in November.
Single-family starts (red) increased in November, and were down 0.7% year-over-year.
 The second graph shows single and multi-family housing starts since 1968.
 This shows the huge collapse following the housing bubble, and then the eventual recovery (but still not historically high).
Total housing starts in November were above expectations, and starts in September and October were up slightly revised, combined.
I'll have more later …
Wednesday, December 15, 2021
Thursday: Housing Starts, Unemployment Claims, Industrial Production and more
by Calculated Risk on 12/15/2021 07:48:00 PM
Thursday:
• At 8:30 AM ET, The initial weekly unemployment claims report will be released. The consensus is for 200 thousand initial claims, up from 184 thousand last week.
• Also at 8:30 AM, Housing Starts for November. The consensus is for 1.570 million SAAR, up from 1.520 million SAAR.
• Also at 8:30 AM, the Philly Fed manufacturing survey for December. The consensus is for a reading of 27.0, down from 39.0.
• At 9:15 AM, The Fed will release Industrial Production and Capacity Utilization for November. The consensus is for a 0.7% increase in Industrial Production, and for Capacity Utilization to increase to 76.8%.
• At 11:00 AM, the Kansas City Fed manufacturing survey for December.
And on COVID:
| COVID Metrics | ||||
|---|---|---|---|---|
| Today | Week Ago | Goal | ||
| Percent fully Vaccinated | 61.1% | --- | ≥70.0%1 | |
| Fully Vaccinated (millions) | 202.8 | --- | ≥2321 | |
| New Cases per Day3 | 117,950 | 121,889 | ≤5,0002 | |
| Hospitalized3🚩 | 49,594 | 44,777 | ≤3,0002 | |
| Deaths per Day3🚩 | 1,143 | 1,122 | ≤502 | |
| 1 Minimum to achieve "herd immunity" (estimated between 70% and 85%). 2my goals to stop daily posts, 37-day average for Cases, Currently Hospitalized, and Deaths 🚩 Increasing 7-day average week-over-week for Cases, Hospitalized, and Deaths ✅ Goal met. | ||||
 Click on graph for larger image.
This graph shows the daily (columns) and 7-day average (line) of positive tests reported.
FOMC Projections and Press Conference
by Calculated Risk on 12/15/2021 02:13:00 PM
Statement here.
Fed Chair Powell press conference video here starting at 2:30 PM ET.
Here are the projections. In September, about half of participants expected one rate hike in 2022. Now, participants expect 3 rate hikes in 2022.
Wall Street forecasts are for GDP to increase at close to a 6.5% annual rate in Q4 that would put Q4-over-Q4 at around 5.4% - so the FOMC projections for 2021 were revised down.
| GDP projections of Federal Reserve Governors and Reserve Bank presidents, Change in Real GDP1 | ||||
|---|---|---|---|---|
| Projection Date | 2021 | 2022 | 2023 | 2024 |
| Dec 2021 | 5.5 | 3.6 to 4.5 | 2.0 to 2.5 | 1.8 to 2.0 |
| Sept 2021 | 5.8 to 6.0 | 3.4 to 4.5 | 2.2 to 2.5 | 2.0 to 2.2 |
The unemployment rate was at 4.2% in November.
The projections for the unemployment rate in Q4 2021 were revised down.
Note that the unemployment rate doesn't capture the economic damage to the labor market. Not only are there 1.2 million more people currently unemployed than prior to the pandemic, and additional 2.4 million people have left the labor force since February 2020.
2 Projections for the unemployment rate are for the average civilian unemployment rate in the fourth quarter of the year indicated.
As of October 2021, PCE inflation was up 5.0% from October 2020.
The projections for inflation were revised up sharply and the FOMC sees inflation solidly above target in 2022 and 2023.
PCE core inflation was up 4.1% in October year-over-year.
Projections for core inflation were revised up.
| Unemployment projections of Federal Reserve Governors and Reserve Bank presidents, Unemployment Rate2 | ||||
|---|---|---|---|---|
| Projection Date | 2021 | 2022 | 2023 | 2024 |
| Dec 2021 | 4.2 to 4.3 | 3.4 to 3.7 | 3.2 to 3.6 | 3.2 to 3.7 |
| Sept 2021 | 4.6 to 4.8 | 3.6 to 4.0 | 3.3 to 3.7 | 3.3 to 3.6 |
As of October 2021, PCE inflation was up 5.0% from October 2020.
The projections for inflation were revised up sharply and the FOMC sees inflation solidly above target in 2022 and 2023.
| Inflation projections of Federal Reserve Governors and Reserve Bank presidents, PCE Inflation1 | ||||
|---|---|---|---|---|
| Projection Date | 2021 | 2022 | 2023 | 2024 |
| Dec 2021 | 5.3 to 5.4 | 2.2 to 3.0 | 2.1 to 2.5 | 2.0 to 2.2 |
| Sept 2021 | 4.0 to 4.3 | 2.0 to 2.5 | 2.0 to 2.3 | 2.0 to 2.2 |
PCE core inflation was up 4.1% in October year-over-year.
Projections for core inflation were revised up.
| Core Inflation projections of Federal Reserve Governors and Reserve Bank presidents, Core Inflation1 | ||||
|---|---|---|---|---|
| Projection Date | 2021 | 2022 | 2023 | 2024 |
| Dec 2021 | 4.4 | 2.5 to 3.0 | 2.1 to 2.4 | 2.0 to 2.2 |
| Sept 2021 | 3.6 to 3.8 | 2.0 to 2.5 | 2.0 to 2.3 | 2.0 to 2.2 |
FOMC Statement: Accelerate Taper
by Calculated Risk on 12/15/2021 02:04:00 PM
Fed Chair Powell press conference video here starting at 2:30 PM ET.
FOMC Statement:
The Federal Reserve is committed to using its full range of tools to support the U.S. economy in this challenging time, thereby promoting its maximum employment and price stability goals.
With progress on vaccinations and strong policy support, indicators of economic activity and employment have continued to strengthen. The sectors most adversely affected by the pandemic have improved in recent months but continue to be affected by COVID-19. Job gains have been solid in recent months, and the unemployment rate has declined substantially. Supply and demand imbalances related to the pandemic and the reopening of the economy have continued to contribute to elevated levels of inflation. Overall financial conditions remain accommodative, in part reflecting policy measures to support the economy and the flow of credit to U.S. households and businesses.
The path of the economy continues to depend on the course of the virus. Progress on vaccinations and an easing of supply constraints are expected to support continued gains in economic activity and employment as well as a reduction in inflation. Risks to the economic outlook remain, including from new variants of the virus.
The Committee seeks to achieve maximum employment and inflation at the rate of 2 percent over the longer run. In support of these goals, the Committee decided to keep the target range for the federal funds rate at 0 to 1/4 percent. With inflation having exceeded 2 percent for some time, the Committee expects it will be appropriate to maintain this target range until labor market conditions have reached levels consistent with the Committee's assessments of maximum employment. In light of inflation developments and the further improvement in the labor market, the Committee decided to reduce the monthly pace of its net asset purchases by $20 billion for Treasury securities and $10 billion for agency mortgage-backed securities. Beginning in January, the Committee will increase its holdings of Treasury securities by at least $40 billion per month and of agency mortgage‑backed securities by at least $20 billion per month. The Committee judges that similar reductions in the pace of net asset purchases will likely be appropriate each month, but it is prepared to adjust the pace of purchases if warranted by changes in the economic outlook. The Federal Reserve's ongoing purchases and holdings of securities will continue to foster smooth market functioning and accommodative financial conditions, thereby supporting the flow of credit to households and businesses.
In assessing the appropriate stance of monetary policy, the Committee will continue to monitor the implications of incoming information for the economic outlook. The Committee would be prepared to adjust the stance of monetary policy as appropriate if risks emerge that could impede the attainment of the Committee's goals. The Committee's assessments will take into account a wide range of information, including readings on public health, labor market conditions, inflation pressures and inflation expectations, and financial and international developments.
Voting for the monetary policy action were Jerome H. Powell, Chair; John C. Williams, Vice Chair; Thomas I. Barkin; Raphael W. Bostic; Michelle W. Bowman; Lael Brainard; Richard H. Clarida; Mary C. Daly; Charles L. Evans; Randal K. Quarles; and Christopher J. Waller.
emphasis added
The Household Mystery
by Calculated Risk on 12/15/2021 01:01:00 PM
Today, in the Real Estate Newsletter: The Household Mystery
Excerpt:
Using the Census Bureau data, we can calculate the impact the number of households needed in the 1970s due to 1) population growth, and 2) changes in household size:
Over those 12 years, the US needed an additional 950 thousand housing units per year due to the changes in household size. However, the US only needed about 550 thousand housing units per year due to population growth. Because of the changes in household size, the U.S. needed far more additional housing units in the '70s than in recent years with the number of persons per household relatively stable.
Notes for all tables:
Over the last two years - in 2020 and 2021 - the US needed very few new housing units due to population growth, so the demand for homeownership and rentals must be coming mostly from smaller household size. (NOTE: There was also significant 2nd home buying and other reasons).
Is something similar happening now to household size with the millennials? It probably is, and unfortunately household data is not timely or reliable.


