 RSS Feed
 by Calculated Risk on 12/22/2021 07:00:00 AM
Wednesday, December 22, 2021
MBA: Mortgage Applications Decrease in Latest Weekly Survey
From the MBA: Mortgage Applications Decrease in Latest MBA Weekly Survey
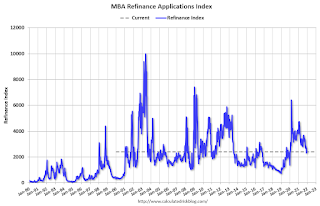
Mortgage applications decreased 0.6 percent from one week earlier, according to data from the Mortgage Bankers Association’s (MBA) Weekly Mortgage Applications Survey for the week ending December 17, 2021.
... The Refinance Index increased 2 percent from the previous week and was 42 percent lower than the same week one year ago. The seasonally adjusted Purchase Index decreased 3 percent from one week earlier. The unadjusted Purchase Index decreased 6 percent compared with the previous week and was 9 percent lower than the same week one year ago.
“Mortgage applications fell last week, driven by a 3 percent decline in purchase applications. Both conventional and government purchase applications were down, while the average purchase loan increased for the second straight week to $416,200 – the second highest amount ever. The elevated loan size is an indication that activity is more on the higher end of the market,” said Joel Kan, MBA’s Associate Vice President of Economic and Industry Forecasting. “Home-price appreciation growth remains faster than historical averages and inventory, particularly for starter homes, continues to trail strong demand.”
Added Kan, “The 30-year fixed rate decreased to 3.27 percent – its lowest level in four weeks – and helped spur an increase in refinances across all loan types. FHA and VA refinances jumped 4 percent and 12 percent, respectively.”
...
The average contract interest rate for 30-year fixed-rate mortgages with conforming loan balances ($548,250 or less) decreased to 3.27 percent from 3.30 percent, with points increasing to 0.41 from 0.39 (including the origination fee) for 80 percent loan-to-value ratio (LTV) loans.
emphasis added
 Click on graph for larger image.
The first graph shows the refinance index since 1990.
With relatively low rates, the index remains slightly elevated, but down sharply from last year.
The second graph shows the MBA mortgage purchase index
 According to the MBA, purchase activity is down 9% year-over-year unadjusted.
Note: Red is a four-week average (blue is weekly).
Tuesday, December 21, 2021
Wednesday: GDP, Existing Home Sales
by Calculated Risk on 12/21/2021 07:45:00 PM
Wednesday:
• At 7:00 AM ET, The Mortgage Bankers Association (MBA) will release the results for the mortgage purchase applications index.
• At 8:30 AM, Gross Domestic Product, 3rd quarter 2021 (Third estimate). The second estimate of GDP was 2.1%.
• Also at 8:30 AM, Chicago Fed National Activity Index for November. This is a composite index of other data.
• At 10:00 AM, Existing Home Sales for November from the National Association of Realtors (NAR). The consensus is for 6.20 million SAAR, down from 6.34 million. Housing economist Tom Lawler expects the NAR to report sales of 6.45 million SAAR for November.
From CR on COVID (mostly focus on hospitalizations and deaths, although new cases are rising rapidly):
The CDC is the source for all data.
| COVID Metrics | ||||
|---|---|---|---|---|
| Today | Week Ago | Goal | ||
| Percent fully Vaccinated | 61.6% | --- | ≥70.0%1 | |
| Fully Vaccinated (millions) | 204.6 | --- | ≥2321 | |
| New Cases per Day3🚩 | 149,331 | 119,281 | ≤5,0002 | |
| Hospitalized3🚩 | 60,907 | 58,452 | ≤3,0002 | |
| Deaths per Day3🚩 | 1,188 | 1,148 | ≤502 | |
| 1 Minimum to achieve "herd immunity" (estimated between 70% and 85%). 2my goals to stop daily posts, 37-day average for Cases, Currently Hospitalized, and Deaths 🚩 Increasing 7-day average week-over-week for Cases, Hospitalized, and Deaths ✅ Goal met. | ||||
 Click on graph for larger image.
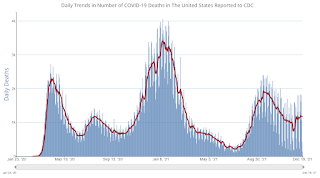
This graph shows the daily (columns) and 7-day average (line) of cases reported.
The scale might change soon (almost record number of new cases reported today).
Housing Wire: "Move over Fannie, the non-QM loan is in the fast lane"
by Calculated Risk on 12/21/2021 02:42:00 PM
CR Note: I've mentioned the increasing use of non-QM loans before.
Here is an interesting article on non-QM loans By Bill Conroy at Housing Wire: Move over Fannie, the non-QM loan is in the fast lane. Some brief excerpts:
The universe of non-QM single-family mortgage products is broad and difficult to define in a few words, but the definition matters because a huge slice of the borrowers in this non-QM category represent the heartbeat of the U.S. economy. Within its sweep are the self-employed as well as entrepreneurs who buy single-family investment properties — and who can’t qualify for a mortgage using traditional documentation, such as payroll income. As a result, they must rely on alternative documentation, including bank statements, assets or, in the case of rental properties, debt-service coverage ratios.The size of the market is relatively small (about $25 billion in 2021 but growing). And the underwriting is generally solid, but this will be a segment of mortgage lending to watch.
...
Non-QM mortgages also go to a slice of borrowers facing credit challenges — such as a recent bankruptcy or slightly out-of-bounds credit scores. The loans may include interest-only, 40-year terms or other creative financing features often designed to lower monthly payments on the front-end of the mortgage — often with an eye toward refinancing or selling the property in the short-term future.
5th Look at Local Housing Markets in November
by Calculated Risk on 12/21/2021 11:47:00 AM
Today, in the Real Estate Newsletter: 5th Look at Local Housing Markets in November
Excerpt:
This update adds Boston, Indiana, and Washington, D.C.
...
Here is a summary of active listings for these housing markets in November. Inventory was down 15.3% in November month-over-month (MoM) from October, and down 26.0% year-over-year (YoY).
Inventory almost always declines seasonally in November, so the MoM decline is not a surprise. Last month, these markets were down 22.5% YoY, so the YoY decline in November is larger than in October. This isn’t indicating a slowing market.
Notes for all tables:
1. New additions to table in BOLD.
2. Northwest (Seattle), North Texas (Dallas), and Santa Clara (San Jose), Jacksonville, Source: Northeast Florida Association of REALTORS®
3. Totals do not include Denver or Minneapolis (included in state totals).
Cleveland Fed: "What’s Holding Back Employment"
by Calculated Risk on 12/21/2021 09:45:00 AM
From the Cleveland Fed: What’s Holding Back Employment in the Recovery from the COVID-19 Pandemic?. Excerpts:
Bureau of Labor Statistics data indicate that five million jobs lost during the pandemic have not been recovered, but it is difficult to ascertain how many workers will return to available jobs. The Census Bureau’s Household Pulse Survey includes a detailed set of reasons for nonemployment, including households’ responses to the pandemic that provide a new perspective on reasons for not working. Among prime-age workers, reasons for nonemployment during the SARS-CoV-2 (COVID-19) pandemic have shifted substantially from mostly labor demand reasons to primarily labor supply inhibitors. At this point, most nonemployment is connected to three categories: sickness and concerns about COVID-19; child- and eldercare responsibilities; and the residual category “other reasons.” The persistence of these answers and the characteristics of individuals’ providing these answers point to barriers to fully recovering prior employment rates.
emphasis added
...
Click on graph for larger image.
The Household Pulse Survey shows that while the initial shock from the pandemic affected mostly labor demand, persistent supply-side barriers have kept previously employed people from returning to employment. There are various distinct reasons why people are not returning to employment, and the severity of these issues varies by demographic group. Some of these reasons for nonemployment point to persistent shifts in the labor force that may not resolve with the end of the pandemic. The lack of affordable and accessible childcare largely affects women with young children and will likely continue to keep some of these women out of the labor force even after the end of the pandemic because of the increased cost of childcare and the long-term job separations experienced by these mothers. Differences in virus fears and virus risks may make return to employment slower for Black workers, especially in areas with low vaccination rates. The largest category of reasons is “other reasons,” but lower-income and less-educated individuals are substantially overrepresented in this category. These individuals have long had lower workforce participation rates, and research on the benefits cliffs has revealed many situations in which increasing work can lower family incomes because of discrete cutoffs for other benefits. These distinct barriers all have different implications for the labor force and different solutions beyond ending the current public health crisis. By distinguishing which reasons for nonemployment are most limiting for each demographic group, we can better design policies that will help address specific issues for the populations most affected.
Monday, December 20, 2021
"Mortgage Rates Moderately Higher"
by Calculated Risk on 12/20/2021 09:00:00 PM
From Matthew Graham at Mortgage News Daily: Mortgage Rates Start Lower, But Could See Some Volatility This Week
For most lenders, mortgage rates edged slightly higher at the start of the holiday-shortened week. The exception would be among those lenders who made changes to their rate offerings on Friday afternoon in response to deteriorating market conditions. The unequivocal comparison would be with Friday morning's rates, in which case today's rates are higher.From CR on COVID (mostly focus on hospitalizations and deaths):
...
Looking ahead, the bond market will be closed on Friday and open for only a half day on Thursday. Most mortgage lenders will not be updating rate sheets on Friday, and they will shy away from making big changes on Thursday unless massive market movement forces their hand.[30 year fixed 3.17%]
emphasis added
The CDC is the source for all data.
| COVID Metrics | ||||
|---|---|---|---|---|
| Today | Week Ago | Goal | ||
| Percent fully Vaccinated | 61.5% | --- | ≥70.0%1 | |
| Fully Vaccinated (millions) | 204.1 | --- | ≥2321 | |
| New Cases per Day3🚩 | 132,659 | 117,521 | ≤5,0002 | |
| Hospitalized3🚩 | 58,793 | 57,585 | ≤3,0002 | |
| Deaths per Day3🚩 | 1,169 | 1,131 | ≤502 | |
| 1 Minimum to achieve "herd immunity" (estimated between 70% and 85%). 2my goals to stop daily posts, 37-day average for Cases, Currently Hospitalized, and Deaths 🚩 Increasing 7-day average week-over-week for Cases, Hospitalized, and Deaths ✅ Goal met. | ||||
 Click on graph for larger image.
This graph shows the daily (columns) and 7-day average (line) of deaths reported.
LA Area Port Traffic: Disappointing Traffic in November
by Calculated Risk on 12/20/2021 05:50:00 PM
Notes: The expansion to the Panama Canal was completed in 2016 (As I noted a few years ago), and some of the traffic that used the ports of Los Angeles and Long Beach is probably going through the canal. This might be impacting TEUs on the West Coast.
Also, incoming port traffic is backed up significantly in the LA area with numerous ships at anchor waiting to unload.
Container traffic gives us an idea about the volume of goods being exported and imported - and usually some hints about the trade report since LA area ports handle about 40% of the nation's container port traffic.
The following graphs are for inbound and outbound traffic at the ports of Los Angeles and Long Beach in TEUs (TEUs: 20-foot equivalent units or 20-foot-long cargo container).
To remove the strong seasonal component for inbound traffic, the first graph shows the rolling 12-month average.
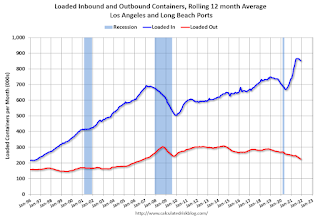
On a rolling 12-month basis, inbound traffic was down 0.8% in November compared to the rolling 12 months ending in October. Outbound traffic was down 2.0% compared to the rolling 12 months ending the previous month.
The 2nd graph is the monthly data (with a strong seasonal pattern for imports).

2021 started off incredibly strong for imports - and with the backlog of ships, will likely stay strong into 2022 (no break again in February or March).
It is disappointing that traffic dipped in November compared to the previous months so there are quite a few ships still waiting to unload.
Imports were down 10% YoY in November, and exports were down 22% YoY.
Supply Chain Disruptions and Housing Inventory
by Calculated Risk on 12/20/2021 05:40:00 PM
Today, in the Real Estate Newsletter: Supply Chain Disruptions and Housing Inventory
Excerpt:
An interesting question: Is how many of these units under construction are due to supply chain constraints. Census will release data next year on the length of time from start to completion, and that will probably show long delays in 2021. In 2020, it took an average of 6.8 months from start to completion for single family homes, and 15.4 months for buildings with 2 or more units.
For single family homes, starts have been at about the same level for over a year, so - in normal times - we’d expect completions to be at about the same level as starts. With some simple calculations, it seems that supply chain issues have delayed the completion of somewhere between 70,000 and 150,000 single family homes that would have normally been completed by November.
MBA Survey: "Share of Mortgage Loans in Forbearance Decreases to 1.67%"
by Calculated Risk on 12/20/2021 04:00:00 PM
Note: This is as of November 30th.
From the MBA: MBA Loan Monitoring Survey: Share of Mortgage Loans in Forbearance Decreases to 1.67%
The Mortgage Bankers Association’s (MBA) new monthly Loan Monitoring Survey revealed that the total number of loans now in forbearance decreased by 39 basis points from 2.06% of servicers’ portfolio volume in the prior month to 1.67% as of November 30, 2021. According to MBA’s estimate, 835,000 homeowners are in forbearance plans.
The share of Fannie Mae and Freddie Mac loans in forbearance decreased 16 basis points to 0.76%. Ginnie Mae loans in forbearance decreased 42 basis points to 2.10%, and the forbearance share for portfolio loans and private-label securities (PLS) declined 106 basis points to 3.94%.
“The share of loans in forbearance in November declined – albeit at a slower pace than October – as borrowers continued to near the expiration of their forbearance plans and moved into permanent loan workout solutions,” said Marina Walsh, CMB, MBA’s Vice President of Industry Analysis.
Total loans serviced that were current (not delinquent or in foreclosure) as a percent of servicing portfolio volume (#) rose to 94.58% in November from 94.32% in October (on a non-seasonally adjusted basis). Total completed loan workouts from 2020 and onward (repayment plans, loan deferrals/partial claims, loan modifications) that were current as a percent of total completed workouts declined to 83.69% last month from 84.04% in October.
emphasis added
 Click on graph for larger image.
This graph shows the percent of portfolio in forbearance by investor type over time. The number of forbearance plans is decreasing rapidly recently since many homeowners have reached the end of the 18-month term.
Review: Ten Economic Questions for 2021
by Calculated Risk on 12/20/2021 02:21:00 PM
At the end of last year, I posted Ten Economic Questions for 2021. I followed up with a brief post on each question. Here is review (we don't have all data yet, but enough). I've linked to my posts from the beginning of the year, with a brief excerpt and a few comments.
Note: Every year, I've posted a disclaimer that a recession could be caused by "An exogenous event such as a pandemic, significant military conflict, disruption of energy supplies for any reason, a major natural disaster (meteor strike, super volcano, etc), and a number of other low probability reasons" (emphasis added).
Unfortunately, 2020 saw one of those "low probability" events, and many of my predictions weren't even close. And I was wrong again on several questions in 2021 (I assumed "by mid-year people will engage in normal economic activity"). In a way, this is the point of the predictions. I don't have a crystal ball, but I think it helps to outline what I think will happen - and understand - and change my mind, when the outlook is wrong. As an example, when the pandemic hit, I switched from being mostly positive on the economy to calling a recession in early March 2020.
10) Question #10 for 2021: How much damage did the pandemic do to certain sectors?
"However, my sense is people will return to travel and entertainment activities once the pandemic ends (maybe less business travel - that would be a negative for airlines and hotels). The return might be slow at first, but people will gradually gain confidence.This has generally been correct, as the Seven High Frequency Indicators for the Economy shows. Also, certain areas of commercial real estate struggled in 2021, and business travel has been slow to return (compared to leisure travel).
So, once the pandemic subsides, my guess is certain sectors of CRE will still struggle, and possibly sectors related to business travel will be negatively impacted. "
This might be one of the most important housing questions for 2021!According to the October NAR report on existing home sales, inventory was down 12% year-over-year in November, and the months-of-supply was at 2.4 months. In 2020, inventory really declined due to a combination of potential sellers keeping their properties off the market during a pandemic, and a pickup in buying due to record low mortgage rates, a move away from multi-family rentals and strong second home buying (to escape the high-density cities). Inventory will be down again in 2021 and will probably set new record lows this Winter.
...
The bottom line is inventory will probably increase, especially in the 2nd half of 2021 (with the assumption that the pandemic will be mostly over by mid-year) - maybe back up to the 2017 - 2019 levels.
8) Question #8 for 2021: What will happen with house prices in 2021?
"My guess (based on my inventory forecast and a recovering economy) is that year-over-year price increases will probably be the strongest early in the year, and then soften somewhat towards the end of 2021. It seems likely that price appreciation will decrease from the 2020 pace, but still be in the mid-single digit range in 2021."This was way off. The CoreLogic data for October showed prices up 18.0% year-over-year. The September Case-Shiller data showed prices up 19.5% YoY. With inventory lower than expected, house prices picked up much more than expected.
7) Question #7 for 2021: How much will RI increase in 2021? How about housing starts and new home sales in 2021?
"My guess is starts will be up year-over-year in 2021 by high single digits. However, my guess is new home sales will soften in the second half of 2021 (based on my expectation of more existing home inventory), and will be up mid single digits (a decline from the sales rate over the last 5 months). It is even possible that sales will be flat to slightly down in 2021, but that will depend on inventory and the course of the pandemic."Through November, starts were up 16.3% year-over-year compared to the same period in 2019. New home sales were down 4.4% year--to-date through October. Starts were stronger than expected, but new home sales were down.
6) Question #6 for 2021: Will the Fed raise rates in 2021? What about the asset purchase program?
"There will be no rate hike in 2021, and since I'm assuming the pandemic will subside by mid-year 2021, it seems likely the Fed will taper asset purchases sometime in the second half of 2021."This was correct.
5) Question #5 for 2021: Will the core inflation rate increase in 2021? Will too much inflation be a concern in 2021?
"My guess is core PCE inflation (year-over-year) will increase in 2021 (from the current 1.4%), but I think too much inflation will NOT be a concern in 2021."According to the October Personal Income and Outlays report, the October PCE price index increased 4.1 percent year-over-year and the October PCE price index, excluding food and energy, increased 5.0 percent year-over-year. Inflation was higher than expected and is now a concern for many.
4) Question #4 for 2021: Will the overall participation rate increase to pre-pandemic levels (63.4% in February 2020) , or will it will only partially recover in 2021?
"My guess, based on the pandemic ending around mid-year, is that most of these people will return to the labor force. I don't expect that participation rate to increase to pre-pandemic levels (63.4%), but it seems reason[able that] the participation rate will increase to the mid-to-high 62s by year end."The Labor Force Participation Rate was at 61.8% in November. This remained lower than expected as many people didn't return to the labor force.
3) Question #3 for 2021: What will the unemployment rate be in December 2021?
"Depending on the estimate for the participation rate and job growth (next question), my guess is the unemployment rate will decline into the mid 5% range by December 2021 from the current 6.7%. Hopefully I'm too pessimistic."I was too pessimistic. The unemployment rates was at 4.2% in November, partially because participation remained lower than I expected.
2) Question #2 for 2021: Will all the jobs lost in 2020 return in 2021, or will job growth be sluggish?
"With 3.7 million permanent job losers - about 2.5 million more than at the beginning of 2020 - it seems unlikely the economy will add back the remaining 9 million jobs lost within a year, and also add jobs for new entrants in 2021. I think something like 6 to 8 million jobs could be added in 2021, but it will depend on ending the pandemic and appropriate fiscal policy. "As of the November employed report, the year-over-year change was +5.8 million jobs.. This was close to my guess.
1) Question #1 for 2021: How much will the economy grow in 2021?
"My guess is there are certain sectors that will be slow to recover, and some - like some sectors of commercial real estate - that will barely contribute to growth in 2021. These factors suggest real GDP growth probably in the 4.5% to 5.5% range in 2021, with some upside potential."It appears GDP growth will be close to 5.5% in 2021.
This was another difficult year. My biggest misses were on inflation, housing inventory, house prices and the unemployment rate. I was correct on the Fed, GDP growth, and close on new home sales and job growth.


