 RSS Feed
 by Calculated Risk on 12/23/2021 12:35:00 PM
Thursday, December 23, 2021
New Home Sales: Record 110 thousand homes have not been started
Today, in the Real Estate Newsletter: New Home Sales: Record 110 thousand homes have not been started
Brief excerpt:
Sales, year to date in 2021, are 6.5% below sales in 2020, and new home sales in 2021 will finish solidly below sales in 2020 - since sales in 2020 finished strong.You can subscribe at https://calculatedrisk.substack.com/ (Currently all content is available for free, but please subscribe).
This graph shows new home sales for 2020 and 2021 by month (Seasonally Adjusted Annual Rate).
The year-over-year comparisons were easy in the first half of 2021 - especially in March and April. However, sales will be down year-over-year again in December - since the selling season was delayed in 2020.
...
The next graph shows the months of supply by stage of construction. “Months of supply” is inventory at each stage, divided by the sales rate.
The inventory of completed homes for sale was at 39 thousand in November, up from the record low of 33 thousand in March, April, May and July 2021. That is about 0.6 months of completed supply (red line). This is about half the normal level.
The inventory of new homes under construction is at 4.1 months (blue line) - well above the normal level. This elevated level of homes under construction is due to supply chain constraints.
And a record 110 thousand homes have not been started - about 1.8 months of supply (grey line) - almost double the normal level. Homebuilders are probably waiting to start some homes until they have a firmer grasp on prices.
New Home Sales at 744,000 Annual Rate in November
by Calculated Risk on 12/23/2021 10:08:00 AM
The Census Bureau reports New Home Sales in November were at a seasonally adjusted annual rate (SAAR) of 744 thousand.
The previous three months were revised down significantly.
Sales of new single‐family houses in November 2021 were at a seasonally adjusted annual rate of 744,000, according to estimates released jointly today by the U.S. Census Bureau and the Department of Housing and Urban Development. This is 12.4 percent above the revised October rate of 662,000, but is 14.0 percent below the November 2020 estimate of 865,000.
emphasis added
 Click on graph for larger image.
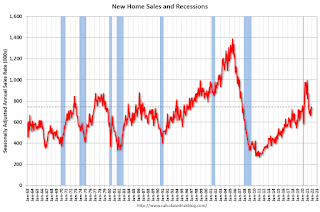
The first graph shows New Home Sales vs. recessions since 1963. The dashed line is the current sales rate.
New home sales are now declining year-over-year since sales soared following the first few months of the pandemic.
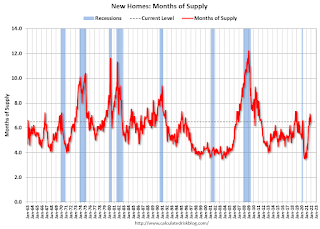
The second graph shows New Home Months of Supply.
 The months of supply decreased in November to 6.5 months from 7.1 months in October.
 The all-time record high was 12.1 months of supply in January 2009. The all-time record low was 3.5 months, most recently in October 2020.
This is above the normal range (about 4 to 6 months of supply is normal).
"The seasonally‐adjusted estimate of new houses for sale at the end of November was 402,000. This represents a supply of 6.5 months at the current sales rate."
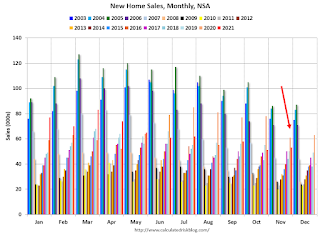 The last graph shows sales NSA (monthly sales, not seasonally adjusted annual rate).
In November 2021 (red column), 53 thousand new homes were sold (NSA). Last year, 61 thousand homes were sold in November.
The all-time high for November was 86 thousand in 2005, and the all-time low for November was 20 thousand in 2010.
This was below expectations of 766 thousand SAAR, and sales in the three previous months were revised down significantly. I'll have more later today.
Personal Income increased 0.4% in November; Spending increased 0.6%
by Calculated Risk on 12/23/2021 08:41:00 AM
The BEA released the Personal Income and Outlays report for November:
Personal income increased $90.4 billion (0.4 percent) in November according to estimates released today by the Bureau of Economic Analysis. Disposable personal income (DPI) increased $70.4 billion (0.4 percent) and personal consumption expenditures (PCE) increased $104.7 billion (0.6 percent).The November PCE price index increased 5.7 percent year-over-year and the November PCE price index, excluding food and energy, increased 4.7 percent year-over-year.
Real DPI decreased 0.2 percent in November and Real PCE increased less than 0.1 percent; spending on services increased 0.5 percent and spending on goods decreased 0.8 percent. The PCE price index increased 0.6 percent. Excluding food and energy, the PCE price index increased 0.5 percent
emphasis added
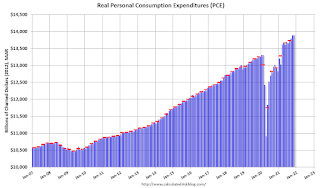
The following graph shows real Personal Consumption Expenditures (PCE) through November 2021 (2012 dollars). Note that the y-axis doesn't start at zero to better show the change.
 Click on graph for larger image.
The dashed red lines are the quarterly levels for real PCE.
Personal income was above expectations, and the increase in PCE was below expectations.
Using the two-month method to estimate Q4 PCE growth, PCE was increasing at a 5.7% annual rate in Q4 2021. (Using the mid-month method, PCE was increasing at 4.2%).
Weekly Initial Unemployment Claims Unchanged at 205,000
by Calculated Risk on 12/23/2021 08:34:00 AM
The DOL reported:
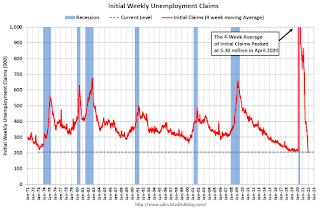
In the week ending December 18, the advance figure for seasonally adjusted initial claims was 205,000, unchanged from the previous week's revised level. The previous week's level was revised down by 1,000 from 206,000 to 205,000. The 4- week moving average was 206,250, an increase of 2,750 from the previous week's revised average. The previous week's average was revised down by 250 from 203,750 to 203,500.The following graph shows the 4-week moving average of weekly claims since 1971.
emphasis added
 Click on graph for larger image.
The dashed line on the graph is the current 4-week average. The four-week average of weekly unemployment claims increased to 206,000.
The previous week was revised down.
Regular state continued claims decreased to 1,859,000 (SA) from 1,867,000 (SA) the previous week.
Weekly claims were at the consensus forecast.
Wednesday, December 22, 2021
Thursday: Unemployment Claims, Durable Goods, Personal Income and Outlays, New Home Sales
by Calculated Risk on 12/22/2021 07:34:00 PM
Thursday:
• At 8:30 AM ET, the initial weekly unemployment claims report will be released. Initial claims were 206 thousand last week.
• Also, at 8:30 AM, Durable Goods Orders for November.
• Also, at 8:30 AM, Personal Income and Outlays for November. The consensus is for a 0.2% increase in personal income, and for a 1.0% increase in personal spending.
• At 10:00 AM, New Home Sales for November from the Census Bureau. The consensus is 766 thousand sales SAAR.
• Also, at 10:00 AM, University of Michigan's Consumer sentiment index (Final for December).
From CR on COVID (mostly focus on hospitalizations and deaths, although new cases are rising rapidly):
The CDC is the source for all data.
| COVID Metrics | ||||
|---|---|---|---|---|
| Today | Week Ago | Goal | ||
| Percent fully Vaccinated | 61.7% | --- | ≥70.0%1 | |
| Fully Vaccinated (millions) | 204.8 | --- | ≥2321 | |
| New Cases per Day3🚩 | 161,261 | 118,855 | ≤5,0002 | |
| Hospitalized3🚩 | 61,290 | 59,405 | ≤3,0002 | |
| Deaths per Day3🚩 | 1,223 | 1,112 | ≤502 | |
| 1 Minimum to achieve "herd immunity" (estimated between 70% and 85%). 2my goals to stop daily posts, 37-day average for Cases, Currently Hospitalized, and Deaths 🚩 Increasing 7-day average week-over-week for Cases, Hospitalized, and Deaths ✅ Goal met. | ||||
 Click on graph for larger image.
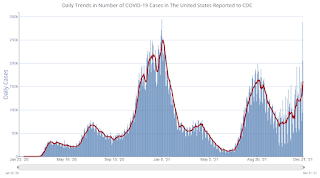
This graph shows the daily (columns) and 7-day average (line) of cases reported.
The scale might change soon (almost record number of new cases reported yesterday).
December Vehicle Sales Forecast: Decrease to 12.7 million SAAR
by Calculated Risk on 12/22/2021 03:23:00 PM
From WardsAuto: December U.S. Light-Vehicle Sales to Record 5-Month High Volume, but Seasonally Adjusted Rate Set to Fall from November (pay content)
Low inventories and supply issues continue to impact vehicle sales, but it appears the supply chain disruption bottom is in.

This graph shows actual sales from the BEA (Blue), and Wards forecast for December (Red).
The Wards forecast of 12.7 million SAAR, would be down about 1% from last month, and down 22% from a year ago (sales were solid in December 2020, as sales recovered from the depths of the pandemic, and weren't yet impacted by supply chain issues).
MBA Updated Economic and Mortgage Forecasts
by Calculated Risk on 12/22/2021 12:38:00 PM
The MBA released their updated Economic and Mortgage forecasts. Their prior forecast (included with several others) is here: 2022 Housing Forecasts: Second Look
A few highlights:
• Total mortgage originations are expected to decrease to $2.61T in 2022, as more of the activity shifts to the purchase market.
- Refinance originations are expected to drop to $870B.
- Purchase originations are forecast to eclipse 2021’s record high and reach $1.74T, backed by strong housing demand and rising home prices and sales.
• Home-price growth is forecast to moderate to 5.1%.
• Mortgage rates are expected to rise throughout the year and reach 4.0% by December 2022.
• Economic growth is forecast to be at 4.0% in 2022, with the unemployment rate declining to 3.5% by the end of the year.
More Analysis on November Existing Home Sales
by Calculated Risk on 12/22/2021 10:53:00 AM
Today, in the Real Estate Newsletter: Existing-Home Sales Increased to 6.46 million in November
Excerpt:
This graph shows existing home sales by month for 2020 and 2021.You can subscribe at https://calculatedrisk.substack.com/ (Currently all content is available for free, but please subscribe).
This was the fourth consecutive month with sales down year-over-year. Sales will likely be down YoY in December and probably in January 2022 too since were exceptionally strong last Winter.
...
[and on inventory] Months-of-supply at 2.1 months is very low, but still above the record low of 1.9 months set in December 2020 and January 2021. That record will be tested next month.
We will probably see inventory at a new record low over the Winter. Inventory is currently at 1.11 million (according to the NAR), and the record low was 1.03 million in January and February of 2021.
NAR: Existing-Home Sales Increased to 6.46 million in November
by Calculated Risk on 12/22/2021 10:11:00 AM
From the NAR: Existing-Home Sales Continue Upward, Increasing 1.9% in November
Existing-home sales rose in November, denoting three consecutive months of increases, according to the National Association of Realtors®. Three of the four major U.S. regions reported growth in monthly sales, while the fourth region held steady in November. From a year-over-year perspective, only one region experienced a rise in sales as the three others saw home sales decline.
Total existing-home sales, completed transactions that include single-family homes, townhomes, condominiums and co-ops, grew 1.9% from October to a seasonally adjusted annual rate of 6.46 million in November. Sales fell 2.0% from a year ago (6.59 million in November 2020).
...
Total housing inventory at the end of November amounted to 1.11 million units, down 9.8% from October and down 13.3% from one year ago (1.28 million). Unsold inventory sits at a 2.1-month supply at the current sales pace, a decline from both the prior month and from one year ago.
emphasis added
 Click on graph for larger image.
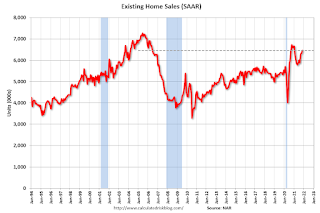
This graph shows existing home sales, on a Seasonally Adjusted Annual Rate (SAAR) basis since 1993.
Sales in November (6.46 million SAAR) were up 1.9% from last month and were 2.0% below the November 2020 sales rate.
The second graph shows nationwide inventory for existing homes.
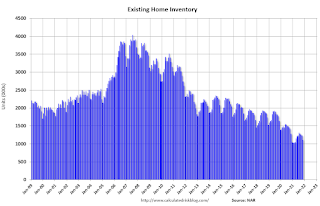 According to the NAR, inventory decreased to 1.11 million in November from 1.23 million in October.
Headline inventory is not seasonally adjusted, and inventory usually decreases to the seasonal lows in December and January, and peaks in mid-to-late summer.
The last graph shows the year-over-year (YoY) change in reported existing home inventory and months-of-supply. Since inventory is not seasonally adjusted, it really helps to look at the YoY change. Note: Months-of-supply is based on the seasonally adjusted sales and not seasonally adjusted inventory.
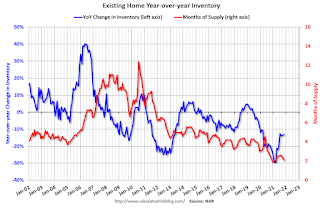 Inventory was down 13.3% year-over-year in November compared to November 2020.
Months of supply declined to 2.1 months in November from 2.3 months in October.
This was above the consensus forecast. I'll have more later.
The last graph shows the year-over-year (YoY) change in reported existing home inventory and months-of-supply. Since inventory is not seasonally adjusted, it really helps to look at the YoY change. Note: Months-of-supply is based on the seasonally adjusted sales and not seasonally adjusted inventory.
Inventory was down 13.3% year-over-year in November compared to November 2020. Months of supply declined to 2.1 months in November from 2.3 months in October.
This was above the consensus forecast. I'll have more later.
Q3 GDP Growth Revised up to 2.3% Annual Rate
by Calculated Risk on 12/22/2021 08:33:00 AM
From the BEA: Gross Domestic Product (Third Estimate), Corporate Profits (Revised Estimate), and GDP by Industry, Third Quarter 2021
Real gross domestic product (GDP) increased at an annual rate of 2.3 percent in the third quarter of 2021, according to the "third" estimate released by the Bureau of Economic Analysis. In the second quarter, real GDP increased 6.7 percent.Here is a Comparison of Third and Second Estimates. PCE growth was revised up from 1.7% to 2.0%. Residential investment was revised up from -8.3% to -7.7%.
The “third” estimate of GDP released today is based on more complete source data than were available for the "second" estimate issued last month. In the second estimate, the increase in real GDP was 2.1 percent. The update primarily reflects upward revisions to personal consumption expenditures (PCE) and private inventory investment that were partly offset by a downward revision to exports. Imports, which are a subtraction in the calculation of GDP, were revised down.
emphasis added


