 RSS Feed
 by Calculated Risk on 1/02/2022 06:36:00 PM
Sunday, January 02, 2022
Sunday Night Futures
Weekend:
• Schedule for Week of January 2, 2022
Monday:
• At 8:00 AM ET, Corelogic House Price index for November (might be Tuesday).
• At 10:00 AM, Construction Spending for November. The consensus is for a 0.6% increase in construction spending.
From CNBC: Pre-Market Data and Bloomberg futures S&P 500 futures are up 18 and DOW futures are up 128 (fair value).
Oil prices were up over the last week with WTI futures at $75.82 per barrel and Brent at $78.34 per barrel. A year ago, WTI was at $48, and Brent was at $51 - so WTI oil prices are up 50% year-over-year.
Here is a graph from Gasbuddy.com for nationwide gasoline prices. Nationally prices are at $3.26 per gallon. A year ago prices were at $2.24 per gallon, so gasoline prices are up $1.02 per gallon year-over-year.
Question #5 for 2022: Will the core inflation rate increase or decrease by December 2022?
by Calculated Risk on 1/02/2022 03:24:00 PM
Earlier I posted some questions on my blog: Ten Economic Questions for 2022. Some of these questions concern real estate (inventory, house prices, housing credit, housing starts, new home sales), and I posted those in the newsletter (others like GDP and employment will be on my blog).
I'm adding some thoughts, and maybe some predictions for each question.
5) Inflation: Core PCE was up 4.7% YoY through November. This was the highest YoY increase in core PCE since 1989. The FOMC is forecasting the YoY change in core PCE will be in the 2.5% to 3.0% range in Q4 2022. Will the core inflation rate increase or decrease by December 2022?
Although there are different measure for inflation, they all show inflation well above the Fed's 2% inflation target.
Note: I follow several measures of inflation, median CPI and trimmed-mean CPI from the Cleveland Fed. Core PCE prices (monthly from the BEA) and core CPI (from the BLS).
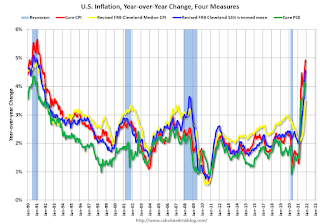
This graph shows the year-over-year change for these four key measures of inflation. The recent spike in inflation is obvious - and will likely get worse over the next few months. Goldman Sachs economists recently wrote:
"The current inflation surge is likely to get worse before it gets better"
On a year-over-year basis, the median CPI rose 3.5%, the trimmed-mean CPI rose 4.6%, and the CPI less food and energy rose 4.9%, and Core PCE increased 4.7% year-over-year.
The key question is will inflation trend down towards the Fed's target in 2022? The Fed is projecting core PCE inflation will decrease to 2.5% to 3.0% by Q4 2022.
On inflation Goldman Sachs is projecting a significant decline in inflation:
by the end of [2022] we expect core PCE inflation to fall to 2.5%. Admittedly, the key driver of our forecast—the partial resolution of supply-demand imbalances in the durable goods sector—is hard to time. But we do not see underlying wage growth or inflation expectations as inconsistent with the Fed’s 2% inflation goal, and therefore expect inflation to begin to come down meaningfully.
The pandemic was the cause of the inflation spike, with supply constraints, a shifting of demand from services to goods, large fiscal transfers, and a smaller labor force pushing up wages. If the pandemic eases, I expect these pressures to ease. My guess is core PCE inflation (year-over-year) will decrease in 2022 (from the current 4.7%), and I think core PCE inflation will be at or below 3% by the end of 2022.
Some thoughts:
• Question #1 for 2022: How much will the economy grow in 2022?
• Question #2 for 2022: Will the remaining jobs lost in 2020 return in 2022, or will job growth be sluggish?
• Question #3 for 2022: What will the unemployment rate be in December 2022?
• Question #4 for 2022: Will the overall participation rate increase to pre-pandemic levels (63.4% in February 2020)?
• Question #5 for 2022: Will the core inflation rate increase or decrease by December 2022?
• Question #6 for 2022: Will the Fed raise rates in 2022? If so, how many times?
• Question #7 for 2022: How about housing starts and new home sales in 2022?
• Question #8 for 2022: Housing Credit: Will we see easier mortgage lending in 2022?
• Question #9 for 2022: What will happen with house prices in 2022?
• Question #10 for 2022: Will inventory increase as the pandemic subsides, or will inventory decrease further in 2022?
Question #6 for 2022: Will the Fed raise rates in 2022? If so, how many times?
by Calculated Risk on 1/02/2022 11:57:00 AM
Earlier I posted some questions on my blog: Ten Economic Questions for 2022. Some of these questions concern real estate (inventory, house prices, housing credit, housing starts, new home sales), and I posted those in the newsletter (others like GDP and employment will be on my blog).
I'm adding some thoughts, and maybe some predictions for each question.
6) Monetary Policy: In response to the pandemic, the FOMC cut rates to zero, and initiated an asset purchase program in March 2020. The FOMC is currently on pace to stop the asset purchase program in March 2022. A majority of FOMC participants expect three rate hikes in 2022. Will the Fed raise rates in 2022? If so, how many times?
First, on asset purchases from the December 2021 FOMC statement:
"In light of inflation developments and the further improvement in the labor market, the Committee decided to reduce the monthly pace of its net asset purchases by $20 billion for Treasury securities and $10 billion for agency mortgage-backed securities. Beginning in January, the Committee will increase its holdings of Treasury securities by at least $40 billion per month and of agency mortgage‑backed securities by at least $20 billion per month. The Committee judges that similar reductions in the pace of net asset purchases will likely be appropriate each month, but it is prepared to adjust the pace of purchases if warranted by changes in the economic outlook."The current plan is to end asset purchases in March 2022.
As far as rates, in March 2020, in response to the pandemic, the Fed cut rates to essentially zero, and held rates at zero ever since. Now most analysts expect the FOMC to raise rates in 2022, perhaps as early as the March meeting.
From Goldman Sachs:
"High inflation is likely to keep the Fed on a quarterly tightening path next year. We expect the FOMC to raise rates three times starting in March and to announce the start of balance sheet runoff, which is likely to proceed more quickly than last cycle. Our forecast calls for three additional hikes per year in 2023 and 2024 and a terminal rate of 2.5-2.75%."
As of December, looking at the "dot plot", the FOMC participants see the following number of rate hikes in 2022:
Clearly the main view of the FOMC is three rate hikes in 2022.
| FOMC Members 2022 | |
|---|---|
| No Change | 0 |
| One Rate Hike | 1 |
| Two Rate Hikes | 5 |
| Three Rate Hikes | 10 |
| Four Rate Hikes | 2 |
Clearly the main view of the FOMC is three rate hikes in 2022.
The next two FOMC meetings are January 25th and 26th, and then March 15th and 16th. Currently I expect asset purchases to end as planned in March, and the 1st rate hike to happen at the March meeting, and perhaps a 2nd hike in June. Subsequent rate hikes will depend on the course of the pandemic, inflation and employment, but 3 rate hikes in 2022 seem likely. It also seems likely that the FOMC will announcement the end of reinvestment sometime in 2022 (start "balance sheet runoff").
Some thoughts:
Some thoughts:
• Question #1 for 2022: How much will the economy grow in 2022?
• Question #2 for 2022: Will the remaining jobs lost in 2020 return in 2022, or will job growth be sluggish?
• Question #3 for 2022: What will the unemployment rate be in December 2022?
• Question #4 for 2022: Will the overall participation rate increase to pre-pandemic levels (63.4% in February 2020)?
• Question #5 for 2022: Will the core inflation rate increase or decrease by December 2022?
• Question #6 for 2022: Will the Fed raise rates in 2022? If so, how many times?
• Question #7 for 2022: How about housing starts and new home sales in 2022?
• Question #8 for 2022: Housing Credit: Will we see easier mortgage lending in 2022?
• Question #9 for 2022: What will happen with house prices in 2022?
• Question #10 for 2022: Will inventory increase as the pandemic subsides, or will inventory decrease further in 2022?
• Question #2 for 2022: Will the remaining jobs lost in 2020 return in 2022, or will job growth be sluggish?
• Question #3 for 2022: What will the unemployment rate be in December 2022?
• Question #4 for 2022: Will the overall participation rate increase to pre-pandemic levels (63.4% in February 2020)?
• Question #5 for 2022: Will the core inflation rate increase or decrease by December 2022?
• Question #6 for 2022: Will the Fed raise rates in 2022? If so, how many times?
• Question #7 for 2022: How about housing starts and new home sales in 2022?
• Question #8 for 2022: Housing Credit: Will we see easier mortgage lending in 2022?
• Question #9 for 2022: What will happen with house prices in 2022?
• Question #10 for 2022: Will inventory increase as the pandemic subsides, or will inventory decrease further in 2022?
Saturday, January 01, 2022
Real Estate Newsletter Articles this Week
by Calculated Risk on 1/01/2022 02:11:00 PM
At the Calculated Risk Real Estate Newsletter this week:
• Question #7 for 2022: How much will Residential investment change in 2022? How about housing starts and new home sales in 2022?
• Question #8 for 2022: Housing Credit: Will we see easier mortgage lending in 2022?
• Question #9 for 2022: What will happen with house prices in 2022?
• Real House Prices, Price-to-Rent Ratio and Price-to-Median Income in October And a look at "Affordability"
• Case-Shiller National Index up 19.1% Year-over-year in October FHFA: "annual trends slowing over the last four consecutive months"
• Final Look at Local Housing Markets in November No Signs of Slowing; Inventory down Sharply
• Question #10 for 2022: Will inventory increase as the pandemic subsides, or will inventory decrease further in 2022?
This is usually published several times a week, and provides more in-depth analysis of the housing market.
The blog will continue as always!
You can subscribe at https://calculatedrisk.substack.com/ Most content is available for free, but please subscribe!.
You can subscribe at https://calculatedrisk.substack.com/ Most content is available for free, but please subscribe!.
Schedule for Week of January 2, 2022
by Calculated Risk on 1/01/2022 08:11:00 AM
Happy New Year! Wishing you all the best in 2022.
The key report this week is the December employment report on Friday.
Other key indicators include the December ISM manufacturing and services indexes, December vehicle sales, the November trade deficit, and November Job Openings.
8:00 AM ET: Corelogic House Price index for November.
10:00 AM: Construction Spending for November. The consensus is for a 0.6% increase in construction spending.
 10:00 AM ET: Job Openings and Labor Turnover Survey for October from the BLS.
 This graph shows job openings (yellow line), hires (purple), Layoff, Discharges and other (red column), and Quits (light blue column) from the JOLTS.
Jobs openings increased in October to 11.033 million from 10.602 million in September.
10:00 AM: ISM Manufacturing Index for December. The consensus is for the ISM to be at 60.2, down from 61.1 in November.
 All day: Light vehicle sales for December. Sales were at 12.86 million in November (Seasonally Adjusted Annual Rate). Wards Auto is projecting sales of 12.7 million SAAR in December.
This graph shows light vehicle sales since the BEA started keeping data in 1967. The dashed line is the November sales rate.
7:00 AM ET: The Mortgage Bankers Association (MBA) will release the results for the mortgage purchase applications index.
8:15 AM: The ADP Employment Report for December. This report is for private payrolls only (no government). The consensus is for 413,000, down from 534,000 jobs added in November.
8:30 AM: The initial weekly unemployment claims report will be released. Initial claims were 198 thousand last week.
 8:30 AM: Trade Balance report for November from the Census Bureau.
 This graph shows the U.S. trade deficit, with and without petroleum, through the most recent report. The blue line is the total deficit, and the black line is the petroleum deficit, and the red line is the trade deficit ex-petroleum products.
The consensus is the trade deficit to be $70.0 billion. The U.S. trade deficit was at $67.1 billion in October.
10:00 AM: the ISM Services Index for December.
 8:30 AM: Employment Report for December. There were 120 thousand jobs added in November, and the unemployment rate was at 4.2%. The consensus is for 400 thousand jobs added in December, and for the unemployment rate to decline to 4.1%.
This graph shows the job losses from the start of the employment recession, in percentage terms.
The current employment recession was by far the worst recession since WWII in percentage terms. However, the current employment recession, 20 months after the onset, is now significantly better than the worst of the "Great Recession"
Friday, December 31, 2021
"Highest Mortgage Rates in a Month, But Just Barely"
by Calculated Risk on 12/31/2021 05:15:00 PM
From Matthew Graham at MortgageNewsDaily: Highest Rates in a Month, But Just Barely
Mortgage rates began the week in decent shape, but moved higher somewhat abruptly yesterday. Context is important though. The smallest increment of adjustment for mortgages is typically 0.125%, and we haven't seen a move that big since early November. In fact, the overall range in 30yr fixed rates hasn't even been 0.125% during that time!
In other words, we're only able to say "highest rates in a month" because they finally trickled to just slightly higher levels. On that note, we might as well prepare for the next technicality. Specifically, if things get just a bit worse, we'll soon be able to say "highest rates in 9 months," even though they won't be too terribly different from today's.
 Click on graph for larger image.
This is a graph from Mortgage News Daily (MND) showing 30-year fixed rates from three sources (MND, MBA, Freddie Mac) since 2010.
The 30-year fixed rate for top tier scenarios was 3.27% yesterday, up from 3.26% on Wednesday. This is still historically very low.
If rates rise to 3.30% that will be highest since March 2021. And 3.46% would be the highest since rates spiked briefly at the beginning of the pandemic.
Go to MND and you can adjust the graph for different time periods.
Question #7 for 2022: How about housing starts and new home sales in 2022?
by Calculated Risk on 12/31/2021 12:23:00 PM
Today, in the Real Estate Newsletter: Question #7 for 2022: How much will Residential investment change in 2022? How about housing starts and new home sales in 2022?
A brief excerpt:
Earlier I posted some questions on my blog for next year: Ten Economic Questions for 2022. Some of these questions concern real estate (inventory, house prices, housing credit, housing starts, new home sales), and I’ll post those in the newsletter (others like GDP and employment will be on my blog).There is much more in the article. You can subscribe at https://calculatedrisk.substack.com/
I'm adding some thoughts, and maybe some predictions for each question.
...
Most analysts are looking for new home sales to increase in 2022. For example, the NAHB expects new home sales to increase to 840 thousand in 2022, and Fannie Mae expects 897 thousand, and the MBA is forecasting 922 thousand in 2022.
And for housing starts, Fannie Mae is forecasting starts will be mostly unchanged at 1.6 million, and the NAHB is forecasting a decline to 1.55 million.
My guess is starts will be down low-to-mid single digits year-over-year in 2022. New home sales could pick up solidly if existing home inventory stays low, supply issues are resolved, and mortgage rates stay low, but my guess is new home sales will be mostly unchanged year-over-year.
Lawler: More on the CoreLogic Home Investor Activity Report
by Calculated Risk on 12/31/2021 08:33:00 AM
From housing economist Tom Lawler:
Below is a table showing quarterly home sales based on CoreLogic’s property records database for “non-investors” and for “investors” based on size of investors. For fun I also included the YOY % change in the S&P/Case-Shiller National Home Price Index., As a reminder, here is how CoreLogic defines an investor purchase:
Using CoreLogic’s public records data, we define an investor as an entity (individual or corporate) who retained three or more properties simultaneously within the past 10 years or has a corporate or non-individual identifier on the deed. Examples include LLCs, CORPs, and INCs, to name a few.”CoreLogic’s “size” categories fir investors are as follows: small 3-10 properties, mid-sized 11-99 properties, and large 100+ properties.
 Click on table for larger image.
What is striking is that investor home purchases by investors in all three size categories exploded upward beginning in the second quarter.
Note that while total home purchases in the third quarter of this year were up 7.5% from the third quarter of 2019, non-investor home purchases were DOWN 5.2%.
I’ll have even more on this topic later. WRT the above chart, however, here are some questions to consider:
Did investor purchases surge BECAUSE home prices were accelerating? Or was the surge in investor purchases behind the surge in home prices? Or … was it a combination of both?
Thursday, December 30, 2021
COVID December 30, 2021: Record Cases; Focus on Hospitalizations and Deaths
by Calculated Risk on 12/30/2021 09:21:00 PM
There will be no COVID updates until January 3rd. Have a safe New Year.
The CDC is the source for all data.
| COVID Metrics | ||||
|---|---|---|---|---|
| Today | Week Ago | Goal | ||
| Percent fully Vaccinated | 62.0% | --- | ≥70.0%1 | |
| Fully Vaccinated (millions) | 205.8 | --- | ≥2321 | |
| New Cases per Day3🚩 | 316,277 | 176,457 | ≤5,0002 | |
| Hospitalized3🚩 | 67,324 | 61,699 | ≤3,0002 | |
| Deaths per Day3 | 1,100 | 1,216 | ≤502 | |
| 1 Minimum to achieve "herd immunity" (estimated between 70% and 85%). 2my goals to stop daily posts, 37-day average for Cases, Currently Hospitalized, and Deaths 🚩 Increasing 7-day average week-over-week for Cases, Hospitalized, and Deaths ✅ Goal met. | ||||
 Click on graph for larger image.
This graph shows the daily (columns) and 7-day average (line) of hospitalizations reported.
Hospitalizations have turned up sharply over the last few days.
 The second graph shows the daily (columns) and 7-day average (line) of new cases reported.
Fannie Mae: Mortgage Serious Delinquency Rate Decreased in November
by Calculated Risk on 12/30/2021 04:18:00 PM
Fannie Mae reported that the Single-Family Serious Delinquency decreased to 1.46% in November, from 1.33% in October. The serious delinquency rate is down from 2.96% in November 2020.
These are mortgage loans that are "three monthly payments or more past due or in foreclosure".
The Fannie Mae serious delinquency rate peaked in February 2010 at 5.59% following the housing bubble and peaked at 3.32% in August 2020 during the pandemic.

By vintage, for loans made in 2004 or earlier (1% of portfolio), 3.61% are seriously delinquent (down from 4.02% in October).
For loans made in 2005 through 2008 (2% of portfolio), 6.05% are seriously delinquent (down from 6.90%),
For recent loans, originated in 2009 through 2021 (97% of portfolio), 1.08% are seriously delinquent (down from 1.17%). So, Fannie is still working through a few poor performing loans from the bubble years.
Mortgages in forbearance are counted as delinquent in this monthly report, but they will not be reported to the credit bureaus.
This is very different from the increase in delinquencies following the housing bubble. Lending standards have been fairly solid over the last decade, and most of these homeowners have equity in their homes - and they will be able to restructure their loans once they are employed.
Freddie Mac reported earlier.

In Memoriam: Doris "Tanta" Dungey


| Privacy Policy |
| Copyright © 2007 - 2025 CR4RE LLC |
| Excerpts NOT allowed on x.com |