 RSS Feed
 by Calculated Risk on 1/04/2022 08:00:00 AM
Tuesday, January 04, 2022
CoreLogic: House Prices up 18.1% YoY in November
Notes: This CoreLogic House Price Index report is for November. The recent Case-Shiller index release was for October. The CoreLogic HPI is a three-month weighted average and is not seasonally adjusted (NSA).
From CoreLogic: CoreLogic Reports Annual Home Price Appreciation Continues to Accelerate; Up 18.1% in November
CoreLogic® ... today released the CoreLogic Home Price Index (HPI™) and HPI Forecast™ for November 2021.
While 2021 was a record-breaking year for U.S. home price growth, for many prospective buyers the hot housing market will continue to exacerbate ongoing affordability challenges into the new year — and beyond. Though home price growth remains at historic highs, it is projected to slow over the next year. However, economic growth and inflation will most likely lead to increases in mortgage rates, which will further erode affordability.
"Over the past year, we have seen one of the most robust seller's markets in a generation,” said Frank Martell, president and CEO of CoreLogic. “While increased interest rates may help cool down homebuying activity, we expect 2022 to be another strong year with continuing upward price growth."
...
Nationally, home prices increased 18.1% in November 2021, compared to November 2020. On a month-over-month basis, home prices increased by 1.3% compared to October 2021.
...
Home price gains are projected to slow to a 2.8% increase by November 2022.
emphasis added
Tuesday: Corelogic House Prices, Job Openings, ISM Mfg, Vehicle Sales
by Calculated Risk on 1/04/2022 12:03:00 AM
From Matthew Graham at Mortgage News Daily: Mortgage Rates Now Highest in 9 Months
The year is not off to a great start for mortgage rates. At the end of last week, we were already looking at the highest levels in months. The silver lining was that the past few months had seen a very narrow range with rates finally just barely breaking the previous highs. In other words, "highest in months" was a bit of a technicality. ... It's still the case that the "highest rates in 9 months" aren't insanely higher than anything we saw last week. From the lowest rates over the past 2 months, today's are roughly a quarter of a point higher. [30 year fixed 3.29%]Tuesday:
emphasis added
• At 8:00 AM ET, Corelogic House Price index for November.
• At 10:00 AM, Job Openings and Labor Turnover Survey for October from the BLS.
• Also, at 10:00 AM, ISM Manufacturing Index for December. The consensus is for the ISM to be at 60.2, down from 61.1 in November.
• All day, Light vehicle sales for December. Sales were at 12.86 million in November (Seasonally Adjusted Annual Rate). Wards Auto is projecting sales of 12.7 million SAAR in December.
Monday, January 03, 2022
Question #2 for 2022: Will the remaining jobs lost in 2020 return in 2022, or will job growth be sluggish?
by Calculated Risk on 1/03/2022 05:03:00 PM
Earlier I posted some questions on my blog: Ten Economic Questions for 2022. Some of these questions concern real estate (inventory, house prices, housing credit, housing starts, new home sales), and I posted those in the newsletter (others like GDP and employment will be on my blog).
I'm adding some thoughts, and maybe some predictions for each question.
2) Employment: Through November 2021, the economy added 6.1 million jobs in 2021. This makes 2021 the best year for job growth ever - by far. However, there are still 3.9 million fewer jobs than in February 2020 (pre-pandemic). Will the remaining jobs lost in 2020 return in 2022, or will job growth be sluggish?
Last year, I wrote: "I think something like 6 to 8 million jobs could be added in 2021". It looks like close to 6.5 million jobs were added in 2021. The previous record was 4.3 million in 1946 (post-WWII boom).
For review, here is a table of the monthly change in total nonfarm jobs in 2021.
| Jobs Added per Month in 2021 | ||
|---|---|---|
| Total nonfarm (000s) | ||
| Jan-21 | 233 | |
| Feb-21 | 536 | |
| Mar-21 | 785 | |
| Apr-21 | 269 | |
| May-21 | 614 | |
| Jun-21 | 962 | |
| Jul-21 | 1,091 | |
| Aug-21 | 483 | |
| Sep-21 | 379 | |
| Oct-21 | 546 | |
| Nov-21 | 210 | |
| Dec-21 | --- | |
The consensus forecast is for 400 thousand jobs added in December.
Unfortunately, it appears this will be another difficult winter with the pandemic, and it seems likely job growth will slow over the next couple of months. Also, given slow population growth it seems likely labor force growth will be sluggish in 2022.
My guess is something like 2.5 to 3.0 million jobs could be added in 2022, but it will depend on the pandemic (and policy). This fits with my view of sluggish labor force growth, an increase in the participation rate, and a decline in the unemployment rate. That would mean there are still fewer jobs at the end of 2022, than before the pandemic.
Some thoughts:
• Question #1 for 2022: How much will the economy grow in 2022?
• Question #2 for 2022: Will the remaining jobs lost in 2020 return in 2022, or will job growth be sluggish?
• Question #3 for 2022: What will the unemployment rate be in December 2022?
• Question #4 for 2022: Will the overall participation rate increase to pre-pandemic levels (63.4% in February 2020)?
• Question #5 for 2022: Will the core inflation rate increase or decrease by December 2022?
• Question #6 for 2022: Will the Fed raise rates in 2022? If so, how many times?
• Question #7 for 2022: How about housing starts and new home sales in 2022?
• Question #8 for 2022: Housing Credit: Will we see easier mortgage lending in 2022?
• Question #9 for 2022: What will happen with house prices in 2022?
• Question #10 for 2022: Will inventory increase as the pandemic subsides, or will inventory decrease further in 2022?
Question #3 for 2022: What will the unemployment rate be in December 2022?
by Calculated Risk on 1/03/2022 03:02:00 PM
Earlier I posted some questions on my blog: Ten Economic Questions for 2022. Some of these questions concern real estate (inventory, house prices, housing credit, housing starts, new home sales), and I posted those in the newsletter (others like GDP and employment will be on my blog).
I'm adding some thoughts, and maybe some predictions for each question.
3) Unemployment Rate: The unemployment rate was at 4.2% in November, down 2.5 percentage points year-over-year. Currently the FOMC is forecasting the unemployment rate will be in the 3.4% to 3.7% range in Q4 2022. What will the unemployment rate be in December 2022?
Here is a graph of the unemployment rate over time:
 Click on graph for larger image.
The unemployment rate decreased in November to 4.2% from 4.6% in October, and down from 6.7% in November 2020.
The unemployment rate is from the household survey (CPS), and the rapid decline in the unemployment rate is due to a combination of job growth and sluggish increase in the participation rate (previous question).
 The second graph shows the job losses from the start of the employment recession, in percentage terms.
The current employment recession was by far the worst recession since WWII in percentage terms. However, the current employment recession, 20 months after the onset, is now significantly better than the worst of the "Great Recession".
It took several years to recover all the jobs lost following the 2001 and 2007 recessions, and so far, jobs are recovering quicker this time.
 The third graph shows permanent job losers as a percent of the pre-recession peak in employment through the November report.
This data is only available back to 1994, so there is only data for three recessions.
In November, the number of permanent job losers decreased to 1.921 million from 2.126 million in October.
These jobs will likely be the hardest to recover, so it is a positive that the number of permanent job losers is declining fairly rapidly.
Goldman Sachs expects:
Depending on the estimate for the participation rate and job growth (next question), my guess is the unemployment rate will decline into the mid 3% range by December 2022 from the current 4.2%. "With labor demand red hot and enhanced unemployment benefits now expired, we expect the unemployment rate to return to the pre-pandemic 50-year low of 3.5% by the end of 2022."
Some thoughts:
• Question #1 for 2022: How much will the economy grow in 2022?
• Question #2 for 2022: Will the remaining jobs lost in 2020 return in 2022, or will job growth be sluggish?
• Question #3 for 2022: What will the unemployment rate be in December 2022?
• Question #4 for 2022: Will the overall participation rate increase to pre-pandemic levels (63.4% in February 2020)?
• Question #5 for 2022: Will the core inflation rate increase or decrease by December 2022?
• Question #6 for 2022: Will the Fed raise rates in 2022? If so, how many times?
• Question #7 for 2022: How about housing starts and new home sales in 2022?
• Question #8 for 2022: Housing Credit: Will we see easier mortgage lending in 2022?
• Question #9 for 2022: What will happen with house prices in 2022?
• Question #10 for 2022: Will inventory increase as the pandemic subsides, or will inventory decrease further in 2022?
• Question #2 for 2022: Will the remaining jobs lost in 2020 return in 2022, or will job growth be sluggish?
• Question #3 for 2022: What will the unemployment rate be in December 2022?
• Question #4 for 2022: Will the overall participation rate increase to pre-pandemic levels (63.4% in February 2020)?
• Question #5 for 2022: Will the core inflation rate increase or decrease by December 2022?
• Question #6 for 2022: Will the Fed raise rates in 2022? If so, how many times?
• Question #7 for 2022: How about housing starts and new home sales in 2022?
• Question #8 for 2022: Housing Credit: Will we see easier mortgage lending in 2022?
• Question #9 for 2022: What will happen with house prices in 2022?
• Question #10 for 2022: Will inventory increase as the pandemic subsides, or will inventory decrease further in 2022?
Question #4 for 2022: Will the overall participation rate increase to pre-pandemic levels (63.4% in February 2020)?
by Calculated Risk on 1/03/2022 12:52:00 PM
Earlier I posted some questions on my blog: Ten Economic Questions for 2022. Some of these questions concern real estate (inventory, house prices, housing credit, housing starts, new home sales), and I posted those in the newsletter (others like GDP and employment will be on my blog).
I'm adding some thoughts, and maybe some predictions for each question.
4) Participation Rate: In November 2021, the overall participation rate was at 61.8%, up year-over-year from 61.5% in November 2020. Long term, the BLS is projecting the overall participation rate will decline to 60.4% by 2030 due to demographics. Will the overall participation rate increase to pre-pandemic levels (63.4% in February 2020)? What will be the participation rate in December 2022?
The overall labor force participation rate is the percentage of the working age population (16 + years old) in the labor force. A large portion of the decline in the participation rate since 2000 was due to demographics and long-term trends.
 The Labor Force Participation Rate in November 2021 was at 61.8 (red), down from the pre-pandemic level of 63.4% in February, and up from the pandemic low of 60.2% in April 2020. (Blue is the employment population ratio).
In April 2020, 8.0 million people had left the labor force due to the pandemic. By November 2021, about 5.6 million had returned to the labor force, leaving 2.4 million fewer people in the labor force than prior to the pandemic. And this doesn't count for growth in the 18+ population.
In November 2021, Goldman Sachs economists put out a research note on the labor force participation rate: Why Isn’t Labor Force Participation Recovering?
My guess, based on the impact of the pandemic easing, is that most of these people will return to the labor force. I don't expect that participation rate to increase to pre-pandemic levels (63.4%), but it seems reasonable the participation rate will increase to the mid 62s by year end, before trending down again later in the decade.
Some thoughts:
In November 2021, Goldman Sachs economists put out a research note on the labor force participation rate: Why Isn’t Labor Force Participation Recovering?
Here are few excerpts from the note:
 This data is comparing November 2021 to November 2019, using Not Seasonally Adjusted (NSA) data (I compared to November 2019 to minimize the seasonal impact when using NSA data).
"While the unemployment rate continues to fall quickly, labor force participation has made no progress since August 2020. ... Most of the 5.0mn persons who have exited the labor force since the start of the pandemic are over age 55 (3.4mn), largely reflecting early (1.5mn) and natural (1mn) retirements that likely won’t reverse. The outlook for prime-age persons who have exited the labor force (1.7mn) is more positive, since very few are discouraged and most still view their exits as temporary."
Note: The 5 million number for the labor force, probably assumes some normal labor force growth; however, overall population growth has been dismal over the last 2 years (little immigration and large number of deaths). I'm not confident in Goldman's 5-million-person estimate.
Here is a graph of the number of missing people by age group (from the CPS household survey).
This data is comparing November 2021 to November 2019, using Not Seasonally Adjusted (NSA) data (I compared to November 2019 to minimize the seasonal impact when using NSA data).Positive numbers are missing workers.
Almost all of the missing employed workers - by this method - are in the 25 to 29 and in the 45 to 59 age groups.
Note: this is over a 2-year period, and there have been some demographic shifts between cohorts.
This data would suggest most of the missing workers are prime age or took early retirement (the missing workers in their '50s).
Note: In September, the BLS released their updated Labor Force projections through 2030. Their projections show the overall Labor Force Participation Rate (LFPR) declining to 60.4% in 2030. We need to remember this demographic trend.
My guess, based on the impact of the pandemic easing, is that most of these people will return to the labor force. I don't expect that participation rate to increase to pre-pandemic levels (63.4%), but it seems reasonable the participation rate will increase to the mid 62s by year end, before trending down again later in the decade.
Some thoughts:
• Question #1 for 2022: How much will the economy grow in 2022?
• Question #2 for 2022: Will the remaining jobs lost in 2020 return in 2022, or will job growth be sluggish?
• Question #3 for 2022: What will the unemployment rate be in December 2022?
• Question #4 for 2022: Will the overall participation rate increase to pre-pandemic levels (63.4% in February 2020)?
• Question #5 for 2022: Will the core inflation rate increase or decrease by December 2022?
• Question #6 for 2022: Will the Fed raise rates in 2022? If so, how many times?
• Question #7 for 2022: How about housing starts and new home sales in 2022?
• Question #8 for 2022: Housing Credit: Will we see easier mortgage lending in 2022?
• Question #9 for 2022: What will happen with house prices in 2022?
• Question #10 for 2022: Will inventory increase as the pandemic subsides, or will inventory decrease further in 2022?
• Question #2 for 2022: Will the remaining jobs lost in 2020 return in 2022, or will job growth be sluggish?
• Question #3 for 2022: What will the unemployment rate be in December 2022?
• Question #4 for 2022: Will the overall participation rate increase to pre-pandemic levels (63.4% in February 2020)?
• Question #5 for 2022: Will the core inflation rate increase or decrease by December 2022?
• Question #6 for 2022: Will the Fed raise rates in 2022? If so, how many times?
• Question #7 for 2022: How about housing starts and new home sales in 2022?
• Question #8 for 2022: Housing Credit: Will we see easier mortgage lending in 2022?
• Question #9 for 2022: What will happen with house prices in 2022?
• Question #10 for 2022: Will inventory increase as the pandemic subsides, or will inventory decrease further in 2022?
Construction Spending Increased 0.4% in November
by Calculated Risk on 1/03/2022 10:36:00 AM
From the Census Bureau reported that overall construction spending increased 0.2%:
Construction spending during November 2021 was estimated at a seasonally adjusted annual rate of $1,625.9 billion, 0.4 percent above the revised October estimate of $1,618.8 billion. The November figure is 9.3 percent above the November 2020 estimate of $1,487.2 billion.Private spending increased and public spending decreased:
emphasis added
Spending on private construction was at a seasonally adjusted annual rate of $1,273.6 billion, 0.6 percent above the revised October estimate of $1,265.8 billion. ...
In November, the estimated seasonally adjusted annual rate of public construction spending was $352.3 billion, 0.2 percent below the revised October estimate of $353.0 billion.
 Click on graph for larger image.
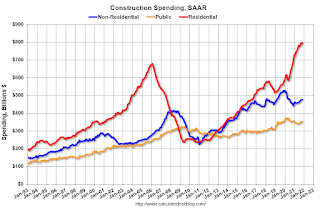
This graph shows private residential and nonresidential construction spending, and public spending, since 1993. Note: nominal dollars, not inflation adjusted.
Residential spending is 17% above the bubble peak (in nominal terms - not adjusted for inflation).
Non-residential spending is 15% above the bubble era peak in January 2008 (nominal dollars) but has been soft recently.
Public construction spending is 8% above the peak in March 2009.
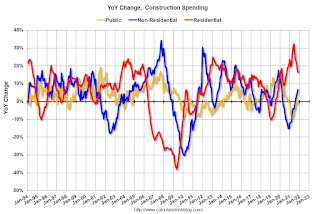 The second graph shows the year-over-year change in construction spending.
On a year-over-year basis, private residential construction spending is up 16.3%. Non-residential spending is up 6.7% year-over-year. Public spending is down 0.8% year-over-year.
Construction was considered an essential service during the early months of the pandemic in most areas and did not decline sharply like many other sectors. However, some sectors of non-residential have been under pressure. For example, lodging is down 30.7% YoY.
This was below consensus expectations of a 0.6% increase in spending; however, construction spending for the previous two months was revised up.
Housing Inventory January 3rd Update: Inventory Down 5.4% Week-over-week; New Record Low
by Calculated Risk on 1/03/2022 10:14:00 AM
Tracking existing home inventory is very important in 2022.
Inventory usually declines sharply over the holidays, and this is a new record low for this series.
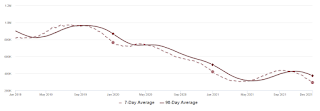
This inventory graph is courtesy of Altos Research.
As of December 31st, inventory was at 294 thousand (7-day average), compared to 420 thousand for the same week a year ago. That is a decline of 30.0%. Inventory is down 5.4% from last week.
Compared to the same week in 2019, inventory is down 61.5% from 764 thousand. A week ago, inventory was at 310 thousand, and was down 29.0% YoY.
Seasonally, inventory bottomed in April (usually inventory bottoms in January or February). Inventory last week was about 4.2% below the previous record low set-in early April 2021.
Inventory peaked for the year in early September, when inventory was at 437 thousand (the peak for the year), so inventory is currently off about 32.8% from the peak for 2021.
Mike Simonsen discusses this data regularly on Youtube.
Seven High Frequency Indicators for the Economy
by Calculated Risk on 1/03/2022 08:58:00 AM
These indicators are mostly for travel and entertainment. It is interesting to watch these sectors recover as the pandemic subsides.
The TSA is providing daily travel numbers.
This data is as of January 1st.
 Click on graph for larger image.
This data shows the 7-day average of daily total traveler throughput from the TSA for 2019 (Light Blue), 2020 (Black), 2021 (Blue) and 2021 (Red).
The dashed line is the percent of 2019 for the seven-day average.
The 7-day average is down 17.8% from the same day in 2019 (82.2% of 2019). (Dashed line)
Air travel had been off about 20% relative to 2019 for the last five months (with some ups and downs) - but picked up over the Thanksgiving and Christmas holidays.
The second graph shows the 7-day average of the year-over-year change in diners as tabulated by OpenTable for the US and several selected cities.
IMPORTANT: OpenTable notes: "we’ve updated the data including downloadable dataset from January 1, 2021 onward to compare seated diners from 2021 to 2019, as opposed to year over year." Thanks!
 Thanks to OpenTable for providing this restaurant data:
This data is updated through January 1, 2022.
This data is "a sample of restaurants on the OpenTable network across all channels: online reservations, phone reservations, and walk-ins. For year-over-year comparisons by day, we compare to the same day of the week from the same week in the previous year."
Note that this data is for "only the restaurants that have chosen to reopen in a given market". Since some restaurants have not reopened, the actual year-over-year decline is worse than shown.
Dining was mostly moving sideways, but there has been some decline recently, probably due to the winter wave of COVID. The 7-day average for the US is down 13% compared to 2019.
Thanks to OpenTable for providing this restaurant data:This data is updated through January 1, 2022.
This data is "a sample of restaurants on the OpenTable network across all channels: online reservations, phone reservations, and walk-ins. For year-over-year comparisons by day, we compare to the same day of the week from the same week in the previous year."
Note that this data is for "only the restaurants that have chosen to reopen in a given market". Since some restaurants have not reopened, the actual year-over-year decline is worse than shown.
Dining was mostly moving sideways, but there has been some decline recently, probably due to the winter wave of COVID. The 7-day average for the US is down 13% compared to 2019.
 This data shows domestic box office for each week and the median for the years 2016 through 2019 (dashed light blue).
 Blue is 2020 and Red is 2021.
The data is from BoxOfficeMojo through December 30th.
Note that the data is usually noisy week-to-week and depends on when blockbusters are released.
Movie ticket sales were at $204 million last week, down about 44% from the median for the week.
Note that the data is usually noisy week-to-week and depends on when blockbusters are released.
Movie ticket sales were at $204 million last week, down about 44% from the median for the week.
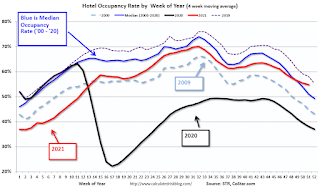 This graph shows the seasonal pattern for the hotel occupancy rate using the four-week average.
 The red line is for 2021, black is 2020, blue is the median, dashed purple is 2019, and dashed light blue is for 2009 (the worst year on record for hotels prior to 2020).
This data is through December 18th. The occupancy rate was up 8.0% compared to the same week in 2019. Although down compared to 2019, the 4-week average of the occupancy rate is now above the median rate for the previous 20 years (Blue).
Notes: Y-axis doesn't start at zero to better show the seasonal change.
The 4-week average of the occupancy rate will bottom seasonally over the next few weeks.
 This graph, based on weekly data from the U.S. Energy Information Administration (EIA), shows gasoline supplied compared to the same week of 2019.
Blue is for 2020. Red is for 2021.
As of December 24th, gasoline supplied was up 8.5% compared to the same week in 2019.
There have been 13 weeks this year that gasoline supplied was up compared to the same week in 2019 - so consumption is running close to 2019 levels now.
This graph is from Apple mobility. From Apple: "This data is generated by counting the number of requests made to Apple Maps for directions in select countries/regions, sub-regions, and cities." This is just a general guide - people that regularly commute probably don't ask for directions.
There is also some great data on mobility from the Dallas Fed Mobility and Engagement Index. However the index is set "relative to its weekday-specific average over January–February", and is not seasonally adjusted, so we can't tell if an increase in mobility is due to recovery or just the normal increase in the Spring and Summer.
 This data is through December 31st
 for the United States and several selected cities.
The graph is the running 7-day average to remove the impact of weekends.
IMPORTANT: All data is relative to January 13, 2020. This data is NOT Seasonally Adjusted. People walk and drive more when the weather is nice, so I'm just using the transit data.
According to the Apple data directions requests, public transit in the 7-day average for the US is at 81% of the January 2020 level.
New York City is doing OK by this metric, but subway usage in NYC is down significantly (next graph).
----- New York City Subway Usage -----
Here is some interesting data on New York subway usage (HT BR).
 This graph is from Todd W Schneider.
Here is some interesting data on New York subway usage (HT BR).
This graph is from Todd W Schneider. This graph shows how much MTA traffic has recovered in each borough (Graph starts at first week in January 2020 and 100 = 2019 average).
Manhattan is at about 26% of normal (impacted by holidays too).
This data is through Friday, December 31st.
He notes: "Data updates weekly from the MTA’s public turnstile data, usually on Saturday mornings".
Sunday, January 02, 2022
Sunday Night Futures
by Calculated Risk on 1/02/2022 06:36:00 PM
Weekend:
• Schedule for Week of January 2, 2022
Monday:
• At 8:00 AM ET, Corelogic House Price index for November (might be Tuesday).
• At 10:00 AM, Construction Spending for November. The consensus is for a 0.6% increase in construction spending.
From CNBC: Pre-Market Data and Bloomberg futures S&P 500 futures are up 18 and DOW futures are up 128 (fair value).
Oil prices were up over the last week with WTI futures at $75.82 per barrel and Brent at $78.34 per barrel. A year ago, WTI was at $48, and Brent was at $51 - so WTI oil prices are up 50% year-over-year.
Here is a graph from Gasbuddy.com for nationwide gasoline prices. Nationally prices are at $3.26 per gallon. A year ago prices were at $2.24 per gallon, so gasoline prices are up $1.02 per gallon year-over-year.
Question #5 for 2022: Will the core inflation rate increase or decrease by December 2022?
by Calculated Risk on 1/02/2022 03:24:00 PM
Earlier I posted some questions on my blog: Ten Economic Questions for 2022. Some of these questions concern real estate (inventory, house prices, housing credit, housing starts, new home sales), and I posted those in the newsletter (others like GDP and employment will be on my blog).
I'm adding some thoughts, and maybe some predictions for each question.
5) Inflation: Core PCE was up 4.7% YoY through November. This was the highest YoY increase in core PCE since 1989. The FOMC is forecasting the YoY change in core PCE will be in the 2.5% to 3.0% range in Q4 2022. Will the core inflation rate increase or decrease by December 2022?
Although there are different measure for inflation, they all show inflation well above the Fed's 2% inflation target.
Note: I follow several measures of inflation, median CPI and trimmed-mean CPI from the Cleveland Fed. Core PCE prices (monthly from the BEA) and core CPI (from the BLS).
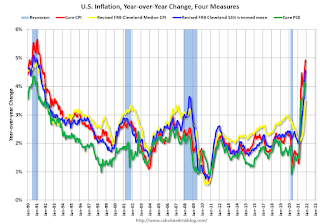
This graph shows the year-over-year change for these four key measures of inflation. The recent spike in inflation is obvious - and will likely get worse over the next few months. Goldman Sachs economists recently wrote:
"The current inflation surge is likely to get worse before it gets better"
On a year-over-year basis, the median CPI rose 3.5%, the trimmed-mean CPI rose 4.6%, and the CPI less food and energy rose 4.9%, and Core PCE increased 4.7% year-over-year.
The key question is will inflation trend down towards the Fed's target in 2022? The Fed is projecting core PCE inflation will decrease to 2.5% to 3.0% by Q4 2022.
On inflation Goldman Sachs is projecting a significant decline in inflation:
by the end of [2022] we expect core PCE inflation to fall to 2.5%. Admittedly, the key driver of our forecast—the partial resolution of supply-demand imbalances in the durable goods sector—is hard to time. But we do not see underlying wage growth or inflation expectations as inconsistent with the Fed’s 2% inflation goal, and therefore expect inflation to begin to come down meaningfully.
The pandemic was the cause of the inflation spike, with supply constraints, a shifting of demand from services to goods, large fiscal transfers, and a smaller labor force pushing up wages. If the pandemic eases, I expect these pressures to ease. My guess is core PCE inflation (year-over-year) will decrease in 2022 (from the current 4.7%), and I think core PCE inflation will be at or below 3% by the end of 2022.
Some thoughts:
• Question #1 for 2022: How much will the economy grow in 2022?
• Question #2 for 2022: Will the remaining jobs lost in 2020 return in 2022, or will job growth be sluggish?
• Question #3 for 2022: What will the unemployment rate be in December 2022?
• Question #4 for 2022: Will the overall participation rate increase to pre-pandemic levels (63.4% in February 2020)?
• Question #5 for 2022: Will the core inflation rate increase or decrease by December 2022?
• Question #6 for 2022: Will the Fed raise rates in 2022? If so, how many times?
• Question #7 for 2022: How about housing starts and new home sales in 2022?
• Question #8 for 2022: Housing Credit: Will we see easier mortgage lending in 2022?
• Question #9 for 2022: What will happen with house prices in 2022?
• Question #10 for 2022: Will inventory increase as the pandemic subsides, or will inventory decrease further in 2022?
• Question #2 for 2022: Will the remaining jobs lost in 2020 return in 2022, or will job growth be sluggish?
• Question #3 for 2022: What will the unemployment rate be in December 2022?
• Question #4 for 2022: Will the overall participation rate increase to pre-pandemic levels (63.4% in February 2020)?
• Question #5 for 2022: Will the core inflation rate increase or decrease by December 2022?
• Question #6 for 2022: Will the Fed raise rates in 2022? If so, how many times?
• Question #7 for 2022: How about housing starts and new home sales in 2022?
• Question #8 for 2022: Housing Credit: Will we see easier mortgage lending in 2022?
• Question #9 for 2022: What will happen with house prices in 2022?
• Question #10 for 2022: Will inventory increase as the pandemic subsides, or will inventory decrease further in 2022?

In Memoriam: Doris "Tanta" Dungey


| Privacy Policy |
| Copyright © 2007 - 2025 CR4RE LLC |
| Excerpts NOT allowed on x.com |