 RSS Feed
 by Calculated Risk on 1/05/2022 01:46:00 PM
Wednesday, January 05, 2022
Reis: Office Vacancy Rates Decreased Slightly in Q4
Reis reported the office vacancy rate was at 18.1% in Q4 2021, down from 18.2% in Q3, and up from 17.8% in Q4 2020.
Q2 2021 saw the highest vacancy rate for offices since the early '90s at 18.5% (following the S&L crisis).
 Click on graph for larger image.
The first graph shows the office vacancy rate starting in 1980 (prior to 1999 the data is annual).
Reis also reported that office effective rents were unchanged in Q4; rents are about the same rate as early 2019.
Click on graph for larger image.The first graph shows the office vacancy rate starting in 1980 (prior to 1999 the data is annual).
The office vacancy rate was elevated prior to the pandemic and moved up during the pandemic.
Reis also reported that office effective rents were unchanged in Q4; rents are about the same rate as early 2019.
All vacancy data courtesy of Reis
Annual Vehicle Sales increase 3% in 2021; Sales Mix and Heavy Trucks
by Calculated Risk on 1/05/2022 11:23:00 AM
The BEA released their estimate of light vehicle sales for December today. The BEA estimates sales of 12.44 million SAAR in December 2021 (Seasonally Adjusted Annual Rate), down 3.3% from the November sales rate, and down 23.8% from December 2020.
 Click on graph for larger image.
The first graph shows annual sales since 1976.
Light vehicle sales in 2021 were at 14.93 million, up 3.1% from 14.47 million in 2020.
Sales in 2021 were impacted significantly by supply chain disruptions, and sales were still down 12% from the 2019 level.
This suggests vehicle sales will increase in 2022 and boost GDP.
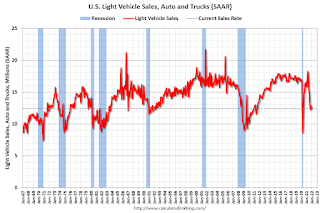 This graph shows monthly light vehicle sales since 1967 from the BEA. The dashed line is sales for the current month.
The impact of COVID-19 was significant, and April 2020 was the worst month. After April 2020, sales increased, and were close to sales in 2019 (the year before the pandemic).
This graph shows monthly light vehicle sales since 1967 from the BEA. The dashed line is sales for the current month.The impact of COVID-19 was significant, and April 2020 was the worst month. After April 2020, sales increased, and were close to sales in 2019 (the year before the pandemic).
However, sales decreased earlier this year due to supply issues. It appears the "supply chain bottom" was in September, but sales in December were disappointing again.
This third graph shows sales for passenger cars and trucks / SUVs through December 2021.
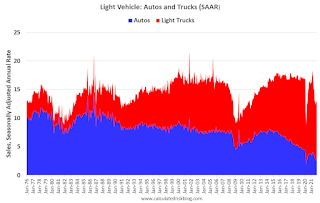 Over time the mix has changed more and more towards light trucks and SUVs (red).
The percent of light trucks and SUVs was at 79% in December 2021 - near the all-time high.
The fourth graph shows heavy truck sales since 1967 using data from the BEA. The dashed line is the December 2021 seasonally adjusted annual sales rate (SAAR).
Heavy truck sales really collapsed during the great recession, falling to a low of 180 thousand SAAR in May 2009. Then heavy truck sales increased to a new all-time high of 563 thousand SAAR in September 2019.
Note: "Heavy trucks - trucks more than 14,000 pounds gross vehicle weight."
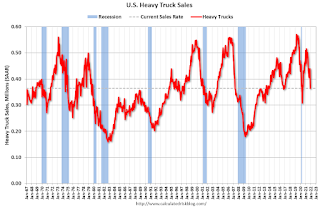 Heavy truck sales declined sharply at the beginning of the pandemic, falling to a low of 308 thousand SAAR in May 2020.
 Heavy truck sales were at 364 thousand SAAR in December, down from 439 thousand SAAR in November, and down 19.5% from 452 thousand SAAR in December 2020. The decline is probably due to supply disruptions.
ADP: Private Employment increased 807,000 in December
by Calculated Risk on 1/05/2022 08:20:00 AM
Private sector employment increased by 807,000 jobs from November to December according to the December ADP® National Employment ReportTM. Broadly distributed to the public each month, free of charge, the ADP National Employment Report is produced by the ADP Research Institute® in collaboration with Moody’s Analytics. The report, which is derived from ADP’s actual data of those who are on a company’s payroll, measures the change in total nonfarm private employment each month on a seasonally-adjusted basisThis was well above the consensus forecast of 413,000 for this report.
“December’s job market strengthened as the fallout from the Delta variant faded and Omicron’s impact had yet to be seen,” said Nela Richardson, chief economist, ADP. “Job gains were broad-based, as goods producers added the strongest reading of the year, while service providers dominated growth. December’s job growth brought the fourth quarter average to 625,000, surpassing the 514,000 average for the year. While job gains eclipsed 6 million in 2021, private sector payrolls are still nearly 4 million jobs short of pre-COVID-19 levels.
emphasis added
The BLS report will be released Friday, and the consensus is for 400 thousand non-farm payroll jobs added in December. The ADP report has not been very useful in predicting the BLS report.
MBA: Mortgage Applications Decrease over Two-Week Period
by Calculated Risk on 1/05/2022 07:00:00 AM
From the MBA: Mortgage Applications Decreased Over a Two-Week Period in Latest
MBA Weekly Survey
Mortgage applications decreased 2.7 percent from two weeks earlier, according to data from the Mortgage Bankers Association’s (MBA) Weekly Mortgage Applications Survey for the week ending December 31, 2021. The results include adjustments to account for the holidays.
... The holiday adjusted Refinance Index decreased 2 percent from the two weeks ago and was 40 percent lower than the same week one year ago. The seasonally adjusted Purchase Index decreased 4 percent from two weeks earlier. The unadjusted Purchase Index decreased 32 percent compared with the two weeks ago and was 12 percent lower than the same week one year ago.
“Mortgage rates continued to creep higher over the past two weeks, as markets maintained an optimistic view of the economy. The 30-year fixed rate increased 6 basis points to 3.33 percent – the highest since April 2021. The higher rates to close 2021 caused refinance activity to decrease 2.2 percent. Refinance demand continues to dwindle, as many borrowers refinanced in 2020, and in early 2021 – when mortgage rates were around 40 basis points lower,” said Joel Kan, MBA’s Associate Vice President of Economic and Industry Forecasting. “The purchase market also finished the year on a slower note, with the final week coming in at the weakest since October 2021. Even though average loan sizes were lower, home price appreciation remains at very high levels.”
Added Kan, “Despite supply and affordability challenges, 2021 was a record year for purchase originations. MBA expects 2022 to be even stronger, with total purchase activity reaching $1.74 trillion.”
...
The average contract interest rate for 30-year fixed-rate mortgages with conforming loan balances ($548,250 or less) increased to 3.33 percent from 3.31 percent, with points increasing to 0.48 from 0.38 (including the origination fee) for 80 percent loan-to-value ratio (LTV) loans.
emphasis added
 Click on graph for larger image.
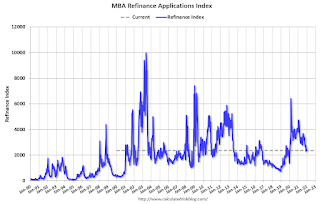
The first graph shows the refinance index since 1990.
With relatively low rates, the index remains slightly elevated, but down sharply from last year.
The second graph shows the MBA mortgage purchase index
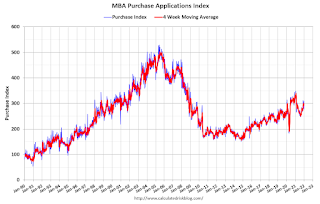 According to the MBA, purchase activity is down 12% year-over-year unadjusted.
Note: Red is a four-week average (blue is weekly).
Tuesday, January 04, 2022
December Vehicles Sales decreased to 12.44 million SAAR
by Calculated Risk on 1/04/2022 09:42:00 PM
Wards Auto released their estimate of light vehicle sales for December. Wards Auto estimates sales of 12.44 million SAAR in December 2021 (Seasonally Adjusted Annual Rate), down 3.2% from the November sales rate, and down 23.7% from December 2020.
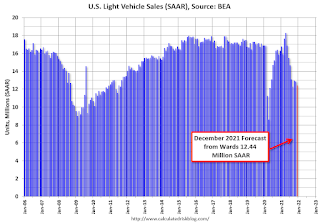 Click on graph for larger image.
This graph shows light vehicle sales since 2006 from the BEA (blue) and Wards Auto's estimate for December (red).
The impact of COVID-19 was significant, and April 2020 was the worst month.
After April 2020, sales increased, and were close to sales in 2019 (the year before the pandemic).
However, sales decreased earlier this year due to supply issues. It appears the "supply chain bottom" was in September, but sales in December were disappointing again.
Wednesday: ADP Employment
by Calculated Risk on 1/04/2022 08:27:00 PM
Wednesday:
• At 7:00 AM ET, The Mortgage Bankers Association (MBA) will release the results for the mortgage purchase applications index.
• 8:15 AM, The ADP Employment Report for December. This report is for private payrolls only (no government). The consensus is for 413,000, down from 534,000 jobs added in November.
And on COVID (focus on hospitalizations and deaths):
| COVID Metrics | ||||
|---|---|---|---|---|
| Today | Week Ago | Goal | ||
| Percent fully Vaccinated | 62.2% | --- | ≥70.0%1 | |
| Fully Vaccinated (millions) | 206.6 | --- | ≥2321 | |
| New Cases per Day3🚩 | 491,652 | 248,571 | ≤5,0002 | |
| Hospitalized3🚩 | 85,423 | 64,152 | ≤3,0002 | |
| Deaths per Day3🚩 | 1,165 | 1,106 | ≤502 | |
| 1 Minimum to achieve "herd immunity" (estimated between 70% and 85%). 2my goals to stop daily posts, 37-day average for Cases, Currently Hospitalized, and Deaths 🚩 Increasing 7-day average week-over-week for Cases, Hospitalized, and Deaths ✅ Goal met. | ||||
 Click on graph for larger image.
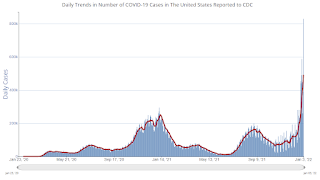
This graph shows the daily (columns) and 7-day average (line) of positive tests reported.
New cases are at record levels. It appears likely hospitalizations will exceed the previous 7-day average record of 124,031 a year ago.
Fortunately, deaths are still well below the previous 7-day average record of 3,421 in January 2021.
Will the unprecedented surge in investor purchases of SF homes continue?
by Calculated Risk on 1/04/2022 05:24:00 PM
Today, in the CalculatedRisk Real Estate Newsletter: Will the unprecedented surge in investor purchases of SF homes continue?
Excerpt:
Just some initial thoughts …
Earlier I wrote about housing credit and delinquencies (neither are presently a concern). These are important topics but being overly focused on either is like fighting the last war (the housing bubble).
A new possible risk is all of the investor buying of single-family homes (including build-to-rent).
...
Now demographics are favorable for homebuying, and the concurrent pickup in demand for rental units is a bit of a mystery (see The Household Mystery). It appears we are seeing significant household formation with little population growth. And that would suggest the increase in household formation is not sustainable.
Meanwhile large investors are able to obtain financing at very low rates. ... That is a 105% LTV (loan-to-value) based on BPOs (Broker Price Opinions - not appraisals). With this kind of financing, investors are incentivized to buy at almost any price. The buyers of the security are counting on the cash flow from renting those 3,836 homes. But what if demand for rentals soften?
emphasis added
Question #1 for 2022: How much will the economy grow in 2022?
by Calculated Risk on 1/04/2022 12:58:00 PM
Earlier I posted some questions on my blog: Ten Economic Questions for 2022. Some of these questions concern real estate (inventory, house prices, housing credit, housing starts, new home sales), and I posted those in the newsletter (others like GDP and employment will be on my blog).
I'm adding some thoughts, and maybe some predictions for each question.
1) Economic growth: Economic growth was probably around 5.5% in 2021 as the economy rebounded from 2020. There will be a drag from fiscal policy in 2022, and monetary policy will be less accommodative. The FOMC is expecting growth of 3.6% to 4.5% Q4-over-Q4 in 2022. How much will the economy grow in 2022?
Here is a table of the annual change in real GDP since 2005. Prior to the pandemic, economic activity was mostly in the 2% range since 2010. Given current demographics, that is about what we'd expect: See: 2% is the new 4%., although demographics are improving somewhat (more prime age workers).
Note: This table includes both annual change and q4 over the previous q4 (two slightly different measures). For 2021, I used a 7.0% annual growth rate in Q4 2021 (this gives -2.2% Q4 over Q4 or -3.4% real annual growth).
| Real GDP Growth | ||
|---|---|---|
| Year | Annual GDP | Q4 / Q4 |
| 2005 | 3.5% | 3.0% |
| 2006 | 2.8% | 2.6% |
| 2007 | 2.0% | 2.2% |
| 2008 | 0.1% | -2.5% |
| 2009 | -2.6% | 0.1% |
| 2010 | 2.7% | 2.8% |
| 2011 | 1.5% | 1.5% |
| 2012 | 2.3% | 1.6% |
| 2013 | 1.8% | 2.5% |
| 2014 | 2.3% | 2.6% |
| 2015 | 2.7% | 1.9% |
| 2016 | 1.7% | 2.0% |
| 2017 | 2.3% | 2.7% |
| 2018 | 2.9% | 2.3% |
| 2019 | 2.3% | 2.6% |
| 2020 | -3.4% | -2.3% |
| 20211 | 5.7% | 5.6% |
| 1 2021 estimate based on 7.0% Q4 SAAR annualized real growth rate | ||
The FOMC is projecting real GDP growth of 3.6% to 4.5% in 2022 (Q4 over Q4). Goldman Sachs is forecasting 3.5% growth in 2022.
My sense is growth will slow in 2022 noticeably. Some sectors, like vehicle sales, will pick up since vehicle sales were supply constrained in 2021. Other sectors will continue to recover (like travel related) and service sectors. However, some goods sectors will likely decline, and real estate will likely be mostly flat in 2022. Also, fiscal and monetary supply will give less of a boost in 2022.
My guess is the real GDP growth will probably be in the 2.5% to 3.5% range in 2022, with some upside potential (and downside risk if the pandemic persists).
Some thoughts:
Some thoughts:
• Question #1 for 2022: How much will the economy grow in 2022?
• Question #2 for 2022: Will the remaining jobs lost in 2020 return in 2022, or will job growth be sluggish?
• Question #3 for 2022: What will the unemployment rate be in December 2022?
• Question #4 for 2022: Will the overall participation rate increase to pre-pandemic levels (63.4% in February 2020)?
• Question #5 for 2022: Will the core inflation rate increase or decrease by December 2022?
• Question #6 for 2022: Will the Fed raise rates in 2022? If so, how many times?
• Question #7 for 2022: How about housing starts and new home sales in 2022?
• Question #8 for 2022: Housing Credit: Will we see easier mortgage lending in 2022?
• Question #9 for 2022: What will happen with house prices in 2022?
• Question #10 for 2022: Will inventory increase as the pandemic subsides, or will inventory decrease further in 2022?
ISM® Manufacturing index Decreased to 58.7% in December
by Calculated Risk on 1/04/2022 11:13:00 AM
(Posted with permission). The ISM manufacturing index indicated expansion in December. The PMI® was at 58.7% in December, down from 61.1% in November. The employment index was at 54.2%, up from 53.3% last month, and the new orders index was at 60.4%, down from 61.5%.
From ISM: Manufacturing PMI® at 58.7%
December 2021 Manufacturing ISM® Report On Business®
Economic activity in the manufacturing sector grew in December, with the overall economy achieving a 19th consecutive month of growth, say the nation’s supply executives in the latest Manufacturing ISM® Report On Business®.This suggests manufacturing expanded at a slightly slower pace in December than in November.
The report was issued today by Timothy R. Fiore, CPSM, C.P.M., Chair of the Institute for Supply Management® (ISM®) Manufacturing Business Survey Committee:
“The December Manufacturing PMI® registered 58.7 percent, a decrease of 2.4 percentage points from the November reading of 61.1 percent. This figure indicates expansion in the overall economy for the 19th month in a row after a contraction in April 2020. The New Orders Index registered 60.4 percent, down 1.1 percentage points compared to the November reading of 61.5 percent. The Production Index registered 59.2 percent, a decrease of 2.3 percentage points compared to the November reading of 61.5 percent. The Prices Index registered 68.2 percent, down 14.2 percentage points compared to the November figure of 82.4 percent. The Backlog of Orders Index registered 62.8 percent, 0.9 percentage point higher than the November reading of 61.9 percent. The Employment Index registered 54.2 percent, 0.9 percentage point higher compared to the November reading of 53.3 percent. The Supplier Deliveries Index registered 64.9 percent, down 7.3 percentage points from the November figure of 72.2 percent. The Inventories Index registered 54.7 percent, 2.1 percentage points lower than the November reading of 56.8 percent. The New Export Orders Index registered 53.6 percent, a decrease of 0.4 percentage point compared to the November reading of 54 percent. The Imports Index registered 53.8 percent, a 1.2-percentage point increase from the November reading of 52.6 percent.”
emphasis added
BLS: Job Openings Decreased to 10.6 million in November
by Calculated Risk on 1/04/2022 10:06:00 AM
From the BLS: Job Openings and Labor Turnover Summary
The number of job openings decreased to 10.6 million on the last business day of November, the U.S. Bureau of Labor Statistics reported today. Hires were little changed at 6.7 million and total separations increased to 6.3 million. Within separations, the quits rate increased to 3.0 percent, matching a series high last seen in September. The layoffs and discharges rate was unchanged at 0.9 percent.The following graph shows job openings (yellow line), hires (dark blue), Layoff, Discharges and other (red column), and Quits (light blue column) from the JOLTS.
emphasis added
This series started in December 2000.
Note: The difference between JOLTS hires and separations is similar to the CES (payroll survey) net jobs headline numbers. This report is for November, the employment report on Friday will be for December.
 Click on graph for larger image.
Note that hires (dark blue) and total separations (red and light blue columns stacked) are usually pretty close each month. This is a measure of labor market turnover. When the blue line is above the two stacked columns, the economy is adding net jobs - when it is below the columns, the economy is losing jobs.
The huge spike in layoffs and discharges in March 2020 are labeled, but off the chart to better show the usual data.
Jobs openings decreased in November to 10.6 million from 11.1 million in October.
The number of job openings (yellow) were up 56% year-over-year.
Quits were up 37% year-over-year. These are voluntary separations. (See light blue columns at bottom of graph for trend for "quits").


