 RSS Feed
 by Calculated Risk on 1/07/2022 12:44:00 PM
Friday, January 07, 2022
Rents Still Increasing Sharply Year-over-year
Today, in the Calculated Risk Real Estate Newsletter: Rents Still Increasing Sharply Year-over-year
A brief excerpt:
Here is a graph of the year-over-year (YoY) change for these measures since January 2015. All of these measures are through November 2021 (Apartment List through December).There is much more in the article. You can subscribe at https://calculatedrisk.substack.com/
...
The Zillow measure is up 12.6% YoY in November, up from 12.0% YoY in October. And the ApartmentList measure is up 17.8% as of December, up from 17.7% in November. Both the Zillow measure (a repeat rent index), and ApartmentList are showing a sharp increase in rents.
Clearly rents are increasing sharply, and we should expect this to continue to spill over into measures of inflation in 2022. The Owners’ Equivalent Rent (OER) was up 3.5% YoY in November, from 3.1% in November - and will increase further in the coming months.
Comments on December Employment Report
by Calculated Risk on 1/07/2022 11:00:00 AM
The headline jobs number in the December employment report was below expectations, however, employment for the previous two months was revised up by 141,000. The participation rate was unchanged, the employment-population ratio increased, and the unemployment rate decreased to 3.9%.
Leisure and hospitality gained 53 thousand jobs in December. In March and April of 2020, leisure and hospitality lost 8.22 million jobs, and are now down 1.22 million jobs since February 2020. So, leisure and hospitality has now added back about 85% all of the jobs lost in March and April 2020.
Construction employment increased 22 thousand and is now 88 thousand below the pre-pandemic level.
Manufacturing added 26 thousand jobs and is still 219 thousand below the pre-pandemic level.
State and Local education lost 10 thousand jobs, seasonally adjusted. This accounted for most of the 12 thousand public sector jobs lost in December.
Earlier: December Employment Report: 199 thousand Jobs, 3.9% Unemployment Rate
In December, the year-over-year employment change was 6.45 million jobs, making 2021 the best year ever for job growth.
Permanent Job Losers
 Click on graph for larger image.
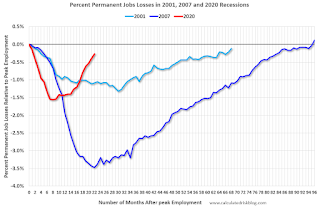
This graph shows permanent job losers as a percent of the pre-recession peak in employment through the report today. (ht Joe Weisenthal at Bloomberg).
Earlier: December Employment Report: 199 thousand Jobs, 3.9% Unemployment Rate
In December, the year-over-year employment change was 6.45 million jobs, making 2021 the best year ever for job growth.
Permanent Job Losers
Click on graph for larger image.This graph shows permanent job losers as a percent of the pre-recession peak in employment through the report today. (ht Joe Weisenthal at Bloomberg).
This data is only available back to 1994, so there is only data for three recessions.
In December, the number of permanent job losers decreased to 1.703 million from 1.905 million in November.
In December, the number of permanent job losers decreased to 1.703 million from 1.905 million in November.
These jobs will likely be the hardest to recover, so it is a positive that the number of permanent job losers is declining fairly rapidly.
Prime (25 to 54 Years Old) Participation
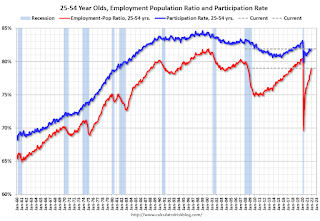 Since the overall participation rate has declined due to cyclical (recession) and demographic (aging population, younger people staying in school) reasons, here is the employment-population ratio for the key working age group: 25 to 54 years old.
The prime working age will be key as the economy recovers.
The 25 to 54 participation rate was unchanged in December at 81.9% from 81.9% in November, and the 25 to 54 employment population ratio increased to 79.0% from 78.8% the previous month.
Both are still low, compared to the pre-pandemic levels, and indicate that some prime workers have still not returned to the labor force.
Seasonal Retail Hiring
Typically, retail companies start hiring for the holiday season in October, and really increase hiring in November. Here is a graph that shows the historical net retail jobs added for October, November and December by year.
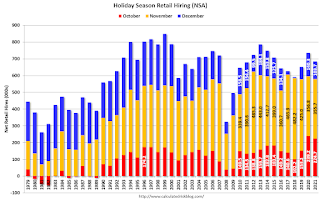 This graph really shows the collapse in retail hiring in 2008. Since then, seasonal hiring had increased back close to more normal levels. Note: I expect the long-term trend will be down with more and more internet holiday shopping.
Retailers hired 104 thousand workers Not Seasonally Adjusted (NSA) net in December.
Seasonal Retail Hiring
Typically, retail companies start hiring for the holiday season in October, and really increase hiring in November. Here is a graph that shows the historical net retail jobs added for October, November and December by year.
This graph really shows the collapse in retail hiring in 2008. Since then, seasonal hiring had increased back close to more normal levels. Note: I expect the long-term trend will be down with more and more internet holiday shopping.Retailers hired 104 thousand workers Not Seasonally Adjusted (NSA) net in December.
This was close normal, and seasonally adjusted (SA) to a loss of 2 thousand jobs in December.
Part Time for Economic Reasons
 From the BLS report:
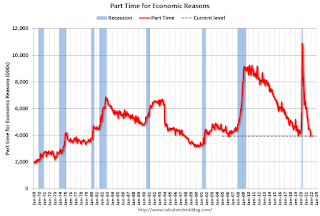
"The number of persons employed part time for economic reasons, at 3.9 million in December, decreased by 337,000 over the month. The over-the-year decline of 2.2 million brings this measure to 461,000 below its February 2020 level. These individuals, who would have preferred full-time employment, were working part time because their hours had been reduced or they were unable to find full-time jobs."The number of persons working part time for economic reasons decreased in December to 3.929 million from 4.466 million in November. This is at pre-recession levels.
These workers are included in the alternate measure of labor underutilization (U-6) that decreased to 7.3% from 7.7% in the previous month. This is down from the record high in April 22.9% for this measure since 1994. This measure was at 7.0% in February 2020 (pre-pandemic).
Unemployed over 26 Weeks
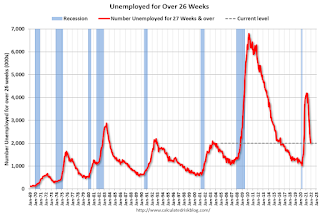 This graph shows the number of workers unemployed for 27 weeks or more.
 According to the BLS, there are 2.008 million workers who have been unemployed for more than 26 weeks and still want a job, down from 2.193 million the previous month.
This does not include all the people that left the labor force.
Summary:
The headline monthly jobs number was below expectations; however, the previous two months were revised up by 141,000 combined. This was the most jobs added in a single calendar year ever (6.45 million), but not as a percent of the labor force (that happened after WWII).
And the headline unemployment rate decreased to 3.9%. The household survey indicated a large gain in employment of 651 thousand, and that led to a sharp decrease in the unemployment rate and an increase in the employment-population ratio.
The prime age participation rate and employment-population ratio, are still below pre-pandemic levels, indicating some prime workers are still out of the labor force. And there are still 3.6 million fewer jobs than prior to the recession.
December Employment Report: 199 thousand Jobs, 3.9% Unemployment Rate
by Calculated Risk on 1/07/2022 08:47:00 AM
From the BLS:
Total nonfarm payroll employment rose by 199,000 in December, and the unemployment rate declined to 3.9 percent, the U.S. Bureau of Labor Statistics reported today. Employment continued to trend up in leisure and hospitality, in professional and business services, in manufacturing, in construction, and in transportation and warehousing.
...
The change in total nonfarm payroll employment for October was revised up by 102,000, from +546,000 to +648,000, and the change for November was revised up by 39,000, from +210,000 to +249,000. With these revisions, employment in October and November combined is 141,000 higher than previously reported.
emphasis added
 Click on graph for larger image.
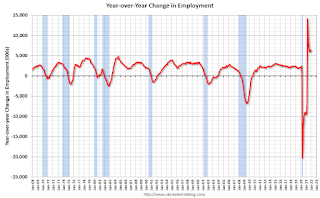
The first graph shows the year-over-year change in total non-farm employment since 1968.
In December, the year-over-year change was 6.45 million jobs. This was up significantly year-over-year.
Total payrolls increased by 199 thousand in December. Private payrolls increased by 211 thousand, and public payrolls declined 12 thousand.
Payrolls for October and November were revised up 141 thousand, combined.
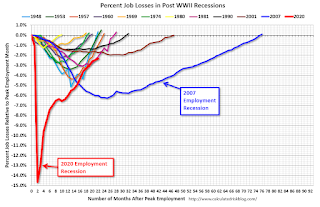 The second graph shows the job losses from the start of the employment recession, in percentage terms.
The current employment recession was by far the worst recession since WWII in percentage terms. However, the current employment recession, 22 months after the onset, is now significantly better than the worst of the "Great Recession".
The third graph shows the employment population ratio and the participation rate.
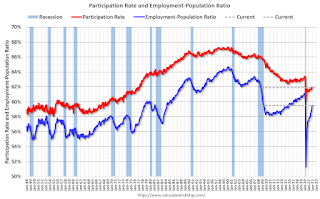 The Labor Force Participation Rate was unchanged at 61.9% in December, from 61.9% in November. This is the percentage of the working age population in the labor force.
 The Employment-Population ratio increased to 59.5% from 59.3% (blue line).
I'll post the 25 to 54 age group employment-population ratio graph later.
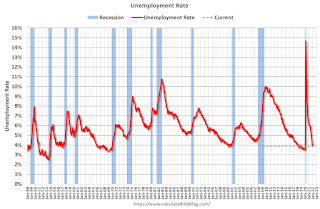 The fourth graph shows the unemployment rate.
 The unemployment rate decreased in December to 3.9% from 4.2% in November.
This was well below consensus expectations; however, October and November were revised up by 141,000 combined.
I'll have more later ...
Thursday, January 06, 2022
Friday: Employment Report
by Calculated Risk on 1/06/2022 07:23:00 PM
My December Employment Preview
Goldman December Payrolls Preview
Friday:
• At 8:30 AM ET, Employment Report for December. There were 120 thousand jobs added in November, and the unemployment rate was at 4.2%. The consensus is for 400 thousand jobs added in December, and for the unemployment rate to decline to 4.1%.
And on COVID (focus on hospitalizations and deaths):
| COVID Metrics | ||||
|---|---|---|---|---|
| Today | Week Ago | Goal | ||
| Percent fully Vaccinated | 62.4% | --- | ≥70.0%1 | |
| Fully Vaccinated (millions) | 207.0 | --- | ≥2321 | |
| New Cases per Day3🚩 | 586,391 | 315,851 | ≤5,0002 | |
| Hospitalized3🚩 | 95,250 | 67,842 | ≤3,0002 | |
| Deaths per Day3🚩 | 1,245 | 1,088 | ≤502 | |
| 1 Minimum to achieve "herd immunity" (estimated between 70% and 85%). 2my goals to stop daily posts, 37-day average for Cases, Currently Hospitalized, and Deaths 🚩 Increasing 7-day average week-over-week for Cases, Hospitalized, and Deaths ✅ Goal met. | ||||
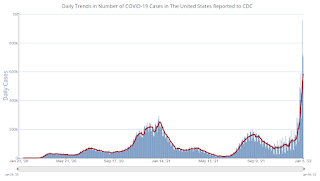 Click on graph for larger image.
This graph shows the daily (columns) and 7-day average (line) of positive tests reported.
New cases are at record levels. It appears likely hospitalizations will exceed the previous 7-day average record of 124,031 a year ago.
Fortunately, deaths are still well below the previous 7-day average record of 3,421 in January 2021.
Goldman December Payrolls Preview
by Calculated Risk on 1/06/2022 03:59:00 PM
A few brief excerpts from a note by Goldman Sachs economist Spencer Hill:
We estimate nonfarm payrolls rose 500k, above consensus of +444k. ... We estimate a one-tenth drop in the unemployment rate to 4.1%.CR Note: The consensus is for 400 thousand jobs added, and for the unemployment rate to decrease to 4.1%.
emphasis added
1st Look at Local Housing Markets in December
by Calculated Risk on 1/06/2022 01:13:00 PM
Today, in the Calculated Risk Real Estate Newsletter: 1st Look at Local Housing Markets in December
A brief excerpt:
And a table of December sales. Sales were down 11.1% YoY, Not Seasonally Adjusted (NSA).There is much more in the article. You can subscribe at https://calculatedrisk.substack.com/
Note that there was one fewer selling day in December ‘21 compared to December ‘20, so the Seasonally Adjusted (SA) number will show less of a YoY decline than the NSA numbers.

December Employment Preview
by Calculated Risk on 1/06/2022 10:53:00 AM
On Friday at 8:30 AM ET, the BLS will release the employment report for December. The consensus is for 400 thousand jobs added, and for the unemployment rate to decrease to 4.1%.
 Click on graph for larger image.
• First, currently there are still about 3.9 million fewer jobs than in February 2020 (before the pandemic).
This graph shows the job losses from the start of the employment recession, in percentage terms.
The current employment recession was by far the worst recession since WWII in percentage terms. However, the current employment recession, 20 months after the onset, is now significantly better than the worst of the "Great Recession".
• ADP Report: The ADP employment report showed a gain of 807,000 private sector jobs, well above the consensus estimate of 413,000 jobs added. The ADP report hasn't been very useful in predicting the BLS report, but this suggests the BLS report could be above expectations.
• ISM Surveys: Note that the ISM services are diffusion indexes based on the number of firms hiring (not the number of hires). The ISM® manufacturing employment index increased in December to 54.2%, up from 53.3% last month. This would suggest little change in manufacturing employment in December. ADP showed 74,000 manufacturing jobs added.
The ISM® Services employment index decreased in December to 54.9%, down from 56.5% last month. This would suggest a 200 thousand increase in service employment in December. Combined, the ISM indexes suggest employment below the consensus estimate.
• Unemployment Claims: The weekly claims report showed a decline in the number of initial unemployment claims during the reference week (includes the 12th of the month) from 270,000 in November to 206,000 in December. This would usually suggest fewer layoffs in December than in November, although this might not be very useful right now. In general, weekly claims have been falling, and have been below expectations in December.
 • Permanent Job Losers: Something to watch in the employment report will be "Permanent job losers". This graph shows permanent job losers as a percent of the pre-recession peak in employment through the November report.
This data is only available back to 1994, so there is only data for three recessions. In November, the number of permanent job losers decreased to 1.921 million from 2.126 million in October.
These jobs will likely be the hardest to recover, so it is a positive that the number of permanent job losers is declining fairly rapidly.
 • Seasonal Retail Hiring: Typically, retail companies start hiring for the holiday season in October, and really increase hiring in November. But only a few temporary workers are hired in December. Here is a graph that shows the historical net retail jobs added for October, November and December by year.
Retailers hired 332 thousand workers Not Seasonally Adjusted (NSA) net in November. This was somewhat lower than normal, and seasonally adjusted (SA) to a loss of 20 thousand jobs in November.
In 2020, retailers hired 140,300 employees (NSA) in December. That translated to a gain of 30,100 jobs SA. It is possible that retailers hired for some jobs early (in October), and retail (SA) will be slightly negative in the December report (always difficult to predict).
• Conclusion: There is significant optimism concerning the December employment report, and many analysts are expecting a strong report. Overall, the ADP report was strong and unemployment claims have been falling quickly.
As far as the pandemic, the number of daily cases during the reference week in December was around 120,000, up from around 80,000 in November. New cases per day started increasing rapidly after the reference week in December, so the current COVID wave probably had little impact on December hiring.
My sense is the report will be above consensus expectations.
ISM® Services Index Decreased to 62.0% in December
by Calculated Risk on 1/06/2022 10:03:00 AM
(Posted with permission). The December ISM® Services index was at 62.0%, down from 69.1% last month. The employment index decreased to 54.9%, from 56.5%. Note: Above 50 indicates expansion, below 50 in contraction.
From the Institute for Supply Management: Services PMI® at 62% December 2021 Services ISM® Report On Business®
Economic activity in the services sector grew in December for the 19th month in a row — with the Services PMI® exceeding 60 percent for the 10th consecutive month — say the nation’s purchasing and supply executives in the latest Services ISM® Report On Business®.This was below the consensus forecast, and the employment index decreased to 54.9%, from 56.5% the previous month.
The report was issued today by Anthony Nieves, CPSM, C.P.M., A.P.P., CFPM, Chair of the Institute for Supply Management® (ISM®) Services Business Survey Committee: “In December, the Services PMI® registered 62 percent, 7.1 percentage points below November’s all-time high reading of 69.1 percent. The Business Activity Index registered 67.6 percent, a decrease of 7 percentage points compared to the reading of 74.6 percent in November, and the New Orders Index registered 61.5 percent, 8.2 percentage points lower than the all-time high reading of 69.7 percent reported in November.
emphasis added
Trade Deficit Increased to $80.2 Billion in November
by Calculated Risk on 1/06/2022 08:44:00 AM
From the Department of Commerce reported:
The U.S. Census Bureau and the U.S. Bureau of Economic Analysis announced today that the goods and services deficit was $80.2 billion in November, up $13.0 billion from $67.2 billion in October, revised.
November exports were $224.2 billion, $0.4 billion more than October exports. November imports were $304.4 billion, $13.4 billion more than October imports.
emphasis added
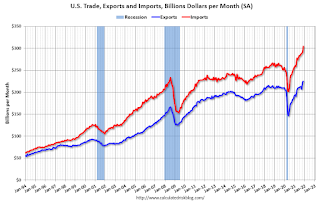 Click on graph for larger image.
Both exports and imports increased in November.
Exports are up 21% compared to November 2020; imports are up 21% compared to November 2020.
Both imports and exports decreased sharply due to COVID-19, and have now bounced back (imports more than exports),
The second graph shows the U.S. trade deficit, with and without petroleum.
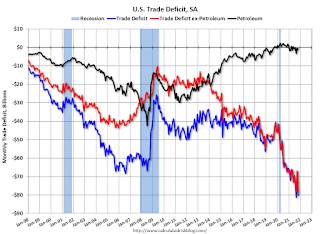 The blue line is the total deficit, and the black line is the petroleum deficit, and the red line is the trade deficit ex-petroleum products.
Note that net, imports and exports of petroleum products are close to zero.
The trade deficit with China increased to $32.3 billion in November, from $30.6 billion in November 2020.
Weekly Initial Unemployment Claims Increase to 207,000
by Calculated Risk on 1/06/2022 08:34:00 AM
The DOL reported:
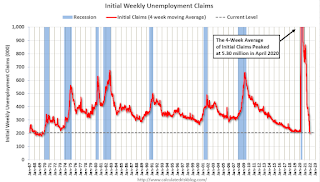
In the week ending January 1, the advance figure for seasonally adjusted initial claims was 207,000, an increase of 7,000 from the previous week's revised level. The previous week's level was revised up by 2,000 from 198,000 to 200,000. The 4-week moving average was 204,500, an increase of 4,750 from the previous week's revised average. The previous week's average was revised up by 500 from 199,250 to 199,750.The following graph shows the 4-week moving average of weekly claims since 1971.
emphasis added
 Click on graph for larger image.
The dashed line on the graph is the current 4-week average. The four-week average of weekly unemployment claims increased to 204,500.
The previous week was revised up.
Weekly claims were close to the consensus forecast.


