 RSS Feed
 by Calculated Risk on 1/09/2022 07:02:00 PM
Sunday, January 09, 2022
Sunday Night Futures
Weekend:
• Schedule for Week of January 9, 2022
Monday:
• No major economic releases scheduled.
From CNBC: Pre-Market Data and Bloomberg futures S&P 500 futures are down 11 and DOW futures are down 91 (fair value).
Oil prices were up over the last week with WTI futures at $78.90 per barrel and Brent at $81.75 per barrel. A year ago, WTI was at $52, and Brent was at $56 - so WTI oil prices are up 50% year-over-year.
Here is a graph from Gasbuddy.com for nationwide gasoline prices. Nationally prices are at $3.29 per gallon. A year ago prices were at $2.31 per gallon, so gasoline prices are up $0.98 per gallon year-over-year.
Lawler: More on Investor Purchases of Single-Family Homes
by Calculated Risk on 1/09/2022 09:55:00 AM
Today, in the Calculated Risk Real Estate Newsletter: Lawler: More on Investor Purchases of Single-Family Homes
A brief excerpt:
From housing economist Tom Lawler:There is much more in the article. You can subscribe at https://calculatedrisk.substack.com/
Recent reports showing a surge in investor purchases of single-family homes beginning last spring has stunned quite a few housing analysts and led several to reassess the “drivers” of the surprising strength in housing and home prices this year.
One of the reports I’m referring to is from Redfin, and the other is from CoreLogic. While both are based on an analysis of property records, there are key differences.
Before going into some of the potential ramifications of this investor surge, however, I thought it might be useful to discuss these reports – especially in light of a recent “research” report from the trade association “dedicated to advocating on behalf of the single-family rental industry” that completed botched its analysis of these recent reports.
Saturday, January 08, 2022
Real Estate Newsletter Articles this Week
by Calculated Risk on 1/08/2022 02:11:00 PM
At the Calculated Risk Real Estate Newsletter this week:
• Rents Still Increasing Sharply Year-over-year
• 1st Look at Local Housing Markets in December
• Apartment Vacancy Rate Declined in Q4
• Will the unprecedented surge in investor purchases of Single Family homes continue?
This is usually published several times a week, and provides more in-depth analysis of the housing market.
The blog will continue as always!
You can subscribe at https://calculatedrisk.substack.com/ Most content is available for free, but please subscribe!.
You can subscribe at https://calculatedrisk.substack.com/ Most content is available for free, but please subscribe!.
Schedule for Week of January 9, 2022
by Calculated Risk on 1/08/2022 08:11:00 AM
The key reports this week are December CPI and retail sales.
For manufacturing, the December Industrial Production report will be released.
No major economic releases scheduled.
6:00 AM: NFIB Small Business Optimism Index for December.
10:00 AM: Testimony, Fed Chair Jerome Powell, Nomination Hearing, Before the Committee on Banking, Housing, and Urban Affairs, U.S. Senate
7:00 AM ET: The Mortgage Bankers Association (MBA) will release the results for the mortgage purchase applications index.
8:30 AM: The Consumer Price Index for December from the BLS. The consensus is for 0.5% increase in CPI, and a 0.5% increase in core CPI.
8:30 AM: The initial weekly unemployment claims report will be released. The consensus is for 210 thousand initial claims.
8:30 AM ET: The Producer Price Index for December from the BLS. The consensus is for a 0.4% increase in PPI, and a 0.5% increase in core PPI.
10:00 AM, Testimony, Fed Governor Lael Brainard, Nomination Hearing, Before the Committee on Banking, Housing, and Urban Affairs, U.S. Senate
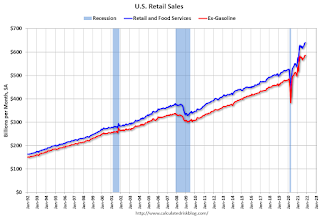 8:30 AM: Retail sales for December is scheduled to be released. The consensus is for a 0.1% decrease in retail sales.
This graph shows retail sales since 1992. This is monthly retail sales and food service, seasonally adjusted (total and ex-gasoline).
 9:15 AM: The Fed will release Industrial Production and Capacity Utilization for December.
This graph shows industrial production since 1967.
The consensus is for a 0.3% increase in Industrial Production, and for Capacity Utilization to increase to 77.0%.
10:00 AM: University of Michigan's Consumer sentiment index (Preliminary for January).
Friday, January 07, 2022
COVID Update Jan 7, 2022
by Calculated Risk on 1/07/2022 09:40:00 PM
On COVID (focus on hospitalizations and deaths):
| COVID Metrics | ||||
|---|---|---|---|---|
| Today | Week Ago | Goal | ||
| Percent fully Vaccinated | 62.4% | --- | ≥70.0%1 | |
| Fully Vaccinated (millions) | 207.2 | --- | ≥2321 | |
| New Cases per Day3🚩 | 614,552 | 360,566 | ≤5,0002 | |
| Hospitalized3🚩 | 99,690 | 70,676 | ≤3,0002 | |
| Deaths per Day3🚩 | 1,350 | 1,136 | ≤502 | |
| 1 Minimum to achieve "herd immunity" (estimated between 70% and 85%). 2my goals to stop daily posts, 37-day average for Cases, Currently Hospitalized, and Deaths 🚩 Increasing 7-day average week-over-week for Cases, Hospitalized, and Deaths ✅ Goal met. | ||||
 Click on graph for larger image.
This graph shows the daily (columns) and 7-day average (line) of positive tests reported.
New cases are at record levels. It appears likely hospitalizations will exceed the previous 7-day average record of 124,031 a year ago.
Fortunately, deaths are still well below the previous 7-day average record of 3,421 in January 2021.
AAR: December Rail Carloads Down Compared to 2019; Intermodal Up
by Calculated Risk on 1/07/2022 05:01:00 PM
From the Association of American Railroads (AAR) Rail Time Indicators. Graphs and excerpts reprinted with permission.
U.S. rail carloads totaled 12.01 million in 2021, up 6.6% over 2020 but down 7.4% from 2019. ...
For intermodal, 2021 was the tale of two halves. The first six months of 2021 saw record-breaking highs, but volume cooled in the second half as global supply chain challenges persisted. For all of 2021, U.S. railroads originated 14.14 million containers and trailers — up 5.1% over 2020, up 3.4% over 2019, and the second most ever for a full year. Only 2018’s 14.47 million was higher.
emphasis added
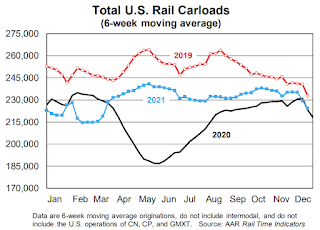 Click on graph for larger image.
This graph from the Rail Time Indicators report shows the six week average of U.S. Carloads in 2019, 2020 and 2021:
U.S. railroads originated 1.14 million total carloads in December 2021, up 3.1% over December 2020 and down 0.7% from December 2019. December was the tenth straight overall year-over-year gain and the fifth straight in the 2%-4% range.
 The second graph shows the six week average (not monthly) of U.S. intermodal in 2019, 2020 and 2021: (using intermodal or shipping containers):
Meanwhile, U.S. railroads originated 1.22 million intermodal containers and trailers in December 2021, down 8.2% from December 2020 and the fifth straight year-over-year decline. Volume averaged 244,956 units per week in December 2021, the fewest since May 2020. (December is typically one of the lowest-volume intermodal months of the year.)
Q4 GDP Forecasts: Moving Down
by Calculated Risk on 1/07/2022 03:23:00 PM
From BofA:
Our forecast for retail sales to contract in December led us to lower our 4Q GDP tracking estimate down to 5.5% qoq saar from 6.0% previously. [January 7 estimate]From Goldman Sachs:
emphasis added
We left our Q4 GDP tracking estimate unchanged at +7.0% (qoq ar). [January 6 estimate]And from the Altanta Fed: GDPNow
The GDPNow model estimate for real GDP growth (seasonally adjusted annual rate) in the fourth quarter of 2021 is 6.7 percent on January 6, down from 7.4 percent on January 4. [January 6 estimate]
Hotels: Occupancy Rate Down "Slightly" Compared to Same Week in 2019
by Calculated Risk on 1/07/2022 02:28:00 PM
From CoStar: US Hotels Set Performance Records Over Holidays
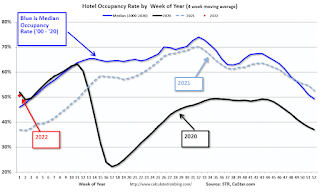
U.S. hotel demand for the week between the Christmas and New Year’s Eve holidays was the highest ever recorded, and hoteliers capitalized, charging record-high weekly rates.The following graph shows the seasonal pattern for the hotel occupancy rate using the four week average.
Christmas Day hotel occupancy also set a record in the U.S. at 47.3%; the previous peak was 47%, reached in 2015. New Year’s Eve hotel performance was likely limited by the rise in COVID-19 cases linked to the omicron variant, which resulted in limitations or outright cancellations of many large-scale celebrations. Occupancy on that day rose to 62%, which was higher than in 2019 (59.4%), but well below the peak set in 2016 (68.7%).
Occupancy for the seven-day period between Christmas Day and New Year’s Eve was 53.7%, which also was not a record and slightly below the level achieved in 2019.
emphasis added
 Click on graph for larger image.
The red dot is for 2022, black is 2020, blue is the median, and dashed light blue is for 2021.
Although down compared to 2019, the 4-week average of the occupancy rate is now above the median rate for the previous 20 years (Blue).
Note: Y-axis doesn't start at zero to better show the seasonal change.
The 4-week average of the occupancy rate will increase seasonally over the next few months.
Rents Still Increasing Sharply Year-over-year
by Calculated Risk on 1/07/2022 12:44:00 PM
Today, in the Calculated Risk Real Estate Newsletter: Rents Still Increasing Sharply Year-over-year
A brief excerpt:
Here is a graph of the year-over-year (YoY) change for these measures since January 2015. All of these measures are through November 2021 (Apartment List through December).There is much more in the article. You can subscribe at https://calculatedrisk.substack.com/
...
The Zillow measure is up 12.6% YoY in November, up from 12.0% YoY in October. And the ApartmentList measure is up 17.8% as of December, up from 17.7% in November. Both the Zillow measure (a repeat rent index), and ApartmentList are showing a sharp increase in rents.
Clearly rents are increasing sharply, and we should expect this to continue to spill over into measures of inflation in 2022. The Owners’ Equivalent Rent (OER) was up 3.5% YoY in November, from 3.1% in November - and will increase further in the coming months.
Comments on December Employment Report
by Calculated Risk on 1/07/2022 11:00:00 AM
The headline jobs number in the December employment report was below expectations, however, employment for the previous two months was revised up by 141,000. The participation rate was unchanged, the employment-population ratio increased, and the unemployment rate decreased to 3.9%.
Leisure and hospitality gained 53 thousand jobs in December. In March and April of 2020, leisure and hospitality lost 8.22 million jobs, and are now down 1.22 million jobs since February 2020. So, leisure and hospitality has now added back about 85% all of the jobs lost in March and April 2020.
Construction employment increased 22 thousand and is now 88 thousand below the pre-pandemic level.
Manufacturing added 26 thousand jobs and is still 219 thousand below the pre-pandemic level.
State and Local education lost 10 thousand jobs, seasonally adjusted. This accounted for most of the 12 thousand public sector jobs lost in December.
Earlier: December Employment Report: 199 thousand Jobs, 3.9% Unemployment Rate
In December, the year-over-year employment change was 6.45 million jobs, making 2021 the best year ever for job growth.
Permanent Job Losers
 Click on graph for larger image.
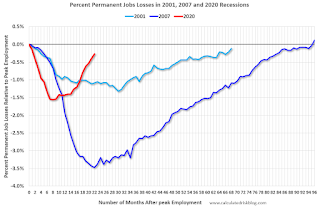
This graph shows permanent job losers as a percent of the pre-recession peak in employment through the report today. (ht Joe Weisenthal at Bloomberg).
Earlier: December Employment Report: 199 thousand Jobs, 3.9% Unemployment Rate
In December, the year-over-year employment change was 6.45 million jobs, making 2021 the best year ever for job growth.
Permanent Job Losers
Click on graph for larger image.This graph shows permanent job losers as a percent of the pre-recession peak in employment through the report today. (ht Joe Weisenthal at Bloomberg).
This data is only available back to 1994, so there is only data for three recessions.
In December, the number of permanent job losers decreased to 1.703 million from 1.905 million in November.
In December, the number of permanent job losers decreased to 1.703 million from 1.905 million in November.
These jobs will likely be the hardest to recover, so it is a positive that the number of permanent job losers is declining fairly rapidly.
Prime (25 to 54 Years Old) Participation
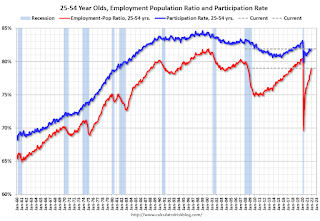 Since the overall participation rate has declined due to cyclical (recession) and demographic (aging population, younger people staying in school) reasons, here is the employment-population ratio for the key working age group: 25 to 54 years old.
The prime working age will be key as the economy recovers.
The 25 to 54 participation rate was unchanged in December at 81.9% from 81.9% in November, and the 25 to 54 employment population ratio increased to 79.0% from 78.8% the previous month.
Both are still low, compared to the pre-pandemic levels, and indicate that some prime workers have still not returned to the labor force.
Seasonal Retail Hiring
Typically, retail companies start hiring for the holiday season in October, and really increase hiring in November. Here is a graph that shows the historical net retail jobs added for October, November and December by year.
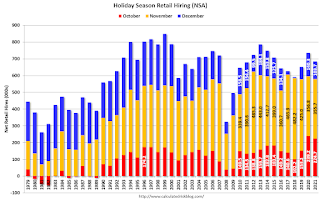 This graph really shows the collapse in retail hiring in 2008. Since then, seasonal hiring had increased back close to more normal levels. Note: I expect the long-term trend will be down with more and more internet holiday shopping.
Retailers hired 104 thousand workers Not Seasonally Adjusted (NSA) net in December.
Seasonal Retail Hiring
Typically, retail companies start hiring for the holiday season in October, and really increase hiring in November. Here is a graph that shows the historical net retail jobs added for October, November and December by year.
This graph really shows the collapse in retail hiring in 2008. Since then, seasonal hiring had increased back close to more normal levels. Note: I expect the long-term trend will be down with more and more internet holiday shopping.Retailers hired 104 thousand workers Not Seasonally Adjusted (NSA) net in December.
This was close normal, and seasonally adjusted (SA) to a loss of 2 thousand jobs in December.
Part Time for Economic Reasons
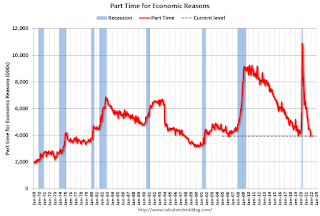 From the BLS report:
"The number of persons employed part time for economic reasons, at 3.9 million in December, decreased by 337,000 over the month. The over-the-year decline of 2.2 million brings this measure to 461,000 below its February 2020 level. These individuals, who would have preferred full-time employment, were working part time because their hours had been reduced or they were unable to find full-time jobs."The number of persons working part time for economic reasons decreased in December to 3.929 million from 4.466 million in November. This is at pre-recession levels.
These workers are included in the alternate measure of labor underutilization (U-6) that decreased to 7.3% from 7.7% in the previous month. This is down from the record high in April 22.9% for this measure since 1994. This measure was at 7.0% in February 2020 (pre-pandemic).
Unemployed over 26 Weeks
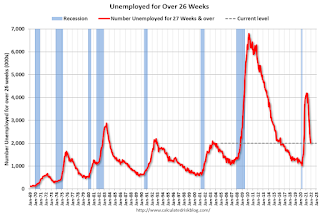 This graph shows the number of workers unemployed for 27 weeks or more.
 According to the BLS, there are 2.008 million workers who have been unemployed for more than 26 weeks and still want a job, down from 2.193 million the previous month.
This does not include all the people that left the labor force.
Summary:
The headline monthly jobs number was below expectations; however, the previous two months were revised up by 141,000 combined. This was the most jobs added in a single calendar year ever (6.45 million), but not as a percent of the labor force (that happened after WWII).
And the headline unemployment rate decreased to 3.9%. The household survey indicated a large gain in employment of 651 thousand, and that led to a sharp decrease in the unemployment rate and an increase in the employment-population ratio.
The prime age participation rate and employment-population ratio, are still below pre-pandemic levels, indicating some prime workers are still out of the labor force. And there are still 3.6 million fewer jobs than prior to the recession.


