 RSS Feed
 by Calculated Risk on 1/11/2022 10:11:00 AM
Tuesday, January 11, 2022
Missing Workers by Age Group
Note: This is an update to an earlier post.
In November, Goldman Sachs economists put out a research note on the labor force participation rate: Why Isn’t Labor Force Participation Recovering?
Here are few excerpts from the note:
 Click on graph for larger image.
This data is comparing December 2021 to December 2019, using Not Seasonally Adjusted (NSA) data (I compared to December 2019 to minimize the seasonal impact when using NSA data).
While the unemployment rate continues to fall quickly, labor force participation has made no progress since August 2020. ... Most of the 5.0mn persons who have exited the labor force since the start of the pandemic are over age 55 (3.4mn), largely reflecting early (1.5mn) and natural (1mn) retirements that likely won’t reverse. The outlook for prime-age persons who have exited the labor force (1.7mn) is more positive, since very few are discouraged and most still view their exits as temporary.
First, there are two important monthly surveys from the BLS. The participation rate (and unemployment rate) comes from the Current Population Survey (CPS: commonly called the household survey), a monthly survey of about 60,000 households.
The jobs number comes from Current Employment Statistics (CES: payroll survey), a sample of approximately 634,000 business establishments nationwide.
These are very different surveys: the CPS gives the total number of employed (and unemployed including the alternative measures), and the CES gives the total number of positions (excluding some categories like the self-employed, and a person working two jobs counts as two positions).
Currently the payroll survey shows there are 3.6 million fewer jobs than in February 2020 (pre-pandemic).
The household survey shows there are 2.9 million fewer people employed than in February 2020.
Note: The 5 million number for the labor force, probably assumes some normal labor force growth; however, overall population growth has been dismal over the last 2 years (little immigration and large number of deaths). I'm not confident in Goldman's 5-million-person estimate.
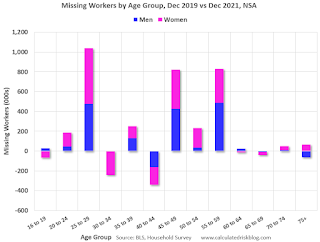
Here is a graph of the number of missing people by age group (from the CPS household survey).
Click on graph for larger image.This data is comparing December 2021 to December 2019, using Not Seasonally Adjusted (NSA) data (I compared to December 2019 to minimize the seasonal impact when using NSA data).
Positive numbers are missing workers.
Almost all of the missing employed workers - by this method - are in the 25 to 29, 45 to 49, and in the 55 to 59 age groups.
Note: this is over a 2-year period, and there have been some demographic shifts between cohorts.
This data would suggest most of the missing workers are prime age or took early retirement (the missing workers in their '50s).
Leading Index for Commercial Real Estate "Declines in December"; Up Sharply Year-over-year
by Calculated Risk on 1/11/2022 08:34:00 AM
From Dodge Data Analytics: Dodge Momentum Index Declines In December
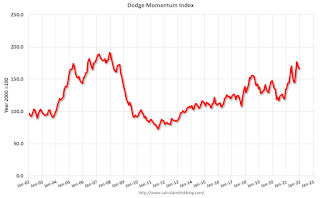
The Dodge Momentum Index fell 3% in December to 166.4 (2000=100), down from the revised November reading of 170.7. The Momentum Index, issued by Dodge Construction Network, is a monthly measure of the initial report for nonresidential building projects in planning, which have been shown to lead construction spending for nonresidential buildings by a full year. In December, commercial planning fell 4%, and institutional planning slipped 1%.
Despite these declines, 2021 was a banner year for the Dodge Momentum Index — despite the lingering risks of COVID-19 and low demand for some types of nonresidential buildings. Throughout the year, the overall Momentum Index increased 23%, the strongest annual gain since 2005. Both the commercial and institutional components of the Momentum Index saw similar gains — with their levels of activity reaching 13- and 14-year highs, respectively.
emphasis added
 Click on graph for larger image.
This graph shows the Dodge Momentum Index since 2002. The index was at 166.4 in December, down from 170.7 in November.
According to Dodge, this index leads "construction spending for nonresidential buildings by a full year". This index suggested a decline in Commercial Real Estate construction through most of 2021, but a solid pickup in 2022.
Monday, January 10, 2022
Tuesday: Fed Chair Powell Nomination Hearing
by Calculated Risk on 1/10/2022 08:55:00 PM
From Matthew Graham at Mortgage News Daily: Mortgage Rates Spiking at Fastest Pace in a Long Time
This morning's additional weakness in the bond market brings the average conventional 30yr fixed scenario closer to 3.625% (as always, rate quotes depend on multiple factors, and the overall range is very wide). [30 year fixed 3.64%]Tuesday:
emphasis added
• At 6:00 AM ET, NFIB Small Business Optimism Index for December.
• At 10:00 AM, Testimony, Fed Chair Jerome Powell, Nomination Hearing, Before the Committee on Banking, Housing, and Urban Affairs, U.S. Senate
On COVID (focus on hospitalizations and deaths):
| COVID Metrics | ||||
|---|---|---|---|---|
| Today | Week Ago | Goal | ||
| Percent fully Vaccinated | 62.5% | --- | ≥70.0%1 | |
| Fully Vaccinated (millions) | 207.7 | --- | ≥2321 | |
| New Cases per Day3🚩 | 674,406 | 443,099 | ≤5,0002 | |
| Hospitalized3🚩 | 109,874 | 81,843 | ≤3,0002 | |
| Deaths per Day3🚩 | 1,552 | 1,181 | ≤502 | |
| 1 Minimum to achieve "herd immunity" (estimated between 70% and 85%). 2my goals to stop daily posts, 37-day average for Cases, Currently Hospitalized, and Deaths 🚩 Increasing 7-day average week-over-week for Cases, Hospitalized, and Deaths ✅ Goal met. | ||||
 Click on graph for larger image.
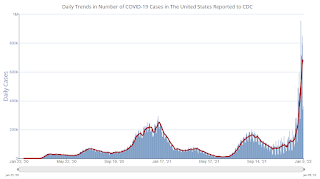
This graph shows the daily (columns) and 7-day average (line) of positive tests reported.
New cases are at record levels. It appears likely hospitalizations will exceed the previous 7-day average record of 124,031 a year ago.
Fortunately, deaths are still well below the previous 7-day average record of 3,421 in January 2021.
Update: Framing Lumber Prices Up 75% Year-over-year
by Calculated Risk on 1/10/2022 04:15:00 PM
Here is another monthly update on framing lumber prices.
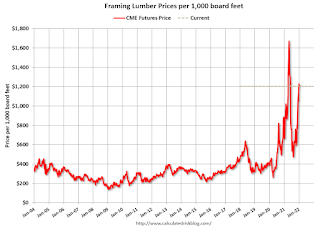
This graph shows CME random length framing futures through January 10th.
Lumber was at $1,160 per 1000 board feet this morning.
This is down from a peak of $1,733, but up $515 from a year ago.
 Click on graph for larger image in graph gallery.
A combination of strong demand and various supply constraints have pushed up the price of lumber again.
Click on graph for larger image in graph gallery.Lumber price are up 75% year-over-year.
A combination of strong demand and various supply constraints have pushed up the price of lumber again.
Q4 2021 Update: Unofficial Problem Bank list Decreased to 57 Institutions
by Calculated Risk on 1/10/2022 02:50:00 PM
The FDIC's official problem bank list is comprised of banks with a CAMELS rating of 4 or 5, and the list is not made public (just the number of banks and assets every quarter). Note: Bank CAMELS ratings are also not made public.
CAMELS is the FDIC rating system, and stands for Capital adequacy, Asset quality, Management, Earnings, Liquidity and Sensitivity to market risk. The scale is from 1 to 5, with 1 being the strongest.
As a substitute for the CAMELS ratings, surferdude808 is using publicly announced formal enforcement actions, and also media reports and company announcements that suggest to us an enforcement action is likely, to compile a list of possible problem banks in the public interest.
DISCLAIMER: This is an unofficial list, the information is from public sources only, and while deemed to be reliable is not guaranteed. No warranty or representation, expressed or implied, is made as to the accuracy of the information contained herein and same is subject to errors and omissions. This is not intended as investment advice. Please contact CR with any errors.
Here are the quarterly changes and a few comments from surferdude808:
Update on the Unofficial Problem Bank List through December 31, 2021. Since the last update at the end of September 2021, the list decreased by two to 57 institutions after two additions and four removals. Assets increased by $1.7 billion to $56.6 billion, with the change primarily resulting from a $1.7 billion increase from updated asset figures through September 30, 2021. A year ago, the list held 65 institutions with assets of $58.2 billion.
Additions during the fourth quarter included BancCentral, National Association, Alva, OK ($542 million) and Herring Bank, Amarillo, TX ($521 million). Removals during the quarter because of action termination included Texas Citizens Bank, National Association, Pasadena, TX ($515 million); Civis Bank, Rogersville, TN ($189 million); and Canyon Community Bank, National Association, Tucson, AZ ($146 million). CornerstoneBank, Atlanta, GA ($224 million) exited through an unassisted merger. On November 30, 2021, the FDIC released third quarter results and provided an update on the Official Problem Bank List. In that release, the FDIC said there were 46 institutions with assets of $51 billion on the official list, down from the 51 institutions but up in assets from $46 billion in the second quarter of 2021.
With the conclusion of the fourth quarter, we bring an updated transition matrix to detail how banks are transitioning off the Unofficial Problem Bank List. Since we first published the Unofficial Problem Bank List on August 7, 2009 with 389 institutions, 1,781 institutions have appeared on a weekly or monthly list since then. Only 3.2 percent of the banks that have appeared on a list remain today as 1,724 institutions have transitioned through the list. Departure methods include 1,017 action terminations, 411 failures, 278 mergers, and 19 voluntary liquidations. Of the 389 institutions on the first published list, only 3 or less than 1.0 percent, still have a troubled designation more than ten years later. The 411 failures represent 23.1 percent of the 1,781 institutions that have made an appearance on the list. This failure rate is well above the 10-12 percent rate frequently cited in media reports on the failure rate of banks on the FDIC's official list.
2nd Look at Local Housing Markets in December
by Calculated Risk on 1/10/2022 12:37:00 PM
Today, in the Calculated Risk Real Estate Newsletter: 2nd Look at Local Housing Markets in December
A brief excerpt:
Commenting on the slowdown in sales, Dick Beeson, managing broker at RE/MAX Northwest Realtors, said, "That's to be expected considering inventory in the fourth quarter was down sharply from last year. You can't sell what isn't there."There is much more in the article. You can subscribe at https://calculatedrisk.substack.com/
...
Here is a summary of active listings for these housing markets in December. Inventory was down 22.7% in December month-over-month (MoM) from November, and down 34.2% year-over-year (YoY).
Inventory almost always declines seasonally in December, so the MoM decline is not a surprise. Last month, these markets were down 30.5% YoY, so the YoY decline in December is larger than in November. This isn’t indicating a slowing market.
Notes for all tables:
1. New additions to table in BOLD.
2. Northwest (Seattle), North Texas (Dallas), Jacksonville, Source: Northeast Florida Association of REALTORS®
Housing Inventory January 10th Update: Inventory Down 0.5% Week-over-week; New Record Low
by Calculated Risk on 1/10/2022 10:09:00 AM
Tracking existing home inventory is very important in 2022.
Inventory usually declines sharply over the holidays, and this is a new record low for this series.
This inventory graph is courtesy of Altos Research.
As of January 7th, inventory was at 292 thousand (7-day average), compared to 397 thousand for the same week a year ago. That is a decline of 26.0%. Inventory was down 0.5% from the previous week.
Compared to the same week in 2019, inventory is down 60.4% from 738 thousand. A week ago, inventory was at 294 thousand, and was down 30.0% YoY.
Seasonally, inventory bottomed in April 2021 - very late - usually inventory bottoms in January or February. The YoY decline this week was smaller than last week, and that might be a sign that inventory will bottom seasonally in January or February this year.
Inventory peaked last year in early September, when inventory was at 437 thousand, so inventory is currently off about 33.2% from the peak for 2021.
Mike Simonsen discusses this data regularly on Youtube.
Six High Frequency Indicators for the Economy
by Calculated Risk on 1/10/2022 08:22:00 AM
These indicators are mostly for travel and entertainment. It is interesting to watch these sectors recover as the pandemic subsides.
Note: Gasoline consumption returned to pre-pandemic levels.
The TSA is providing daily travel numbers.
This data is as of January 8th.
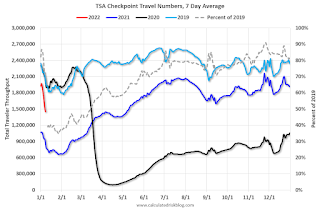 Click on graph for larger image.
This data shows the 7-day average of daily total traveler throughput from the TSA for 2019 (Light Blue), 2020 (Black), 2021 (Blue) and 2021 (Red).
The dashed line is the percent of 2019 for the seven-day average.
The 7-day average is down 27.9% from the same day in 2019 (72.1% of 2019). (Dashed line)
Air travel had been off about 20% relative to 2019 for the last five months (with some ups and downs) - but picked up over the Thanksgiving and Christmas holidays (solid leisure travel) - and has declined in early 2022 (weak business travel).
The second graph shows the 7-day average of the year-over-year change in diners as tabulated by OpenTable for the US and several selected cities.
IMPORTANT: OpenTable notes: "we’ve updated the data including downloadable dataset from January 1, 2021 onward to compare seated diners from 2021 to 2019, as opposed to year over year." Thanks!
 Thanks to OpenTable for providing this restaurant data:
This data is updated through January 8, 2022.
This data is "a sample of restaurants on the OpenTable network across all channels: online reservations, phone reservations, and walk-ins. For year-over-year comparisons by day, we compare to the same day of the week from the same week in the previous year."
Dining was mostly moving sideways, but there has been some decline recently, probably due to the winter wave of COVID. The 7-day average for the US is down 24% compared to 2019.
Thanks to OpenTable for providing this restaurant data:This data is updated through January 8, 2022.
This data is "a sample of restaurants on the OpenTable network across all channels: online reservations, phone reservations, and walk-ins. For year-over-year comparisons by day, we compare to the same day of the week from the same week in the previous year."
Dining was mostly moving sideways, but there has been some decline recently, probably due to the winter wave of COVID. The 7-day average for the US is down 24% compared to 2019.
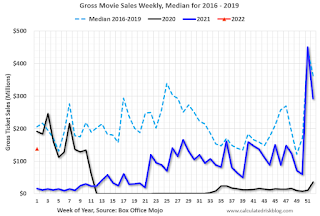 This data shows domestic box office for each week and the median for the years 2016 through 2019 (dashed light blue).
 Black is 2020, Blue is 2021 and Red is 2022.
The data is from BoxOfficeMojo through January 6th.
Note that the data is usually noisy week-to-week and depends on when blockbusters are released.
Movie ticket sales were at $138 million last week, down about 33% from the median for the week.
Note that the data is usually noisy week-to-week and depends on when blockbusters are released.
Movie ticket sales were at $138 million last week, down about 33% from the median for the week.
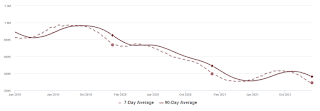
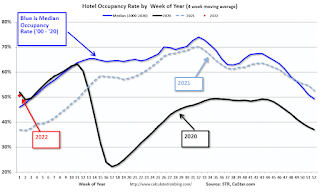 This graph shows the seasonal pattern for the hotel occupancy rate using the four-week average.
 The red dot is for 2022, black is 2020, blue is the median, and dashed light blue is for 2021.
This data is through January 1st. The occupancy rate was down slightly compared to the same week in 2019.
Although down compared to 2019, the 4-week average of the occupancy rate is now above the median rate for the previous 20 years (Blue).
Notes: Y-axis doesn't start at zero to better show the seasonal change.
Notes: Y-axis doesn't start at zero to better show the seasonal change.
The 4-week average of the occupancy rate will increase seasonally over the next few months. The key question is: How much business travel will return?
This graph is from Apple mobility. From Apple: "This data is generated by counting the number of requests made to Apple Maps for directions in select countries/regions, sub-regions, and cities." This is just a general guide - people that regularly commute probably don't ask for directions.
 This data is through January 8th
 for the United States and several selected cities.
The graph is the running 7-day average to remove the impact of weekends.
IMPORTANT: All data is relative to January 13, 2020. This data is NOT Seasonally Adjusted. People walk and drive more when the weather is nice, so I'm just using the transit data.
According to the Apple data directions requests, public transit in the 7-day average for the US is at 85% of the January 2020 level.
Here is some interesting data on New York subway usage (HT BR).
 This graph is from Todd W Schneider.
 This graph shows how much MTA traffic has recovered in each borough (Graph starts at first week in January 2020 and 100 = 2019 average).
Manhattan is at about 27% of normal (impacted by holidays too).
This data is through Friday,January 7th.
He notes: "Data updates weekly from the MTA’s public turnstile data, usually on Saturday mornings".
Sunday, January 09, 2022
Sunday Night Futures
by Calculated Risk on 1/09/2022 07:02:00 PM
Weekend:
• Schedule for Week of January 9, 2022
Monday:
• No major economic releases scheduled.
From CNBC: Pre-Market Data and Bloomberg futures S&P 500 futures are down 11 and DOW futures are down 91 (fair value).
Oil prices were up over the last week with WTI futures at $78.90 per barrel and Brent at $81.75 per barrel. A year ago, WTI was at $52, and Brent was at $56 - so WTI oil prices are up 50% year-over-year.
Here is a graph from Gasbuddy.com for nationwide gasoline prices. Nationally prices are at $3.29 per gallon. A year ago prices were at $2.31 per gallon, so gasoline prices are up $0.98 per gallon year-over-year.
Lawler: More on Investor Purchases of Single-Family Homes
by Calculated Risk on 1/09/2022 09:55:00 AM
Today, in the Calculated Risk Real Estate Newsletter: Lawler: More on Investor Purchases of Single-Family Homes
A brief excerpt:
From housing economist Tom Lawler:There is much more in the article. You can subscribe at https://calculatedrisk.substack.com/
Recent reports showing a surge in investor purchases of single-family homes beginning last spring has stunned quite a few housing analysts and led several to reassess the “drivers” of the surprising strength in housing and home prices this year.
One of the reports I’m referring to is from Redfin, and the other is from CoreLogic. While both are based on an analysis of property records, there are key differences.
Before going into some of the potential ramifications of this investor surge, however, I thought it might be useful to discuss these reports – especially in light of a recent “research” report from the trade association “dedicated to advocating on behalf of the single-family rental industry” that completed botched its analysis of these recent reports.


