 RSS Feed
 by Calculated Risk on 1/12/2022 07:00:00 AM
Wednesday, January 12, 2022
MBA: Mortgage Applications Increase in Latest Weekly Survey
From the MBA: Mortgage Applications Increase in Latest MBA Weekly Survey
Mortgage applications increased 1.4 percent from one week earlier, according to data from the Mortgage Bankers Association’s (MBA) Weekly Mortgage Applications Survey for the week ending January 7, 2022. The previous week’s results included an adjustment for the holidays.
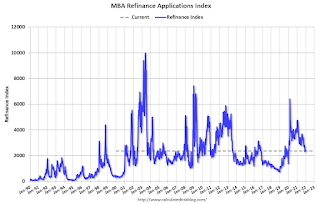
... The Refinance Index decreased 0.1 percent from the previous week and was 50 percent lower than the same week one year ago. The seasonally adjusted Purchase Index increased 2 percent from one week earlier. The unadjusted Purchase Index increased 51 percent compared with the previous week and was 17 percent lower than the same week one year ago.
“Mortgage rates increased significantly across all loan types last week as the Federal Reserve’s signaling of tighter policy ahead pushed U.S. Treasury yields higher. The 30-year fixed rate hit 3.52 percent, its highest level since March 2020. Rates at these levels are quickly closing the door on refinance opportunities for many borrowers. Although refinance activity changed little over the week, applications remained at their lowest level in over a month, and conventional refinance applications were at their lowest level since January 2020,” said Joel Kan, MBA’s Associate Vice President of Economic and Industry Forecasting. “The housing market started 2022 on a strong note. Both conventional and government purchase applications showed increases, with FHA purchase applications increasing almost 9 percent, and VA applications increasing more than 5 percent. MBA expects solid growth in purchase activity this year, as demographic drivers and the strong economy support housing demand. However, the strength in growth will be dependent on housing inventory growing more rapidly to meet demand.”
...
The average contract interest rate for 30-year fixed-rate mortgages with conforming loan balances ($647,200 or less) increased to 3.52 percent from 3.33 percent, with points decreasing to 0.45 from 0.48 (including the origination fee) for 80 percent loan-to-value ratio (LTV) loans.
emphasis added
 Click on graph for larger image.
The first graph shows the refinance index since 1990.
The refinance index will probably decline sharply next week.
The second graph shows the MBA mortgage purchase index
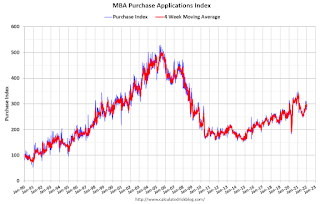 According to the MBA, purchase activity is down 17% year-over-year unadjusted.
Note: Red is a four-week average (blue is weekly).
Tuesday, January 11, 2022
Wednesday: CPI
by Calculated Risk on 1/11/2022 07:11:00 PM
Wednesday:
• At 7:00 AM ET, The Mortgage Bankers Association (MBA) will release the results for the mortgage purchase applications index.
• At 8:30 AM, The Consumer Price Index for December from the BLS. The consensus is for 0.5% increase in CPI, and a 0.5% increase in core CPI.
On COVID (focus on hospitalizations and deaths):
| COVID Metrics | ||||
|---|---|---|---|---|
| Now | Week Ago | Goal | ||
| Percent fully Vaccinated | 62.6% | --- | ≥70.0%1 | |
| Fully Vaccinated (millions) | 207.8 | --- | ≥2321 | |
| New Cases per Day3🚩 | 750,996 | 509,446 | ≤5,0002 | |
| Hospitalized3🚩 | 119,115 | 86,401 | ≤3,0002 | |
| Deaths per Day3🚩 | 1,633 | 1,163 | ≤502 | |
| 1 Minimum to achieve "herd immunity" (estimated between 70% and 85%). 2my goals to stop daily posts, 37-day average for Cases, Currently Hospitalized, and Deaths 🚩 Increasing 7-day average week-over-week for Cases, Hospitalized, and Deaths ✅ Goal met. | ||||
 Click on graph for larger image.
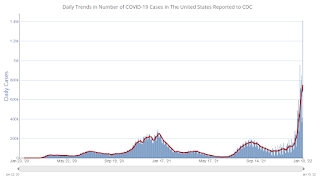
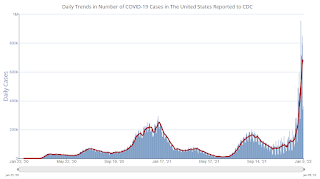
This graph shows the daily (columns) and 7-day average (line) of positive tests reported.
New cases are at record levels (1.4 million today!). It appears likely hospitalizations will exceed the previous 7-day average record of 124,031 a year ago.
Fortunately, deaths are still well below the previous 7-day average record of 3,421 in January 2021.
Update: The Inland Empire
by Calculated Risk on 1/11/2022 03:58:00 PM
Way back in 2006 I disagreed with some analysts on the outlook for the Inland Empire in California. I wrote:
As the housing bubble unwinds, housing related employment will fall; and fall dramatically in areas like the Inland Empire. The more an area is dependent on housing, the larger the negative impact on the local economy will be.And sure enough, the economies of housing dependent areas like the Inland Empire were devastated during the housing bust. However, prior to the pandemic, the Inland Empire was coming back strong.
So I think some pundits have it backwards: Instead of a strong local economy keeping housing afloat, I think the bursting housing bubble will significantly impact housing dependent local economies.
 Click on graph for larger image.
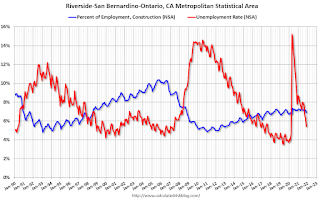
This graph shows the unemployment rate for the Inland Empire (using MSA: Riverside, San Bernardino, Ontario), and also the number of construction jobs as a percent of total employment.
The unemployment rate was falling before the pandemic and was down to 3.6% (down from 14.4% in 2010). During the pandemic, the unemployment rate increased to 15.2%, but is down to 5.4%.
And construction employment is up from the lows (as a percent of total employment), but still well below the bubble years.
So, the Inland Empire economy isn't as heavily depending on construction as during the bubble.
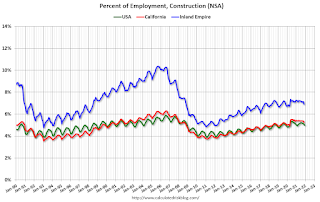 The second graph shows the number of construction jobs as a percent of total employment for the Inland Empire, all of California, and the entire U.S.
Clearly the Inland Empire is more dependent on construction than most areas. Construction employment - as a percent of total employment - has picked up but is still below the levels during the housing bubble.
So, the Inland Empire economy isn't as heavily depending on construction as during the bubble.
The second graph shows the number of construction jobs as a percent of total employment for the Inland Empire, all of California, and the entire U.S.Clearly the Inland Empire is more dependent on construction than most areas. Construction employment - as a percent of total employment - has picked up but is still below the levels during the housing bubble.
Homebuilder Comments in December: “Still a ton of demand for new homes"
by Calculated Risk on 1/11/2022 12:21:00 PM
Today, in the Calculated Risk Real Estate Newsletter: Homebuilder Comments in December: “Still a ton of demand for new homes"
A brief excerpt:
Some homebuilder comments courtesy of Rick Palacios Jr., Director of Research at John Burns Real Estate Consulting (a must follow for housing on twitter!):There is much more in the article. You can subscribe at https://calculatedrisk.substack.com/
Here is Rick’s summary of builder comments for various markets (emphasis added in bold):
Home builder survey results are in for full month of December. Top themes: 1) Still a ton of demand for new homes. 2) Rampant construction material & labor shortages. 3) Bit of chatter on possible margin compression several quarters ahead. Market commentary to follow…
#Atlanta builder: “Have virtually no available inventory & huge backlog of 1,000+ units going in to 2022. Still metering sales in most communities, where the demand of waiting buyers still outnumbers our supply.”
#LasVegas builder: “Busiest orders for December I can remember in a long time.”
#Charlotte builder: “Haven’t seen this hot of a new homebuilding market in 27 years in Charlotte. Reminds me of the go-go days in the late 1980's right before the S & L's (Savings & Loan Crisis) rocked my new homebuilding world in Southern California.”
Missing Workers by Age Group
by Calculated Risk on 1/11/2022 10:11:00 AM
Note: This is an update to an earlier post.
In November, Goldman Sachs economists put out a research note on the labor force participation rate: Why Isn’t Labor Force Participation Recovering?
Here are few excerpts from the note:
 Click on graph for larger image.
This data is comparing December 2021 to December 2019, using Not Seasonally Adjusted (NSA) data (I compared to December 2019 to minimize the seasonal impact when using NSA data).
While the unemployment rate continues to fall quickly, labor force participation has made no progress since August 2020. ... Most of the 5.0mn persons who have exited the labor force since the start of the pandemic are over age 55 (3.4mn), largely reflecting early (1.5mn) and natural (1mn) retirements that likely won’t reverse. The outlook for prime-age persons who have exited the labor force (1.7mn) is more positive, since very few are discouraged and most still view their exits as temporary.
First, there are two important monthly surveys from the BLS. The participation rate (and unemployment rate) comes from the Current Population Survey (CPS: commonly called the household survey), a monthly survey of about 60,000 households.
The jobs number comes from Current Employment Statistics (CES: payroll survey), a sample of approximately 634,000 business establishments nationwide.
These are very different surveys: the CPS gives the total number of employed (and unemployed including the alternative measures), and the CES gives the total number of positions (excluding some categories like the self-employed, and a person working two jobs counts as two positions).
Currently the payroll survey shows there are 3.6 million fewer jobs than in February 2020 (pre-pandemic).
The household survey shows there are 2.9 million fewer people employed than in February 2020.
Note: The 5 million number for the labor force, probably assumes some normal labor force growth; however, overall population growth has been dismal over the last 2 years (little immigration and large number of deaths). I'm not confident in Goldman's 5-million-person estimate.
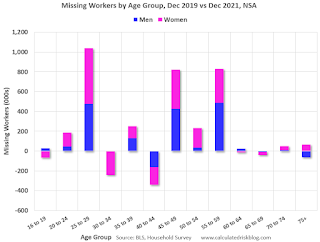
Here is a graph of the number of missing people by age group (from the CPS household survey).
Click on graph for larger image.This data is comparing December 2021 to December 2019, using Not Seasonally Adjusted (NSA) data (I compared to December 2019 to minimize the seasonal impact when using NSA data).
Positive numbers are missing workers.
Almost all of the missing employed workers - by this method - are in the 25 to 29, 45 to 49, and in the 55 to 59 age groups.
Note: this is over a 2-year period, and there have been some demographic shifts between cohorts.
This data would suggest most of the missing workers are prime age or took early retirement (the missing workers in their '50s).
Leading Index for Commercial Real Estate "Declines in December"; Up Sharply Year-over-year
by Calculated Risk on 1/11/2022 08:34:00 AM
From Dodge Data Analytics: Dodge Momentum Index Declines In December
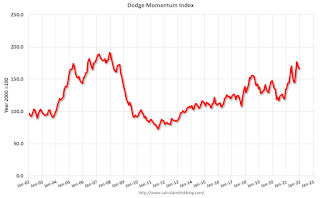
The Dodge Momentum Index fell 3% in December to 166.4 (2000=100), down from the revised November reading of 170.7. The Momentum Index, issued by Dodge Construction Network, is a monthly measure of the initial report for nonresidential building projects in planning, which have been shown to lead construction spending for nonresidential buildings by a full year. In December, commercial planning fell 4%, and institutional planning slipped 1%.
Despite these declines, 2021 was a banner year for the Dodge Momentum Index — despite the lingering risks of COVID-19 and low demand for some types of nonresidential buildings. Throughout the year, the overall Momentum Index increased 23%, the strongest annual gain since 2005. Both the commercial and institutional components of the Momentum Index saw similar gains — with their levels of activity reaching 13- and 14-year highs, respectively.
emphasis added
 Click on graph for larger image.
This graph shows the Dodge Momentum Index since 2002. The index was at 166.4 in December, down from 170.7 in November.
According to Dodge, this index leads "construction spending for nonresidential buildings by a full year". This index suggested a decline in Commercial Real Estate construction through most of 2021, but a solid pickup in 2022.
Monday, January 10, 2022
Tuesday: Fed Chair Powell Nomination Hearing
by Calculated Risk on 1/10/2022 08:55:00 PM
From Matthew Graham at Mortgage News Daily: Mortgage Rates Spiking at Fastest Pace in a Long Time
This morning's additional weakness in the bond market brings the average conventional 30yr fixed scenario closer to 3.625% (as always, rate quotes depend on multiple factors, and the overall range is very wide). [30 year fixed 3.64%]Tuesday:
emphasis added
• At 6:00 AM ET, NFIB Small Business Optimism Index for December.
• At 10:00 AM, Testimony, Fed Chair Jerome Powell, Nomination Hearing, Before the Committee on Banking, Housing, and Urban Affairs, U.S. Senate
On COVID (focus on hospitalizations and deaths):
| COVID Metrics | ||||
|---|---|---|---|---|
| Today | Week Ago | Goal | ||
| Percent fully Vaccinated | 62.5% | --- | ≥70.0%1 | |
| Fully Vaccinated (millions) | 207.7 | --- | ≥2321 | |
| New Cases per Day3🚩 | 674,406 | 443,099 | ≤5,0002 | |
| Hospitalized3🚩 | 109,874 | 81,843 | ≤3,0002 | |
| Deaths per Day3🚩 | 1,552 | 1,181 | ≤502 | |
| 1 Minimum to achieve "herd immunity" (estimated between 70% and 85%). 2my goals to stop daily posts, 37-day average for Cases, Currently Hospitalized, and Deaths 🚩 Increasing 7-day average week-over-week for Cases, Hospitalized, and Deaths ✅ Goal met. | ||||
 Click on graph for larger image.
This graph shows the daily (columns) and 7-day average (line) of positive tests reported.
New cases are at record levels. It appears likely hospitalizations will exceed the previous 7-day average record of 124,031 a year ago.
Fortunately, deaths are still well below the previous 7-day average record of 3,421 in January 2021.
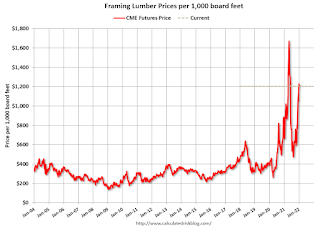
Update: Framing Lumber Prices Up 75% Year-over-year
by Calculated Risk on 1/10/2022 04:15:00 PM
Here is another monthly update on framing lumber prices.
This graph shows CME random length framing futures through January 10th.
Lumber was at $1,160 per 1000 board feet this morning.
This is down from a peak of $1,733, but up $515 from a year ago.
 Click on graph for larger image in graph gallery.
A combination of strong demand and various supply constraints have pushed up the price of lumber again.
Click on graph for larger image in graph gallery.Lumber price are up 75% year-over-year.
A combination of strong demand and various supply constraints have pushed up the price of lumber again.
Q4 2021 Update: Unofficial Problem Bank list Decreased to 57 Institutions
by Calculated Risk on 1/10/2022 02:50:00 PM
The FDIC's official problem bank list is comprised of banks with a CAMELS rating of 4 or 5, and the list is not made public (just the number of banks and assets every quarter). Note: Bank CAMELS ratings are also not made public.
CAMELS is the FDIC rating system, and stands for Capital adequacy, Asset quality, Management, Earnings, Liquidity and Sensitivity to market risk. The scale is from 1 to 5, with 1 being the strongest.
As a substitute for the CAMELS ratings, surferdude808 is using publicly announced formal enforcement actions, and also media reports and company announcements that suggest to us an enforcement action is likely, to compile a list of possible problem banks in the public interest.
DISCLAIMER: This is an unofficial list, the information is from public sources only, and while deemed to be reliable is not guaranteed. No warranty or representation, expressed or implied, is made as to the accuracy of the information contained herein and same is subject to errors and omissions. This is not intended as investment advice. Please contact CR with any errors.
Here are the quarterly changes and a few comments from surferdude808:
Update on the Unofficial Problem Bank List through December 31, 2021. Since the last update at the end of September 2021, the list decreased by two to 57 institutions after two additions and four removals. Assets increased by $1.7 billion to $56.6 billion, with the change primarily resulting from a $1.7 billion increase from updated asset figures through September 30, 2021. A year ago, the list held 65 institutions with assets of $58.2 billion.
Additions during the fourth quarter included BancCentral, National Association, Alva, OK ($542 million) and Herring Bank, Amarillo, TX ($521 million). Removals during the quarter because of action termination included Texas Citizens Bank, National Association, Pasadena, TX ($515 million); Civis Bank, Rogersville, TN ($189 million); and Canyon Community Bank, National Association, Tucson, AZ ($146 million). CornerstoneBank, Atlanta, GA ($224 million) exited through an unassisted merger. On November 30, 2021, the FDIC released third quarter results and provided an update on the Official Problem Bank List. In that release, the FDIC said there were 46 institutions with assets of $51 billion on the official list, down from the 51 institutions but up in assets from $46 billion in the second quarter of 2021.
With the conclusion of the fourth quarter, we bring an updated transition matrix to detail how banks are transitioning off the Unofficial Problem Bank List. Since we first published the Unofficial Problem Bank List on August 7, 2009 with 389 institutions, 1,781 institutions have appeared on a weekly or monthly list since then. Only 3.2 percent of the banks that have appeared on a list remain today as 1,724 institutions have transitioned through the list. Departure methods include 1,017 action terminations, 411 failures, 278 mergers, and 19 voluntary liquidations. Of the 389 institutions on the first published list, only 3 or less than 1.0 percent, still have a troubled designation more than ten years later. The 411 failures represent 23.1 percent of the 1,781 institutions that have made an appearance on the list. This failure rate is well above the 10-12 percent rate frequently cited in media reports on the failure rate of banks on the FDIC's official list.
2nd Look at Local Housing Markets in December
by Calculated Risk on 1/10/2022 12:37:00 PM
Today, in the Calculated Risk Real Estate Newsletter: 2nd Look at Local Housing Markets in December
A brief excerpt:
Commenting on the slowdown in sales, Dick Beeson, managing broker at RE/MAX Northwest Realtors, said, "That's to be expected considering inventory in the fourth quarter was down sharply from last year. You can't sell what isn't there."There is much more in the article. You can subscribe at https://calculatedrisk.substack.com/
...
Here is a summary of active listings for these housing markets in December. Inventory was down 22.7% in December month-over-month (MoM) from November, and down 34.2% year-over-year (YoY).
Inventory almost always declines seasonally in December, so the MoM decline is not a surprise. Last month, these markets were down 30.5% YoY, so the YoY decline in December is larger than in November. This isn’t indicating a slowing market.
Notes for all tables:
1. New additions to table in BOLD.
2. Northwest (Seattle), North Texas (Dallas), Jacksonville, Source: Northeast Florida Association of REALTORS®


