 RSS Feed
 by Calculated Risk on 1/13/2022 08:34:00 AM
Thursday, January 13, 2022
Weekly Initial Unemployment Claims Increase to 230,000
The DOL reported:
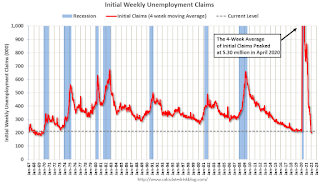
In the week ending January 8, the advance figure for seasonally adjusted initial claims was 230,000, an increase of 23,000 from the previous week's unrevised level of 207,000. The 4-week moving average was 210,750, an increase of 6,250 from the previous week's unrevised average of 204,500.The following graph shows the 4-week moving average of weekly claims since 1971.
emphasis added
 Click on graph for larger image.
The dashed line on the graph is the current 4-week average. The four-week average of weekly unemployment claims increased to 210,750.
The previous week was unrevised.
Weekly claims were above the consensus forecast, perhaps due to the current COVID wave.
Wednesday, January 12, 2022
Thursday: Unemployment Claims, PPI
by Calculated Risk on 1/12/2022 08:52:00 PM
Thursday:
• At 8:30 AM ET, the initial weekly unemployment claims report will be released. The consensus is for 210 thousand initial claims.
• Also, at 8:30 AM, The Producer Price Index for December from the BLS. The consensus is for a 0.4% increase in PPI, and a 0.5% increase in core PPI.
• At 10:00 AM, Testimony, Fed Governor Lael Brainard, Nomination Hearing, Before the Committee on Banking, Housing, and Urban Affairs, U.S. Senate
And on COVID (focus on hospitalizations and deaths):
| COVID Metrics | ||||
|---|---|---|---|---|
| Now | Week Ago | Goal | ||
| Percent fully Vaccinated | 62.6% | --- | ≥70.0%1 | |
| Fully Vaccinated (millions) | 208.0 | --- | ≥2321 | |
| New Cases per Day3🚩 | 761,535 | 556,134 | ≤5,0002 | |
| Hospitalized3🚩 | 124,163 | 91,030 | ≤3,0002 | |
| Deaths per Day3🚩 | 1,656 | 1,238 | ≤502 | |
| 1 Minimum to achieve "herd immunity" (estimated between 70% and 85%). 2my goals to stop daily posts, 37-day average for Cases, Currently Hospitalized, and Deaths 🚩 Increasing 7-day average week-over-week for Cases, Hospitalized, and Deaths ✅ Goal met. | ||||
 Click on graph for larger image.
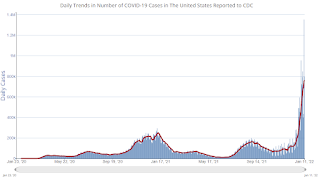
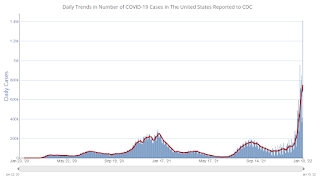
This graph shows the daily (columns) and 7-day average (line) of positive tests reported.
The 7-day average for new cases and hospitalizations are at record levels.
Fortunately, deaths are still below the previous 7-day average record of 3,421 per day in January 2021.
Fed's Beige Book: "A sudden pull back in leisure travel, hotel occupancy and patronage at restaurants"
by Calculated Risk on 1/12/2022 03:08:00 PM
Fed's Beige Book "This report was prepared at the Federal Reserve Bank of Kansas City based on information collected on or before January 3, 2022."
Economic activity across the United States expanded at a modest pace in the final weeks of 2021. Contacts from many Districts indicated growth continued to be constrained by ongoing supply chain disruptions and labor shortages. Despite the modest pace of growth, demand for materials and inputs, and demand for workers, remained elevated among businesses. Lending activity picked up slightly toward the end of the year, led by commercial real estate borrowers. Consumer spending continued to grow at a steady pace ahead of the rapid spread of the Omicron COVID-19 variant. Most Districts noted a sudden pull back in leisure travel, hotel occupancy and patronage at restaurants as the number of new cases rose in recent weeks. Although optimism remained high generally, several Districts cited reports from businesses that expectations for growth over the next several months cooled somewhat during the last few weeks. The manufacturing sector continued to expand nationally, with some regional differences in the pace of growth. Overall activity in the transportation sector expanded at a moderate pace. While farm incomes were elevated throughout 2021, agricultural conditions were marred by drought conditions across several Districts.
...
Employment grew modestly in recent weeks, but contacts from most Districts reported that demand for additional workers remains strong. Job openings were up but overall payroll growth was constrained by persistent labor shortages. Tightness in labor markets drove robust wage growth nationwide, with some Districts highlighting additional growth in labor costs associated with non-wage benefits. While many contacts noted that wage gains among low-skill workers were particularly strong, compensation growth remained well above historical averages across industries, across worker demographics, and across geographies. Besides wage gains, many contacts indicated adjustments to job demands – such as accommodating part-time work or adjusting qualification requirements – to attract more applicants and retain existing workforces.
emphasis added
Cleveland Fed: Median CPI increased 0.4% and Trimmed-mean CPI increased 0.4% in December
by Calculated Risk on 1/12/2022 12:38:00 PM
The Cleveland Fed released the median CPI and the trimmed-mean CPI this morning:
According to the Federal Reserve Bank of Cleveland, the median Consumer Price Index rose 0.4% in December. The 16% trimmed-mean Consumer Price Index increased 0.4% in December. "The median CPI and 16% trimmed-mean CPI are measures of core inflation calculated by the Federal Reserve Bank of Cleveland based on data released in the Bureau of Labor Statistics’ (BLS) monthly CPI report".
Note: The Cleveland Fed released the median CPI details here: "Used Cars" were up 51% annualized.
Note that Owners' Equivalent Rent and Rent of Primary Residence account for almost 1/3 of median CPI, and these measures were up around 5% annualized in December.
 Click on graph for larger image.
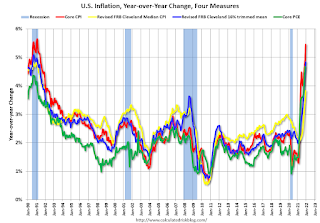
This graph shows the year-over-year change for these four key measures of inflation.
Click on graph for larger image.This graph shows the year-over-year change for these four key measures of inflation.
On a year-over-year basis, the median CPI rose 3.8%, the trimmed-mean CPI rose 4.8%, and the CPI less food and energy rose 5.5%. Core PCE is for November and increased 4.7% year-over-year.
Mortgage Rates: Moving on Up; Refinance Activity Will Slow Sharply
by Calculated Risk on 1/12/2022 11:39:00 AM
Today, in the Calculated Risk Real Estate Newsletter: Mortgage Rates: Moving on Up
A brief excerpt:
The general rule of thumb is refinance activity will be strong if current mortgage rates are 50bps lower than the maximum of the previous year (this is just a general rule - but it works pretty well).There is much more in the article. You can subscribe at https://calculatedrisk.substack.com/
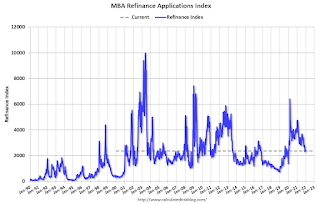
The following graph shows the MBA Refinance Index (Blue) and the change in mortgage rates (Red). The change is calculated as Maximum in Previous Year minus the current rate). When the red line is above 0.5% (more than 50bps decline in mortgage rates), then refinance activity generally picks up.
Currently the maximum for the last year is 3.22% (excluding this week), and with current rates at 3.59%, refinance activity will probably decline significantly over the next few weeks.
BLS: CPI increased 0.5% in December; Core CPI increased 0.6%
by Calculated Risk on 1/12/2022 08:32:00 AM
The Consumer Price Index for All Urban Consumers (CPI-U) increased 0.5 percent in December on a seasonally adjusted basis after rising 0.8 percent in November, the U.S. Bureau of Labor Statistics reported today. Over the last 12 months, the all items index increased 7.0 percent before seasonal adjustment.Both CPI and core CPI were close to expectations. I'll post a graph later today after the Cleveland Fed releases the median and trimmed-mean CPI.
Increases in the indexes for shelter and for used cars and trucks were the largest contributors to the seasonally adjusted all items increase. The food index also contributed, although it increased less than in recent months, rising 0.5 percent in December. The energy index declined in December, ending a long series of increases; it fell 0.4 percent as the indexes for gasoline and natural gas both decreased.
The index for all items less food and energy rose 0.6 percent in December following a 0.5-percent increase in November. This was the sixth time in the last 9 months it has increased at least 0.5 percent. Along with the indexes for shelter and for used cars and trucks, the indexes for household furnishings and operations, apparel, new vehicles, and medical care all increased in December. As in November, the indexes for motor vehicle insurance and recreation were among the few to decline over the month.
The all items index rose 7.0 percent for the 12 months ending December, the largest 12-month increase since the period ending June 1982. The all items less food and energy index rose 5.5 percent, the largest 12-month change since the period ending February 1991. The energy index rose 29.3 percent over the last year, and the food index increased 6.3 percent.
emphasis added
MBA: Mortgage Applications Increase in Latest Weekly Survey
by Calculated Risk on 1/12/2022 07:00:00 AM
From the MBA: Mortgage Applications Increase in Latest MBA Weekly Survey
Mortgage applications increased 1.4 percent from one week earlier, according to data from the Mortgage Bankers Association’s (MBA) Weekly Mortgage Applications Survey for the week ending January 7, 2022. The previous week’s results included an adjustment for the holidays.
... The Refinance Index decreased 0.1 percent from the previous week and was 50 percent lower than the same week one year ago. The seasonally adjusted Purchase Index increased 2 percent from one week earlier. The unadjusted Purchase Index increased 51 percent compared with the previous week and was 17 percent lower than the same week one year ago.
“Mortgage rates increased significantly across all loan types last week as the Federal Reserve’s signaling of tighter policy ahead pushed U.S. Treasury yields higher. The 30-year fixed rate hit 3.52 percent, its highest level since March 2020. Rates at these levels are quickly closing the door on refinance opportunities for many borrowers. Although refinance activity changed little over the week, applications remained at their lowest level in over a month, and conventional refinance applications were at their lowest level since January 2020,” said Joel Kan, MBA’s Associate Vice President of Economic and Industry Forecasting. “The housing market started 2022 on a strong note. Both conventional and government purchase applications showed increases, with FHA purchase applications increasing almost 9 percent, and VA applications increasing more than 5 percent. MBA expects solid growth in purchase activity this year, as demographic drivers and the strong economy support housing demand. However, the strength in growth will be dependent on housing inventory growing more rapidly to meet demand.”
...
The average contract interest rate for 30-year fixed-rate mortgages with conforming loan balances ($647,200 or less) increased to 3.52 percent from 3.33 percent, with points decreasing to 0.45 from 0.48 (including the origination fee) for 80 percent loan-to-value ratio (LTV) loans.
emphasis added
 Click on graph for larger image.
The first graph shows the refinance index since 1990.
The refinance index will probably decline sharply next week.
The second graph shows the MBA mortgage purchase index
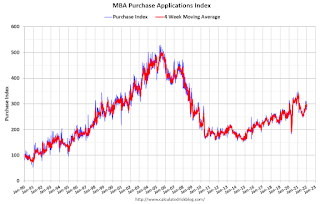 According to the MBA, purchase activity is down 17% year-over-year unadjusted.
Note: Red is a four-week average (blue is weekly).
Tuesday, January 11, 2022
Wednesday: CPI
by Calculated Risk on 1/11/2022 07:11:00 PM
Wednesday:
• At 7:00 AM ET, The Mortgage Bankers Association (MBA) will release the results for the mortgage purchase applications index.
• At 8:30 AM, The Consumer Price Index for December from the BLS. The consensus is for 0.5% increase in CPI, and a 0.5% increase in core CPI.
On COVID (focus on hospitalizations and deaths):
| COVID Metrics | ||||
|---|---|---|---|---|
| Now | Week Ago | Goal | ||
| Percent fully Vaccinated | 62.6% | --- | ≥70.0%1 | |
| Fully Vaccinated (millions) | 207.8 | --- | ≥2321 | |
| New Cases per Day3🚩 | 750,996 | 509,446 | ≤5,0002 | |
| Hospitalized3🚩 | 119,115 | 86,401 | ≤3,0002 | |
| Deaths per Day3🚩 | 1,633 | 1,163 | ≤502 | |
| 1 Minimum to achieve "herd immunity" (estimated between 70% and 85%). 2my goals to stop daily posts, 37-day average for Cases, Currently Hospitalized, and Deaths 🚩 Increasing 7-day average week-over-week for Cases, Hospitalized, and Deaths ✅ Goal met. | ||||
 Click on graph for larger image.
This graph shows the daily (columns) and 7-day average (line) of positive tests reported.
New cases are at record levels (1.4 million today!). It appears likely hospitalizations will exceed the previous 7-day average record of 124,031 a year ago.
Fortunately, deaths are still well below the previous 7-day average record of 3,421 in January 2021.
Update: The Inland Empire
by Calculated Risk on 1/11/2022 03:58:00 PM
Way back in 2006 I disagreed with some analysts on the outlook for the Inland Empire in California. I wrote:
As the housing bubble unwinds, housing related employment will fall; and fall dramatically in areas like the Inland Empire. The more an area is dependent on housing, the larger the negative impact on the local economy will be.And sure enough, the economies of housing dependent areas like the Inland Empire were devastated during the housing bust. However, prior to the pandemic, the Inland Empire was coming back strong.
So I think some pundits have it backwards: Instead of a strong local economy keeping housing afloat, I think the bursting housing bubble will significantly impact housing dependent local economies.
 Click on graph for larger image.
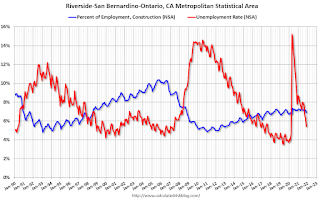
This graph shows the unemployment rate for the Inland Empire (using MSA: Riverside, San Bernardino, Ontario), and also the number of construction jobs as a percent of total employment.
The unemployment rate was falling before the pandemic and was down to 3.6% (down from 14.4% in 2010). During the pandemic, the unemployment rate increased to 15.2%, but is down to 5.4%.
And construction employment is up from the lows (as a percent of total employment), but still well below the bubble years.
So, the Inland Empire economy isn't as heavily depending on construction as during the bubble.
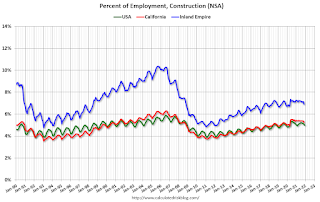 The second graph shows the number of construction jobs as a percent of total employment for the Inland Empire, all of California, and the entire U.S.
Clearly the Inland Empire is more dependent on construction than most areas. Construction employment - as a percent of total employment - has picked up but is still below the levels during the housing bubble.
So, the Inland Empire economy isn't as heavily depending on construction as during the bubble.
The second graph shows the number of construction jobs as a percent of total employment for the Inland Empire, all of California, and the entire U.S.Clearly the Inland Empire is more dependent on construction than most areas. Construction employment - as a percent of total employment - has picked up but is still below the levels during the housing bubble.
Homebuilder Comments in December: “Still a ton of demand for new homes"
by Calculated Risk on 1/11/2022 12:21:00 PM
Today, in the Calculated Risk Real Estate Newsletter: Homebuilder Comments in December: “Still a ton of demand for new homes"
A brief excerpt:
Some homebuilder comments courtesy of Rick Palacios Jr., Director of Research at John Burns Real Estate Consulting (a must follow for housing on twitter!):There is much more in the article. You can subscribe at https://calculatedrisk.substack.com/
Here is Rick’s summary of builder comments for various markets (emphasis added in bold):
Home builder survey results are in for full month of December. Top themes: 1) Still a ton of demand for new homes. 2) Rampant construction material & labor shortages. 3) Bit of chatter on possible margin compression several quarters ahead. Market commentary to follow…
#Atlanta builder: “Have virtually no available inventory & huge backlog of 1,000+ units going in to 2022. Still metering sales in most communities, where the demand of waiting buyers still outnumbers our supply.”
#LasVegas builder: “Busiest orders for December I can remember in a long time.”
#Charlotte builder: “Haven’t seen this hot of a new homebuilding market in 27 years in Charlotte. Reminds me of the go-go days in the late 1980's right before the S & L's (Savings & Loan Crisis) rocked my new homebuilding world in Southern California.”


